| Param | Original file | Final file |
|---|---|---|
| Filename | modeM0/AS1A10_071T01_9000005096_35579cztM0_level2.evt | modeM0/AS1A10_071T01_9000005096_35579cztM0_level2_quad_clean.evt |
| Size (bytes) | 433,854,720 | 75,297,600 |
| Size | 413.8 MB | 71.8 MB |
| Events in quadrant A | 2,599,069 | 499,581 |
| Events in quadrant B | 4,056,818 | 468,154 |
| Events in quadrant C | 3,095,063 | 484,716 |
| Events in quadrant D | 3,042,051 | 470,124 |
| Mode SS | |||
|---|---|---|---|
| Quadrant | BADHDUFLAG | Total packets | Discarded packets |
| A | 0 | 104 | 0 |
| B | 0 | 104 | 0 |
| C | 0 | 104 | 0 |
| D | 0 | 104 | 0 |
| Mode M9 | |||
|---|---|---|---|
| Quadrant | BADHDUFLAG | Total packets | Discarded packets |
| A | 0 | 25 | 0 |
| B | 0 | 25 | 0 |
| C | 0 | 25 | 0 |
| D | 0 | 26 | 0 |
| Mode M0 | |||
|---|---|---|---|
| Quadrant | BADHDUFLAG | Total packets | Discarded packets |
| A | 0 | 10857 | 3 |
| B | 0 | 15278 | 2 |
| C | 0 | 12167 | 2 |
| D | 0 | 12311 | 2 |
| Quadrant | Total seconds | Saturated seconds | Saturation percentage |
|---|---|---|---|
| A | 5097 | 15 | 0.294291% |
| B | 5097 | 511 | 10.025505% |
| C | 5097 | 176 | 3.453012% |
| D | 5097 | 57 | 1.118305% |
Noise dominated data is calculated using 1-second bins in cleaned event files. If a bin has >2000 counts, and if more than 50% of those come from <1% of pixels, then it is considered to be noise-dominated and hence unusable.
| Quadrant | # 1 sec bins | Bins with >0 counts | Bins with >2000 counts | High rate bins dominated by noise | Noise dominated (total time) | Noise dominated (detector-on time) | Marked lightcurve |
|---|---|---|---|---|---|---|---|
| A | 7069 | 5098 | 4 | 4 | 0.06% | 0.08% | 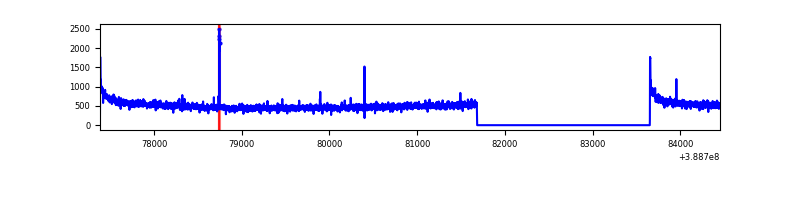 |
| B | 7069 | 5098 | 374 | 374 | 5.29% | 7.34% | 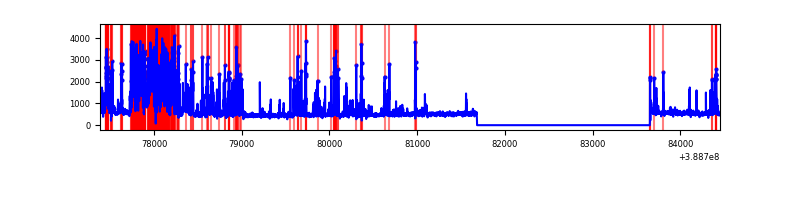 |
| C | 7069 | 5098 | 123 | 123 | 1.74% | 2.41% | 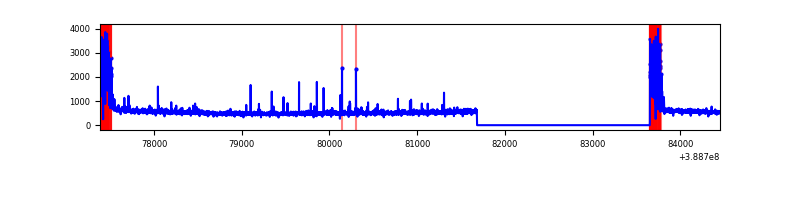 |
| D | 7069 | 5098 | 58 | 58 | 0.82% | 1.14% | 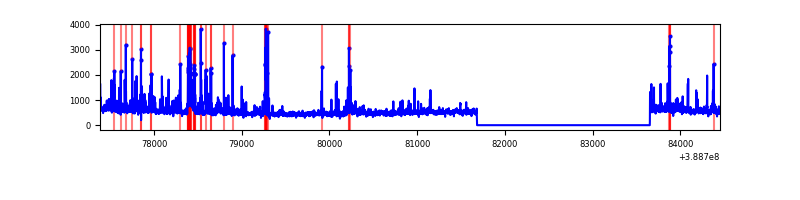 |
Top three noisy pixels from each quadrant. If the there are fewer than three noisy pixels in the level2.evt file, extra rows are filled as -1
| Pixel properties | Quadrant properties | ||||||
|---|---|---|---|---|---|---|---|
| Quadrant | DetID | PixID | Counts | Sigma | Mean | Median | Sigma |
| A | 10 | 83 | 134731 | 1057.58 | 631 | 620 | 126.8 |
| A | 13 | 6 | 15743 | 119.26 | 631 | 620 | 126.8 |
| A | 9 | 143 | 12818 | 96.19 | 631 | 620 | 126.8 |
| B | 5 | 172 | 1690052 | 14773.8 | 598 | 584 | 114.4 |
| B | 12 | 111 | 13724 | 114.9 | 598 | 584 | 114.4 |
| B | 11 | 111 | 12502 | 104.22 | 598 | 584 | 114.4 |
| C | 0 | 10 | 503751 | 3574.12 | 607 | 614 | 140.8 |
| C | 15 | 214 | 211567 | 1498.54 | 607 | 614 | 140.8 |
| C | 14 | 67 | 13387 | 90.74 | 607 | 614 | 140.8 |
| D | 7 | 80 | 274791 | 1834.07 | 613 | 596 | 149.5 |
| D | 12 | 233 | 117420 | 781.43 | 613 | 596 | 149.5 |
| D | 8 | 195 | 117116 | 779.39 | 613 | 596 | 149.5 |
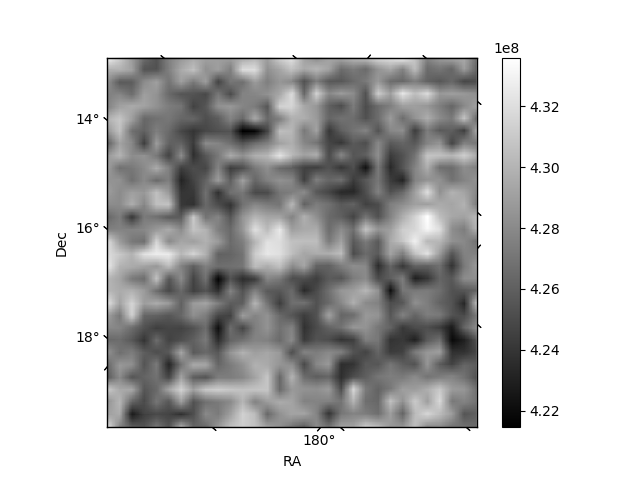
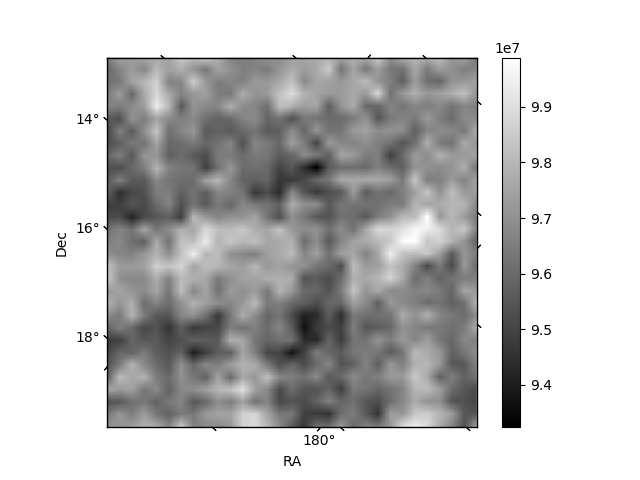
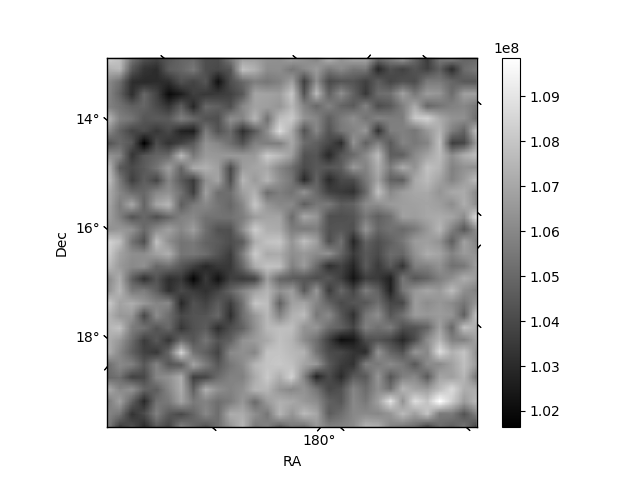
Histogram calculated using DETX and DETY for each event in the final _common_clean file
| Quadrant A | 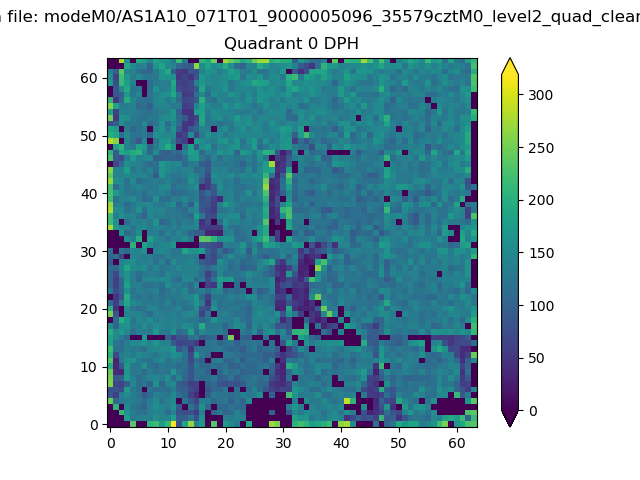 |
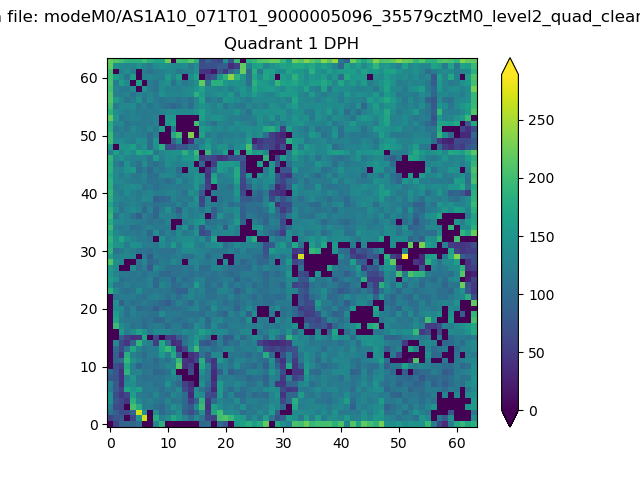 |
Quadrant B |
|---|---|---|---|
| Quadrant D | 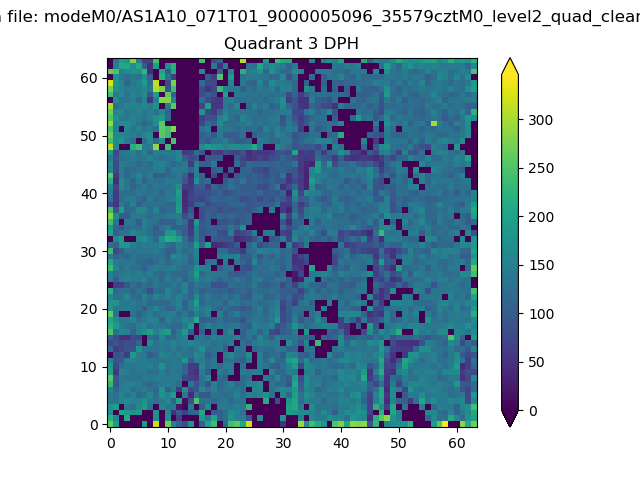 |
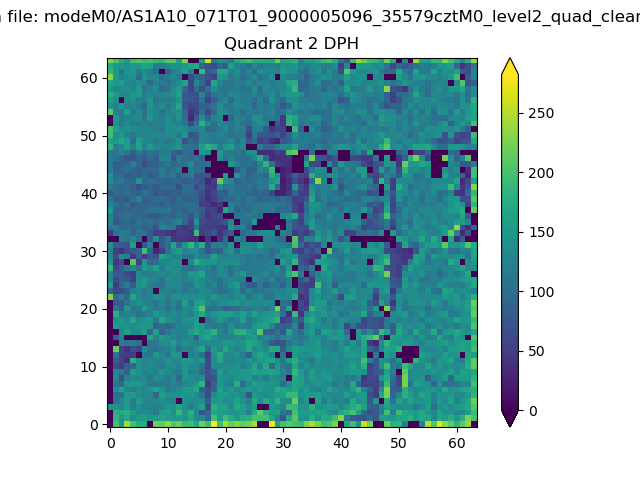 |
Quadrant C |
| Plot type | Count rate plots | Images |
|---|---|---|
| Comparison with Poisson distribution Blue bars denote a histogram of data divided into 1 sec bins. Red curve is a Poisson curve with rate = median count rate of data. |
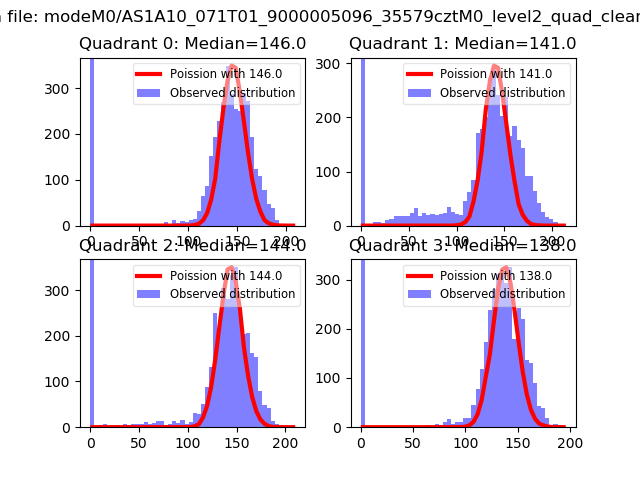 |
 |
| Quadrant-wise count rates Data is divided into 100 sec bins |
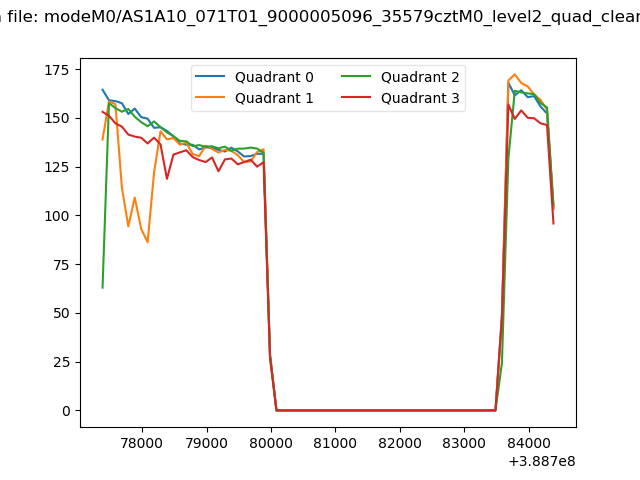 |
|
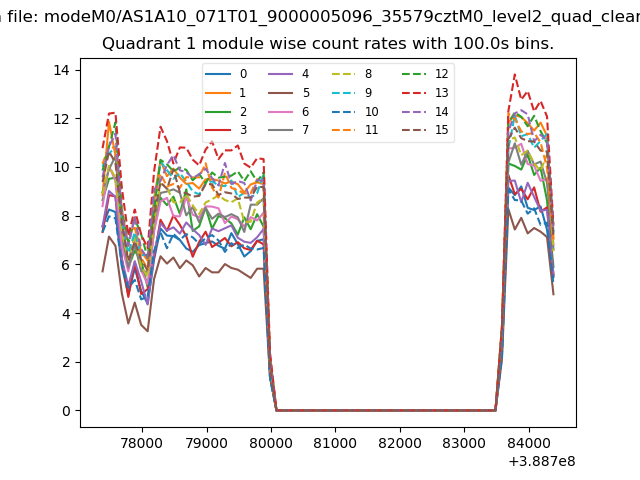
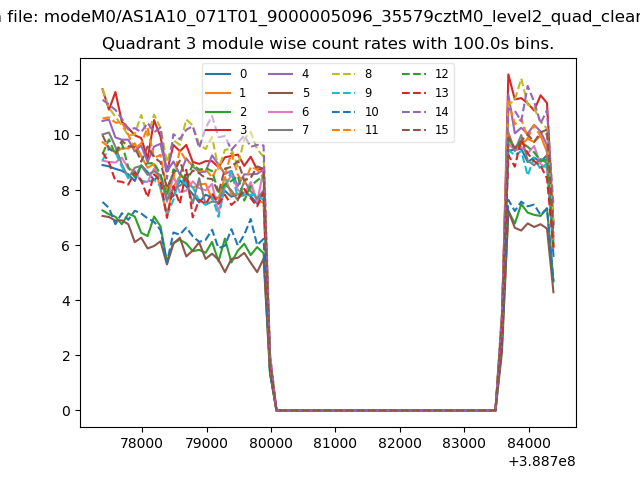
| Module-wise count rates for Quadrant A Data is divided into 100 sec bins |
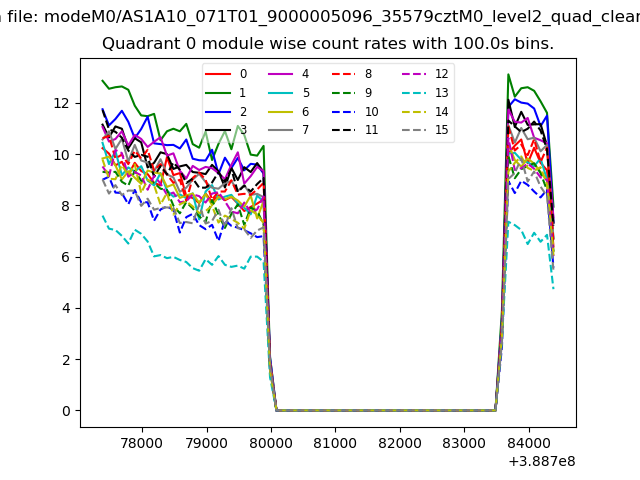 |
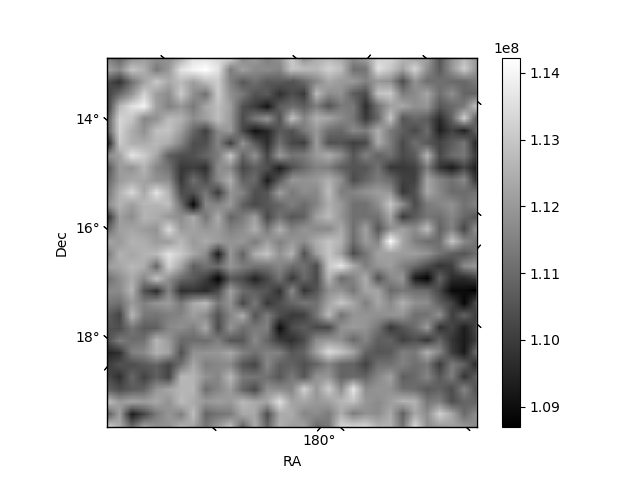 |
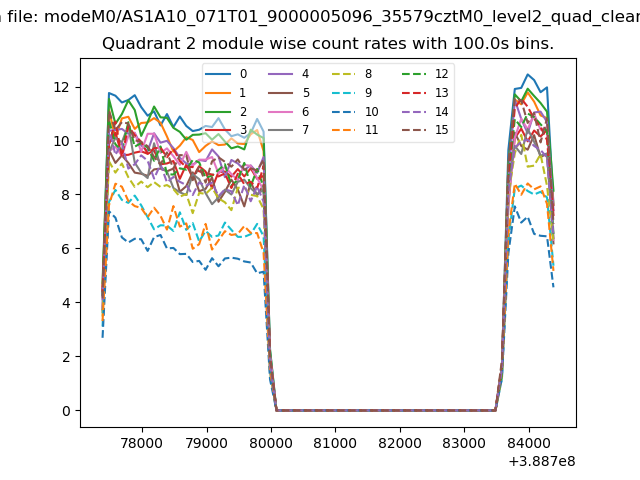
| Module-wise count rates for Quadrant B Data is divided into 100 sec bins |
 |
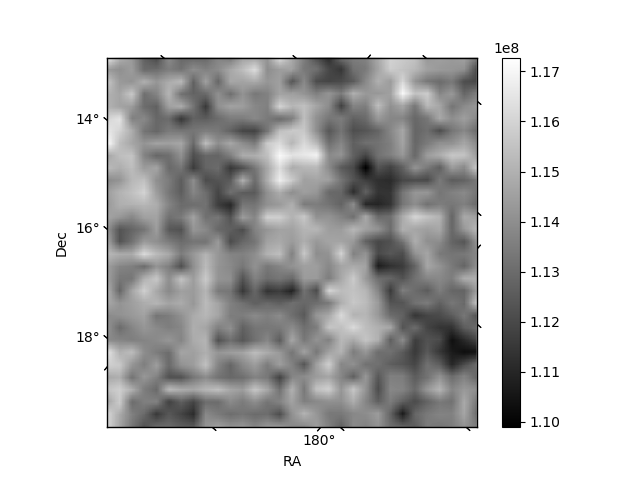 |
| Module-wise count rates for Quadrant C Data is divided into 100 sec bins |
 |
 |
| Module-wise count rates for Quadrant D Data is divided into 100 sec bins |
 |
 |
| Parameter | Plot |
|---|---|
| CZT HV Monitor | 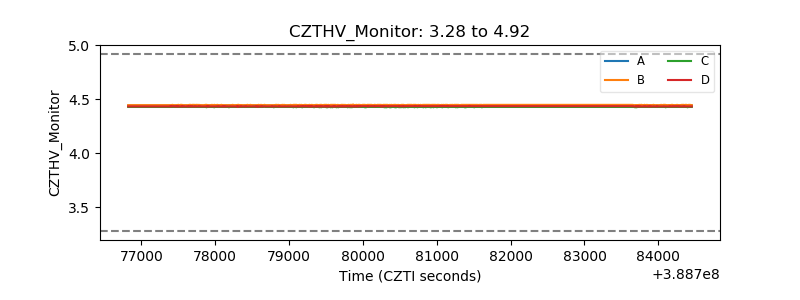 |
| D_VDD | 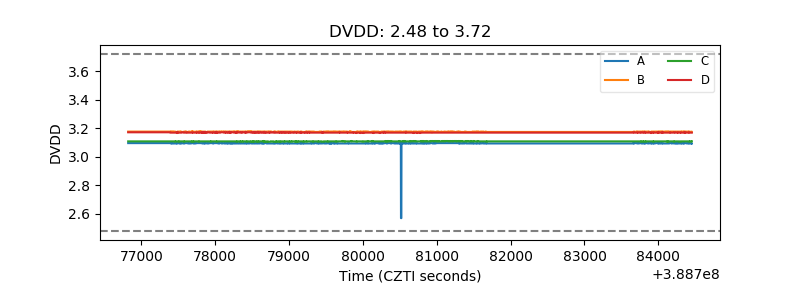 |
| Temperature 1 | 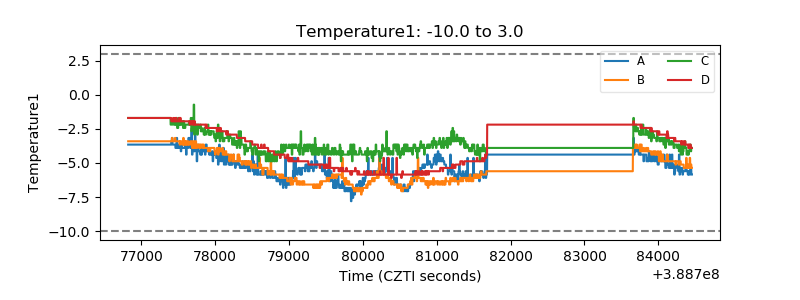 |
| Veto HV Monitor | 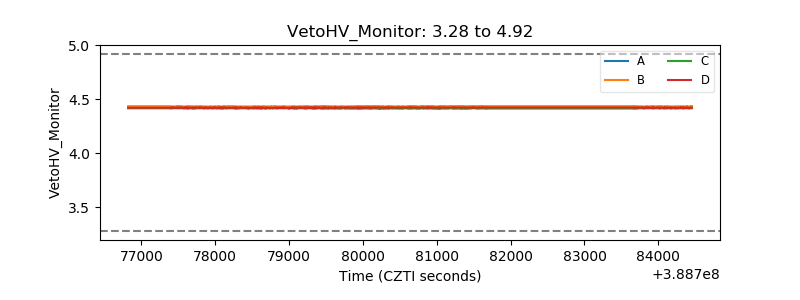 |
| Veto LLD | 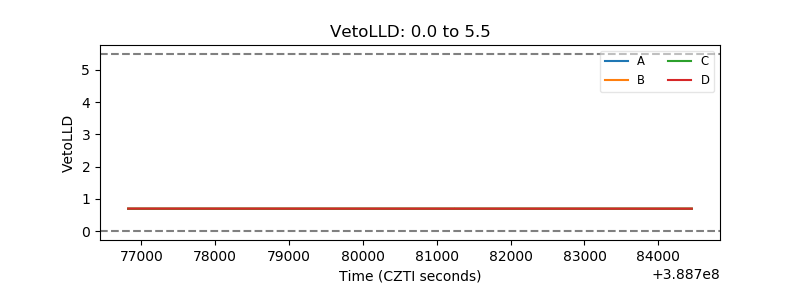 |
| Alpha Counter | 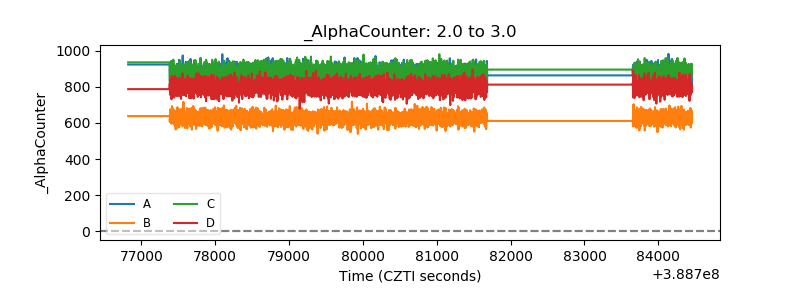 |
| _CPM_Rate | 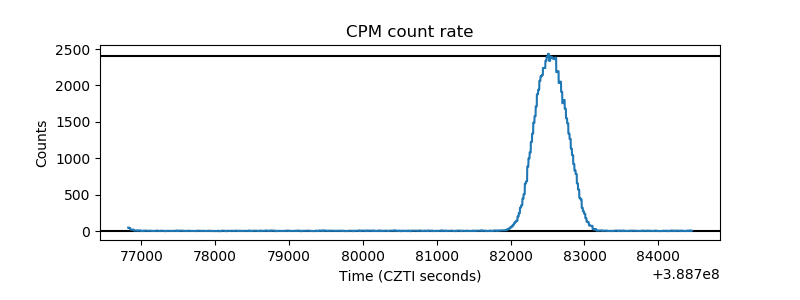 |
| CZT Counter | 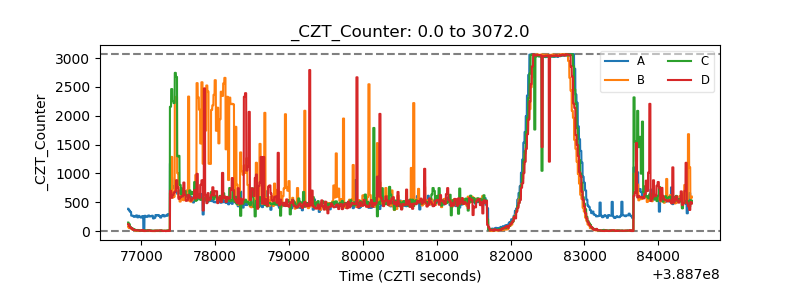 |
| +2.5 Volts monitor | 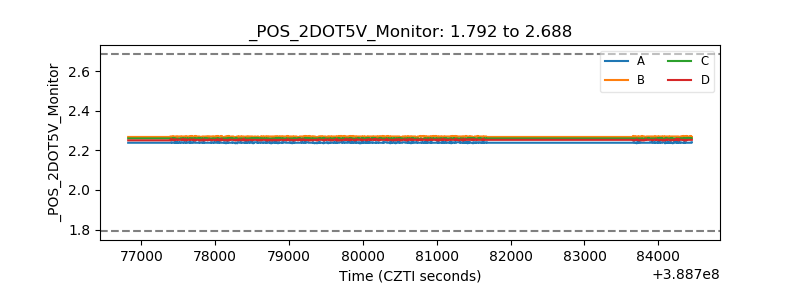 |
| +5 Volts monitor | 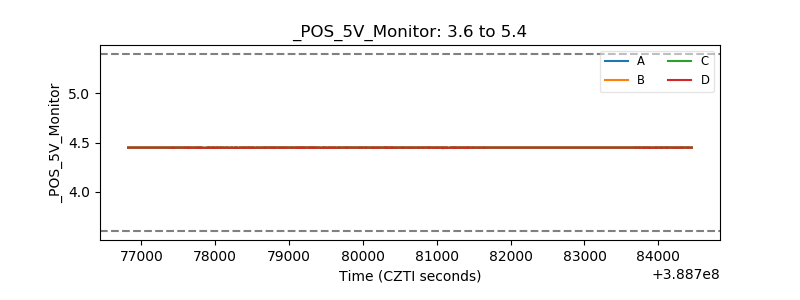 |
| _ROLL_ROT | 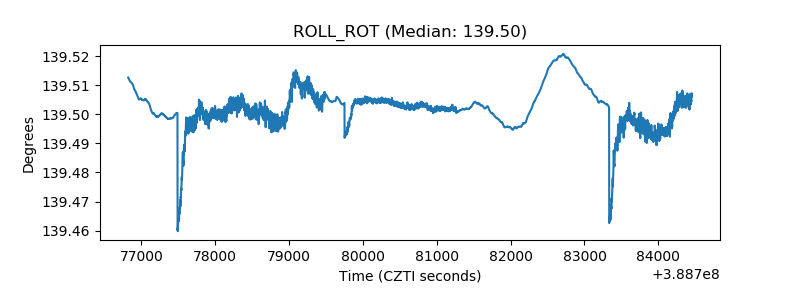 |
| _Roll_DEC | 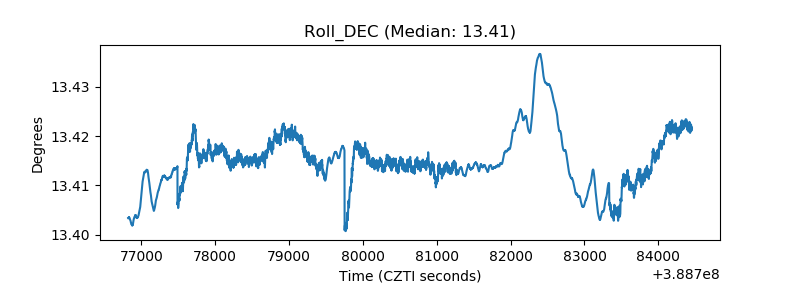 |
| _Roll_RA | 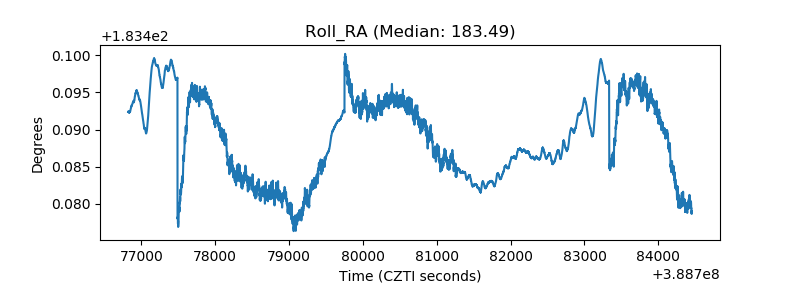 |
| Veto Counter | 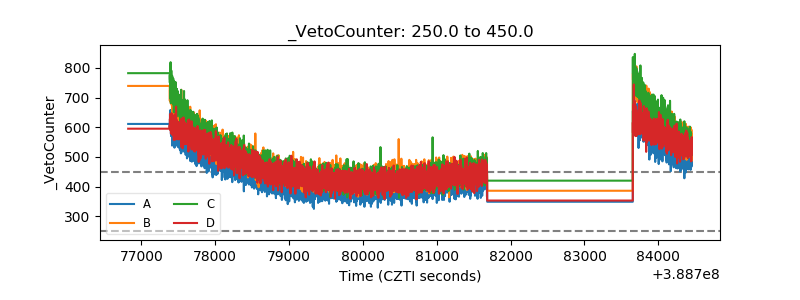 |