| Param | Original file | Final file |
|---|---|---|
| Filename | modeM0/AS1T05_026T01_9000005092_35568cztM0_level2.evt | modeM0/AS1T05_026T01_9000005092_35568cztM0_level2_quad_clean.evt |
| Size (bytes) | 549,558,720 | 65,543,040 |
| Size | 524.1 MB | 62.5 MB |
| Events in quadrant A | 6,959,590 | 338,810 |
| Events in quadrant B | 2,716,426 | 439,985 |
| Events in quadrant C | 3,398,262 | 436,239 |
| Events in quadrant D | 3,227,983 | 416,398 |
| Mode SS | |||
|---|---|---|---|
| Quadrant | BADHDUFLAG | Total packets | Discarded packets |
| A | 0 | 104 | 0 |
| B | 0 | 104 | 0 |
| C | 0 | 104 | 0 |
| D | 0 | 104 | 0 |
| Mode M9 | |||
|---|---|---|---|
| Quadrant | BADHDUFLAG | Total packets | Discarded packets |
| A | 0 | 28 | 0 |
| B | 0 | 28 | 0 |
| C | 0 | 28 | 0 |
| D | 0 | 29 | 0 |
| Mode M0 | |||
|---|---|---|---|
| Quadrant | BADHDUFLAG | Total packets | Discarded packets |
| A | 0 | 23882 | 3 |
| B | 0 | 11466 | 2 |
| C | 0 | 13341 | 2 |
| D | 0 | 12951 | 2 |
| Quadrant | Total seconds | Saturated seconds | Saturation percentage |
|---|---|---|---|
| A | 5024 | 2134 | 42.476115% |
| B | 5024 | 87 | 1.731688% |
| C | 5024 | 145 | 2.886146% |
| D | 5024 | 227 | 4.518312% |
Noise dominated data is calculated using 1-second bins in cleaned event files. If a bin has >2000 counts, and if more than 50% of those come from <1% of pixels, then it is considered to be noise-dominated and hence unusable.
| Quadrant | # 1 sec bins | Bins with >0 counts | Bins with >2000 counts | High rate bins dominated by noise | Noise dominated (total time) | Noise dominated (detector-on time) | Marked lightcurve |
|---|---|---|---|---|---|---|---|
| A | 7086 | 5025 | 2056 | 2056 | 29.01% | 40.92% | 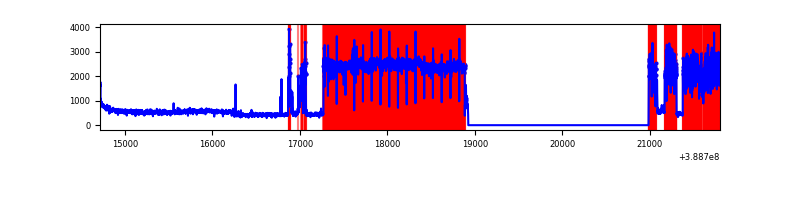 |
| B | 7086 | 5025 | 44 | 44 | 0.62% | 0.88% | 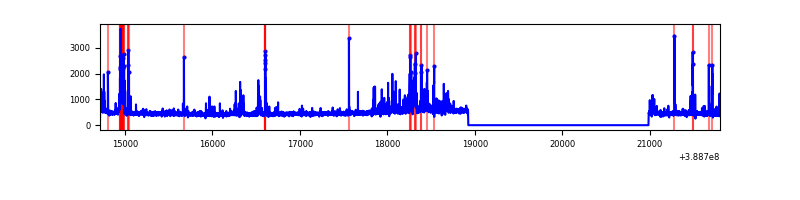 |
| C | 7086 | 5025 | 104 | 104 | 1.47% | 2.07% | 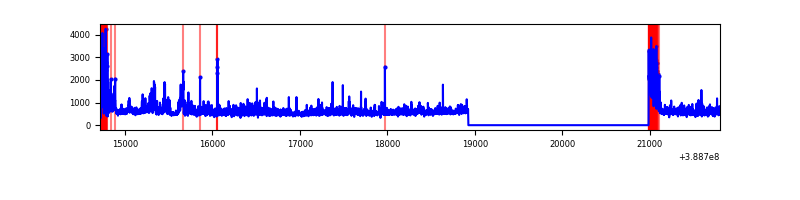 |
| D | 7086 | 5025 | 182 | 182 | 2.57% | 3.62% | 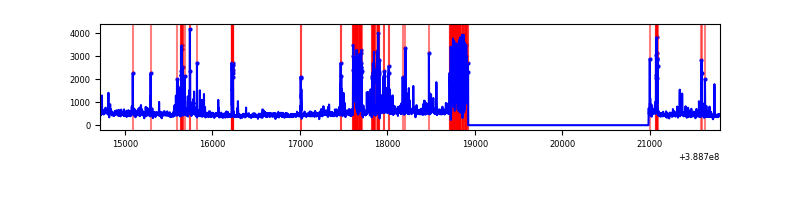 |
Top three noisy pixels from each quadrant. If the there are fewer than three noisy pixels in the level2.evt file, extra rows are filled as -1
| Pixel properties | Quadrant properties | ||||||
|---|---|---|---|---|---|---|---|
| Quadrant | DetID | PixID | Counts | Sigma | Mean | Median | Sigma |
| A | 15 | 169 | 5371784 | 70623.53 | 378 | 372 | 76.1 |
| A | 10 | 83 | 109543 | 1435.38 | 378 | 372 | 76.1 |
| A | 13 | 6 | 7508 | 93.82 | 378 | 372 | 76.1 |
| B | 5 | 172 | 350762 | 3233.63 | 573 | 558 | 108.3 |
| B | 5 | 200 | 41830 | 381.08 | 573 | 558 | 108.3 |
| B | 4 | 81 | 26150 | 236.3 | 573 | 558 | 108.3 |
| C | 9 | 187 | 571935 | 4405.45 | 560 | 563 | 129.7 |
| C | 0 | 10 | 396348 | 3051.62 | 560 | 563 | 129.7 |
| C | 15 | 214 | 224546 | 1726.98 | 560 | 563 | 129.7 |
| D | 1 | 52 | 257001 | 1931.96 | 549 | 534 | 132.7 |
| D | 12 | 233 | 251053 | 1887.16 | 549 | 534 | 132.7 |
| D | 8 | 195 | 184905 | 1388.87 | 549 | 534 | 132.7 |
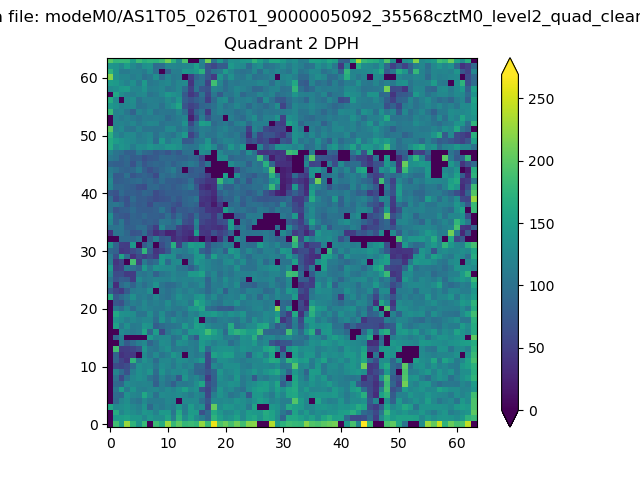
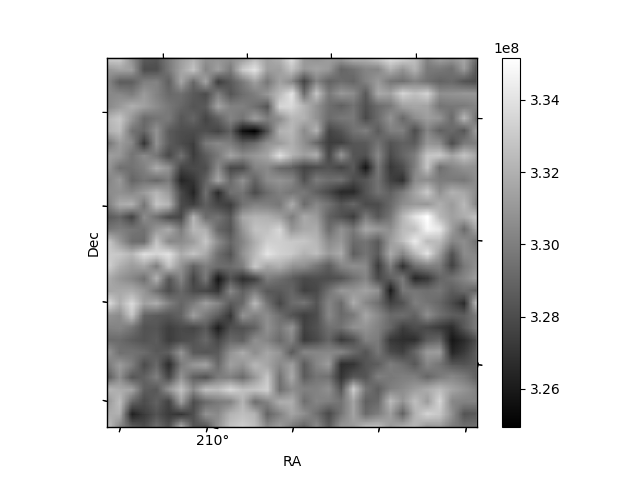
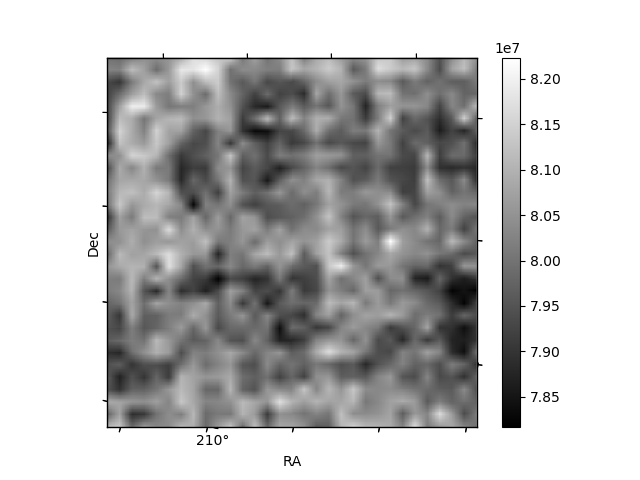
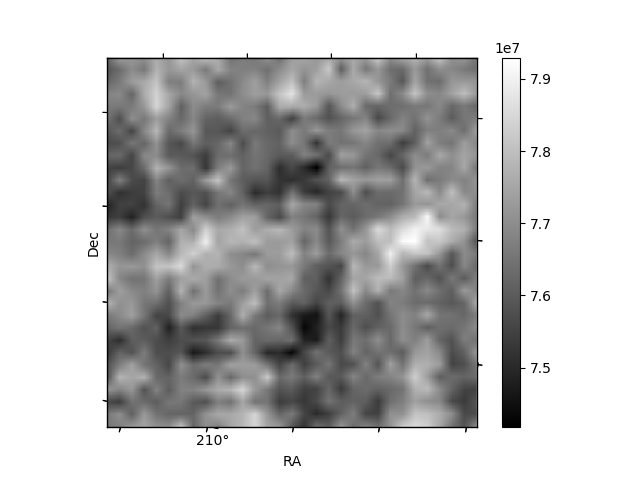
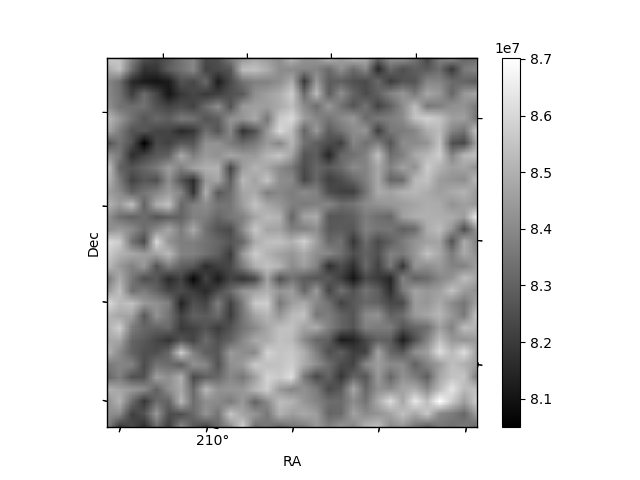
Histogram calculated using DETX and DETY for each event in the final _common_clean file
| Quadrant A | 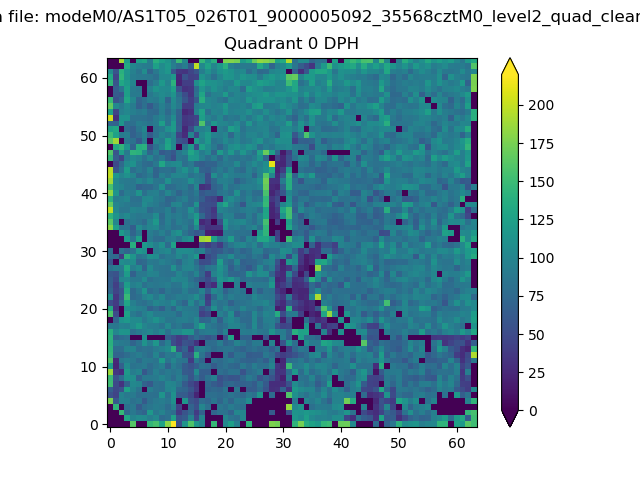 |
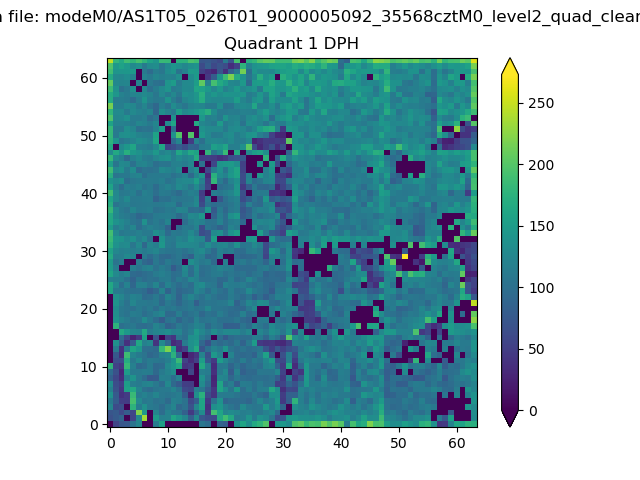 |
Quadrant B |
|---|---|---|---|
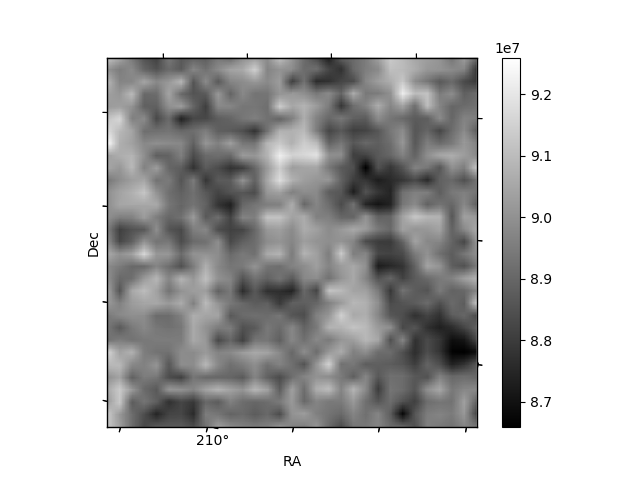
| Quadrant D | 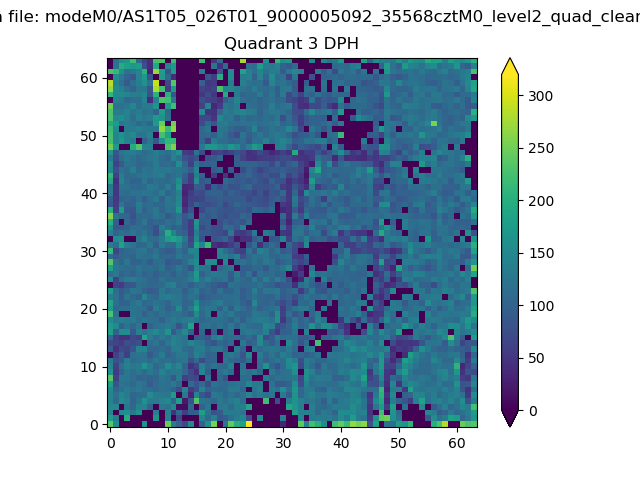 |
 |
Quadrant C |
| Plot type | Count rate plots | Images |
|---|---|---|
| Comparison with Poisson distribution Blue bars denote a histogram of data divided into 1 sec bins. Red curve is a Poisson curve with rate = median count rate of data. |
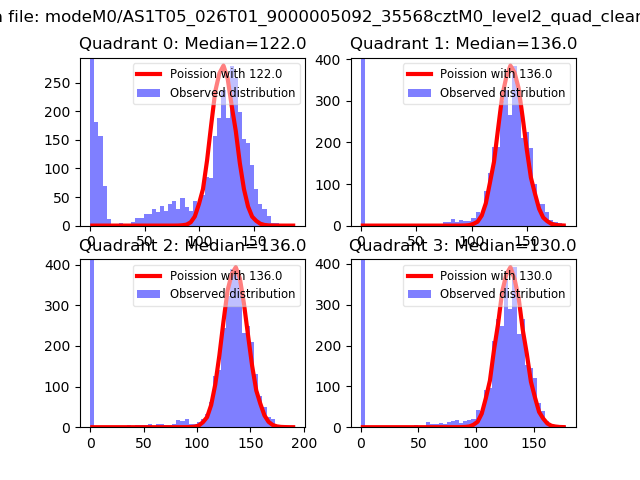 |
 |
| Quadrant-wise count rates Data is divided into 100 sec bins |
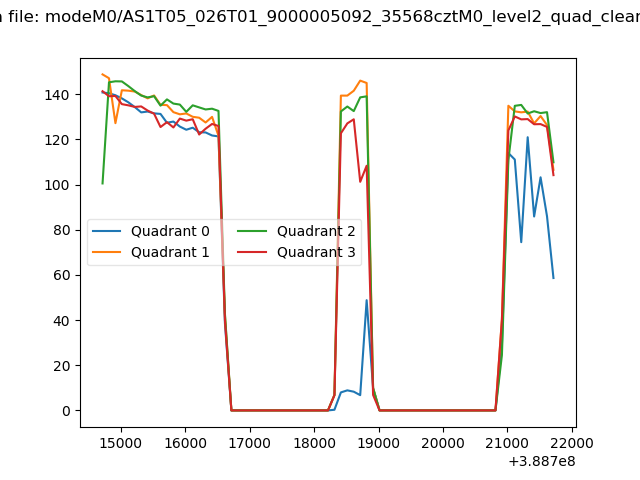 |
|
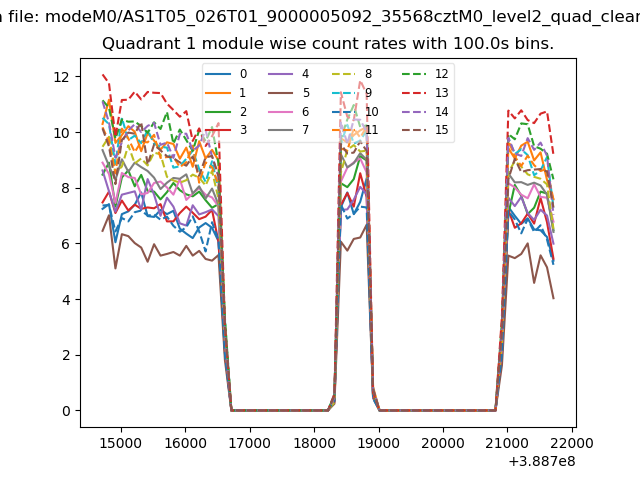
| Module-wise count rates for Quadrant A Data is divided into 100 sec bins |
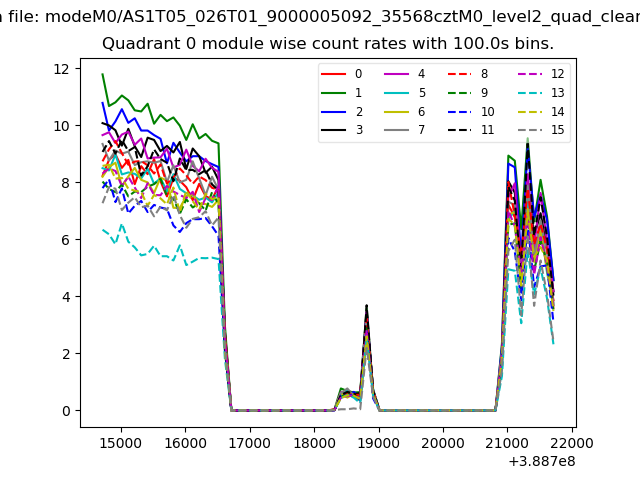 |
 |
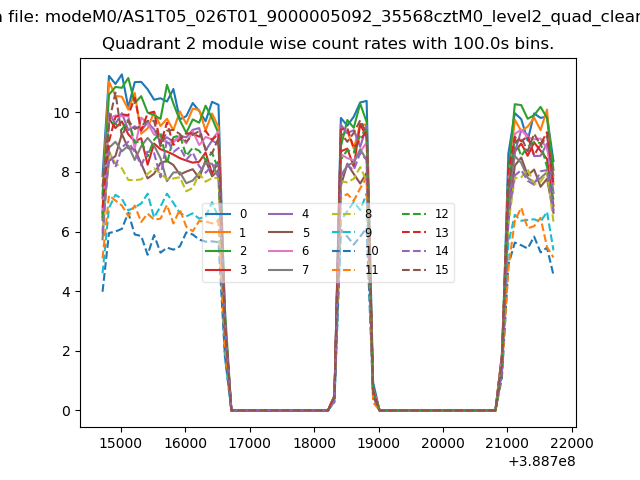
| Module-wise count rates for Quadrant B Data is divided into 100 sec bins |
 |
 |
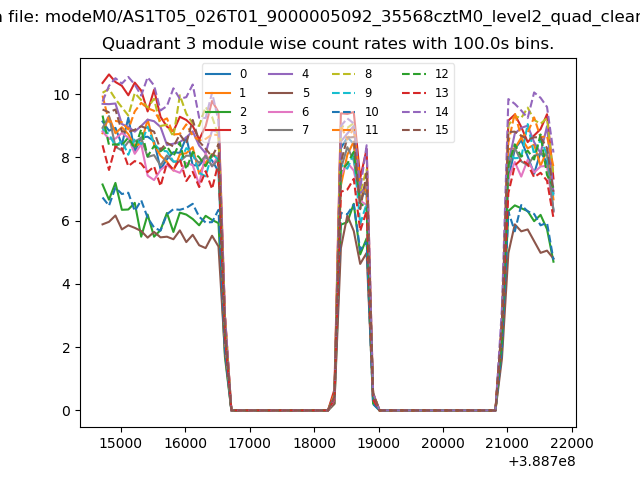
| Module-wise count rates for Quadrant C Data is divided into 100 sec bins |
 |
 |
| Module-wise count rates for Quadrant D Data is divided into 100 sec bins |
 |
 |
| Parameter | Plot |
|---|---|
| CZT HV Monitor | 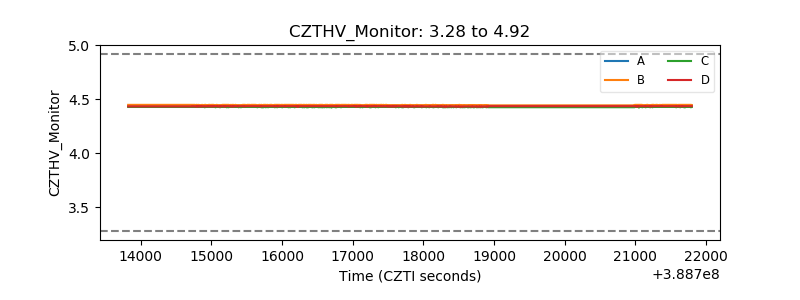 |
| D_VDD | 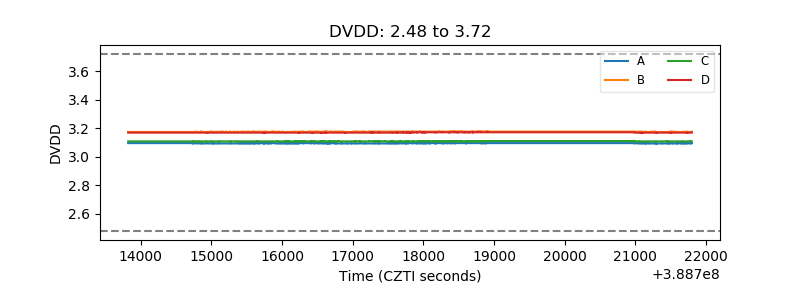 |
| Temperature 1 | 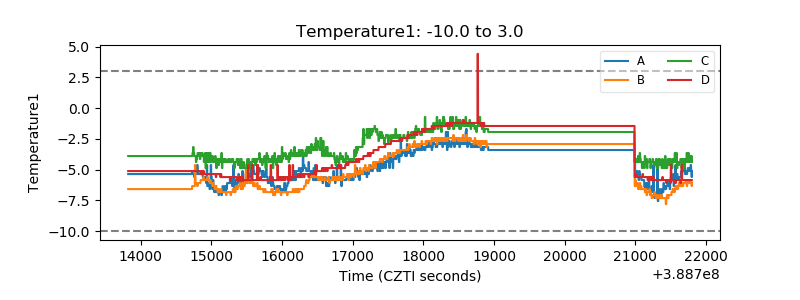 |
| Veto HV Monitor | 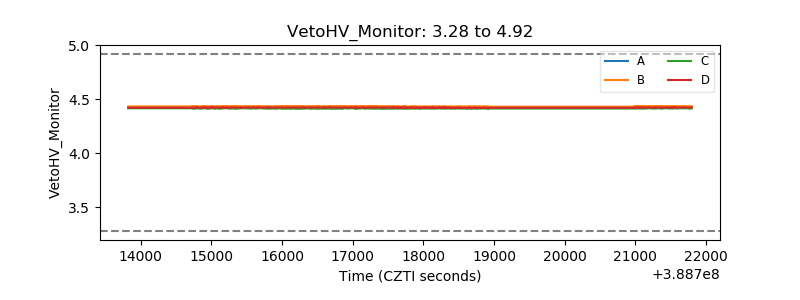 |
| Veto LLD | 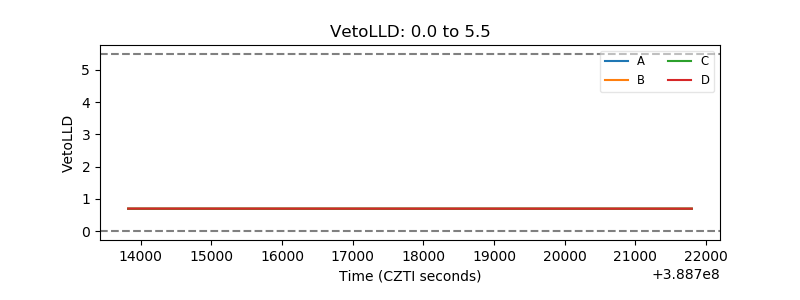 |
| Alpha Counter | 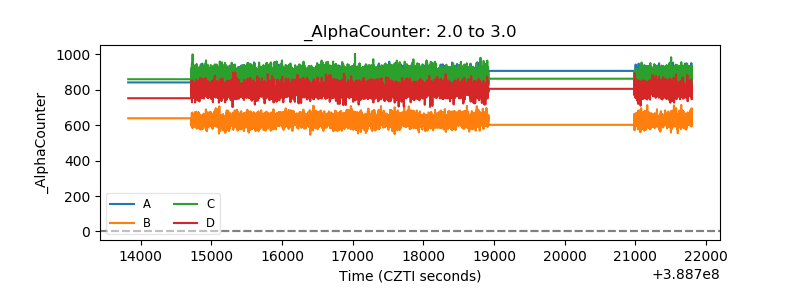 |
| _CPM_Rate | 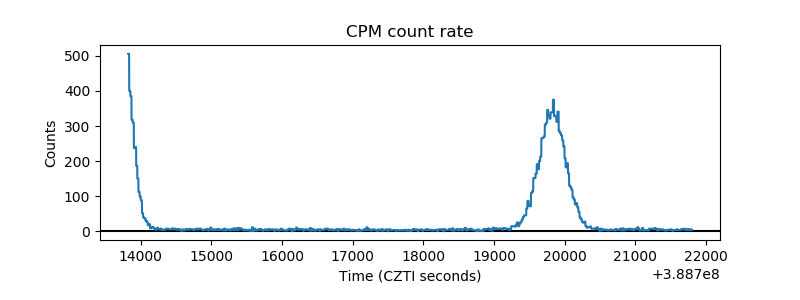 |
| CZT Counter | 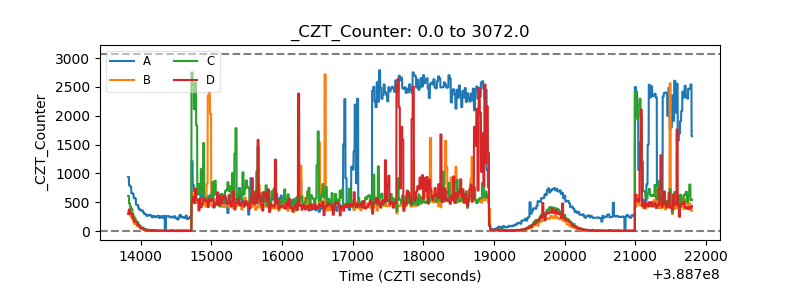 |
| +2.5 Volts monitor | 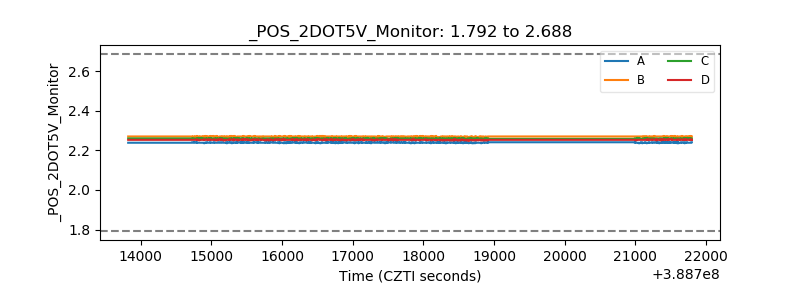 |
| +5 Volts monitor | 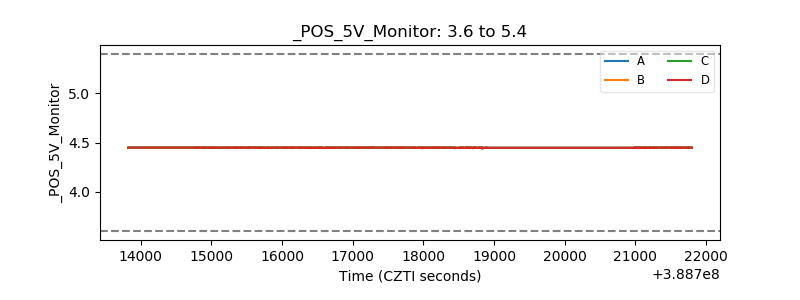 |
| _ROLL_ROT | 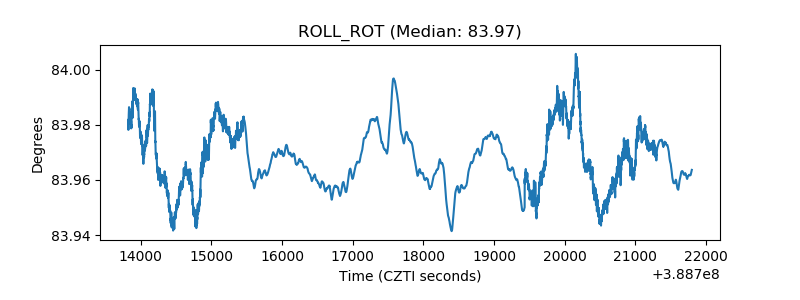 |
| _Roll_DEC | 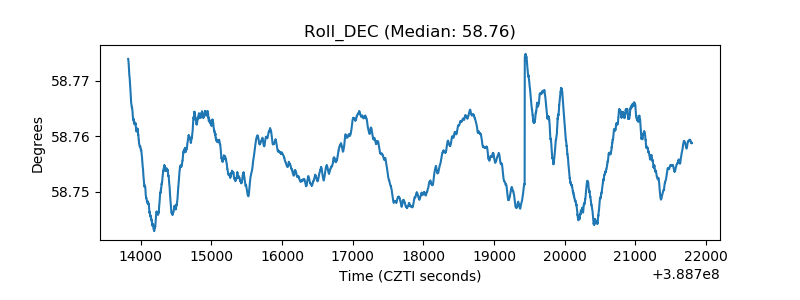 |
| _Roll_RA | 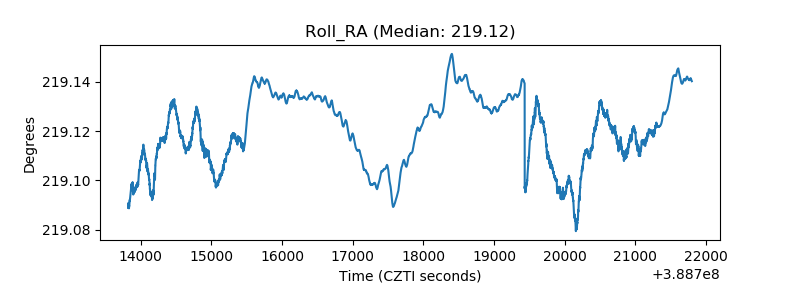 |
| Veto Counter | 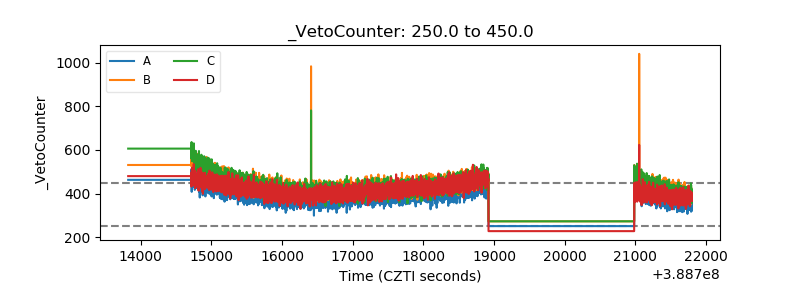 |