| Param | Original file | Final file |
|---|---|---|
| Filename | modeM0/AS1A11_093T01_9000005090_35559cztM0_level2.evt | modeM0/AS1A11_093T01_9000005090_35559cztM0_level2_quad_clean.evt |
| Size (bytes) | 348,105,600 | 54,601,920 |
| Size | 332.0 MB | 52.1 MB |
| Events in quadrant A | 2,617,722 | 327,909 |
| Events in quadrant B | 2,606,822 | 338,878 |
| Events in quadrant C | 2,544,414 | 342,260 |
| Events in quadrant D | 2,465,346 | 325,854 |
| Mode SS | |||
|---|---|---|---|
| Quadrant | BADHDUFLAG | Total packets | Discarded packets |
| A | 0 | 90 | 0 |
| B | 0 | 90 | 0 |
| C | 0 | 90 | 0 |
| D | 0 | 90 | 0 |
| Mode M0 | |||
|---|---|---|---|
| Quadrant | BADHDUFLAG | Total packets | Discarded packets |
| A | 0 | 10700 | 1 |
| B | 0 | 10594 | 1 |
| C | 0 | 10124 | 1 |
| D | 0 | 10176 | 1 |
| Mode M9 | |||
|---|---|---|---|
| Quadrant | BADHDUFLAG | Total packets | Discarded packets |
| A | 0 | 6 | 0 |
| B | 0 | 6 | 0 |
| C | 0 | 6 | 0 |
| D | 0 | 7 | 0 |
| Quadrant | Total seconds | Saturated seconds | Saturation percentage |
|---|---|---|---|
| A | 4527 | 5 | 0.110448% |
| B | 4527 | 105 | 2.319417% |
| C | 4527 | 31 | 0.684780% |
| D | 4527 | 46 | 1.016125% |
Noise dominated data is calculated using 1-second bins in cleaned event files. If a bin has >2000 counts, and if more than 50% of those come from <1% of pixels, then it is considered to be noise-dominated and hence unusable.
| Quadrant | # 1 sec bins | Bins with >0 counts | Bins with >2000 counts | High rate bins dominated by noise | Noise dominated (total time) | Noise dominated (detector-on time) | Marked lightcurve |
|---|---|---|---|---|---|---|---|
| A | 4527 | 4527 | 0 | 0 | 0.00% | 0.00% |  |
| B | 4527 | 4527 | 60 | 60 | 1.33% | 1.33% | 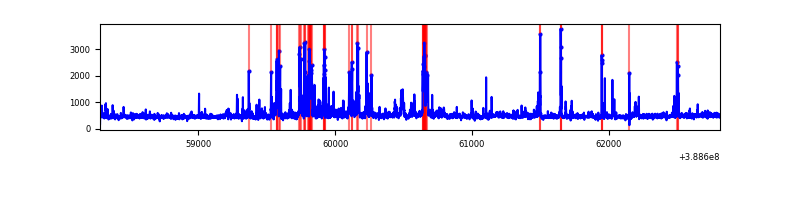 |
| C | 4527 | 4527 | 28 | 28 | 0.62% | 0.62% | 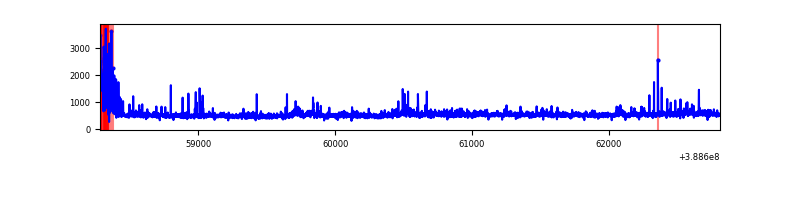 |
| D | 4527 | 4527 | 31 | 31 | 0.68% | 0.68% | 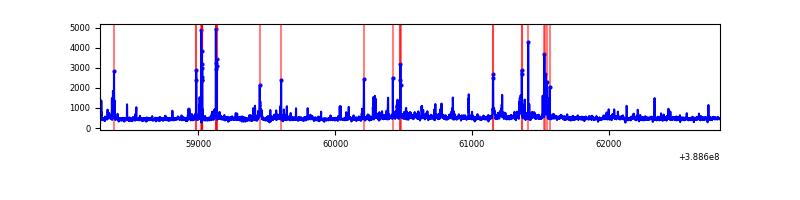 |
Top three noisy pixels from each quadrant. If the there are fewer than three noisy pixels in the level2.evt file, extra rows are filled as -1
| Pixel properties | Quadrant properties | ||||||
|---|---|---|---|---|---|---|---|
| Quadrant | DetID | PixID | Counts | Sigma | Mean | Median | Sigma |
| A | 15 | 169 | 522383 | 4986.27 | 514 | 503 | 104.7 |
| A | 10 | 83 | 90361 | 858.54 | 514 | 503 | 104.7 |
| A | 13 | 6 | 12265 | 112.38 | 514 | 503 | 104.7 |
| B | 5 | 172 | 476243 | 4794.6 | 512 | 498 | 99.2 |
| B | 0 | 189 | 43574 | 434.12 | 512 | 498 | 99.2 |
| B | 0 | 190 | 37296 | 370.85 | 512 | 498 | 99.2 |
| C | 0 | 10 | 275400 | 2313.9 | 509 | 513 | 118.8 |
| C | 15 | 214 | 200081 | 1679.89 | 509 | 513 | 118.8 |
| C | 0 | 239 | 60056 | 501.21 | 509 | 513 | 118.8 |
| D | 8 | 195 | 145138 | 1176.35 | 506 | 493 | 123.0 |
| D | 13 | 249 | 91152 | 737.3 | 506 | 493 | 123.0 |
| D | 2 | 250 | 55981 | 451.26 | 506 | 493 | 123.0 |
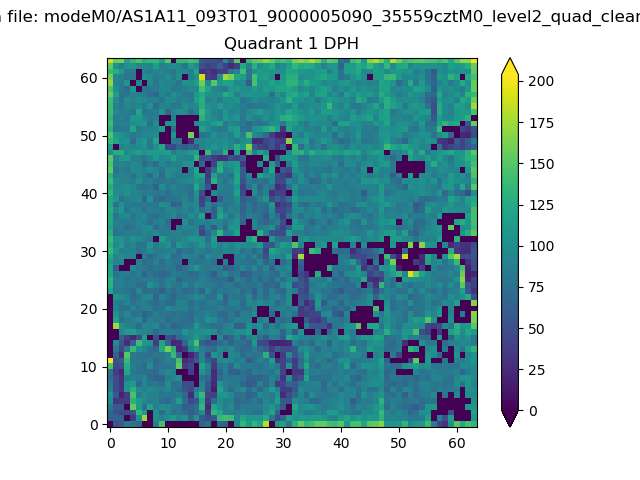
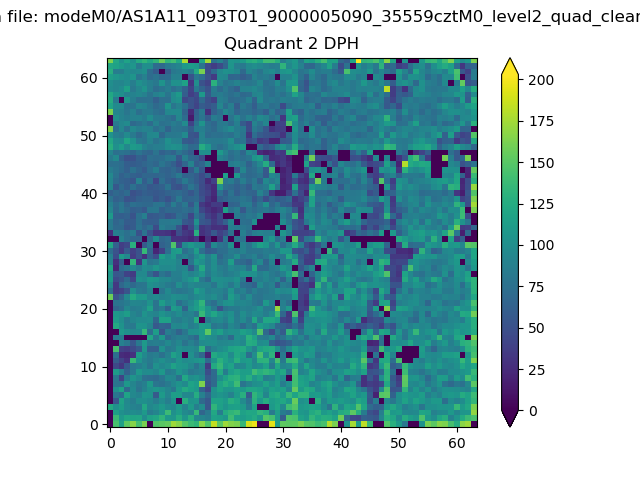
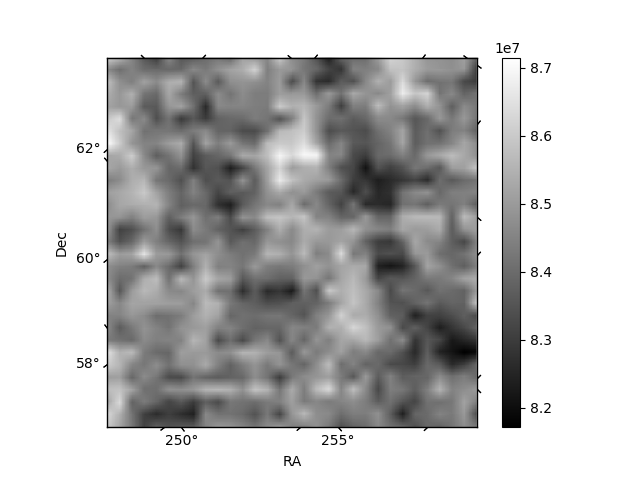
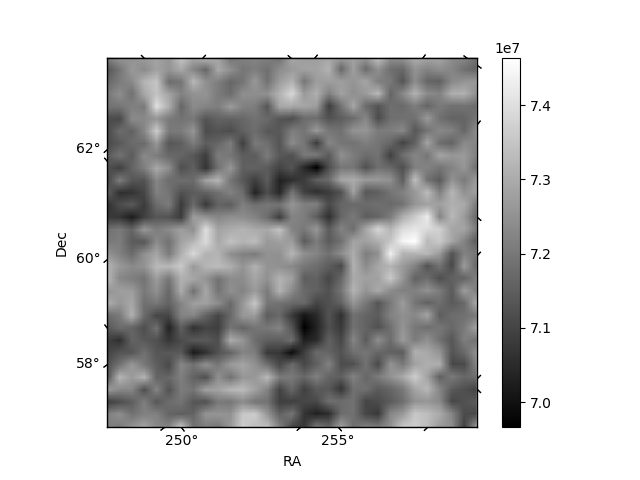
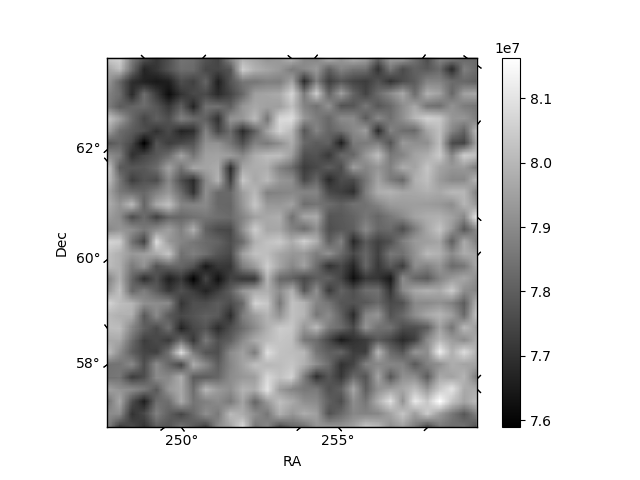
Histogram calculated using DETX and DETY for each event in the final _common_clean file
| Quadrant A | 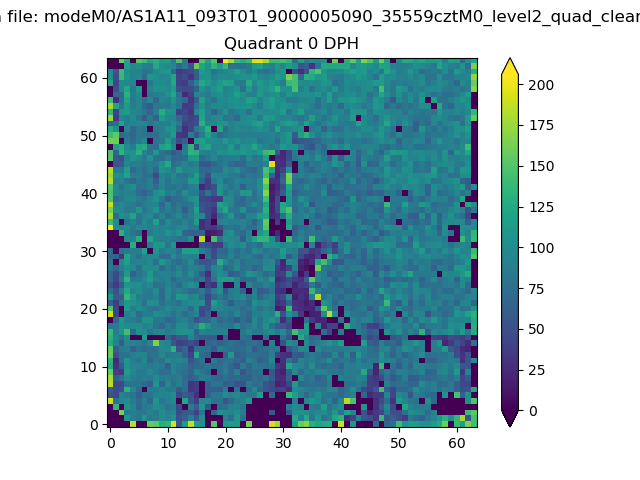 |
 |
Quadrant B |
|---|---|---|---|
| Quadrant D | 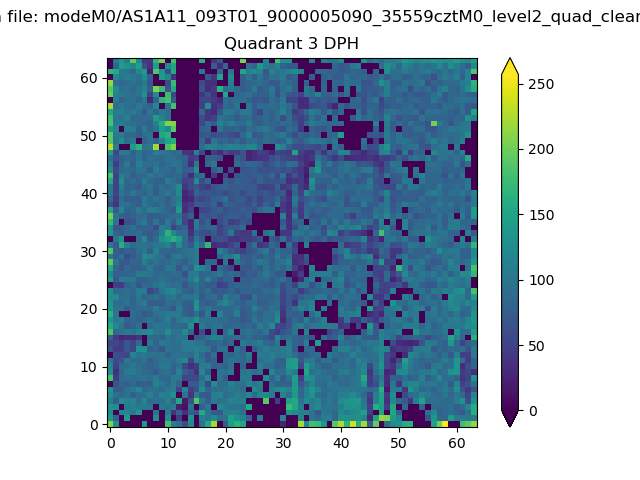 |
 |
Quadrant C |
| Plot type | Count rate plots | Images |
|---|---|---|
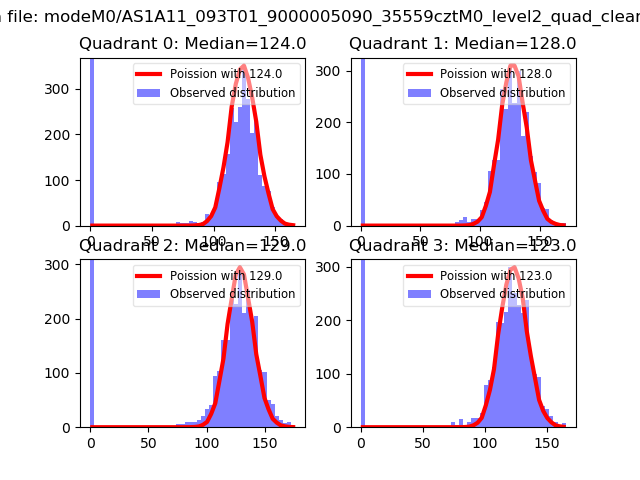
| Comparison with Poisson distribution Blue bars denote a histogram of data divided into 1 sec bins. Red curve is a Poisson curve with rate = median count rate of data. |
 |
 |
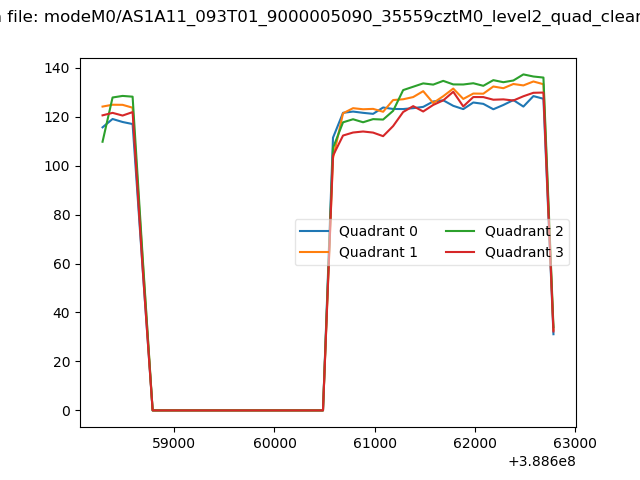
| Quadrant-wise count rates Data is divided into 100 sec bins |
 |
|
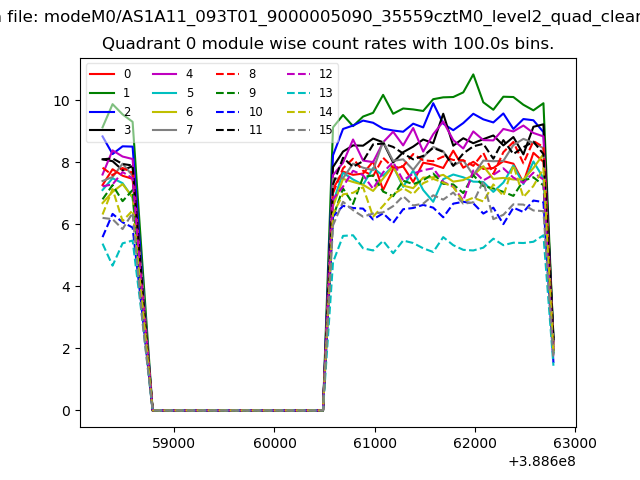
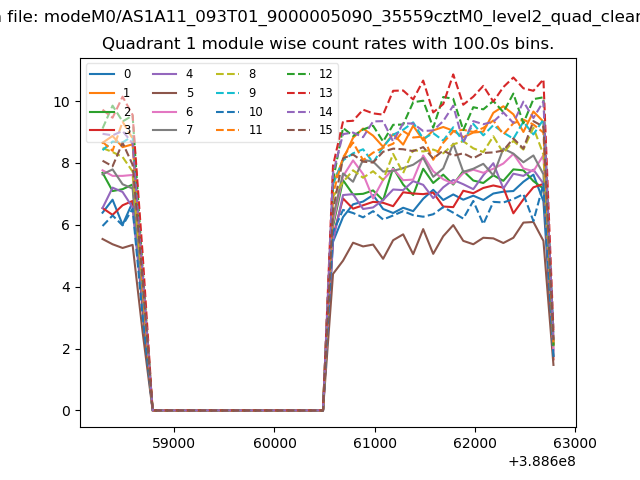
| Module-wise count rates for Quadrant A Data is divided into 100 sec bins |
 |
 |
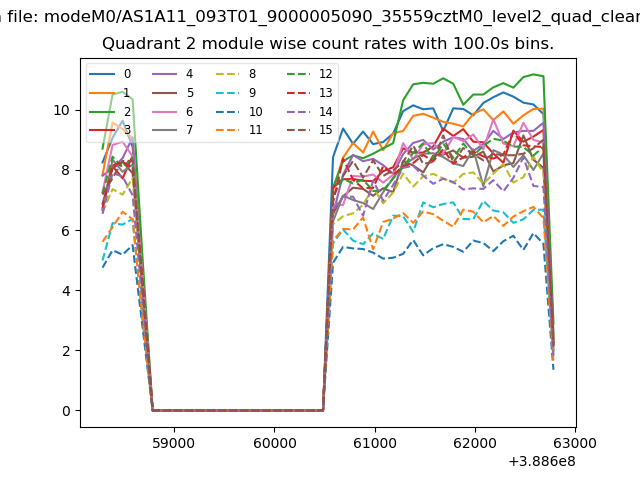
| Module-wise count rates for Quadrant B Data is divided into 100 sec bins |
 |
 |
| Module-wise count rates for Quadrant C Data is divided into 100 sec bins |
 |
 |
| Module-wise count rates for Quadrant D Data is divided into 100 sec bins |
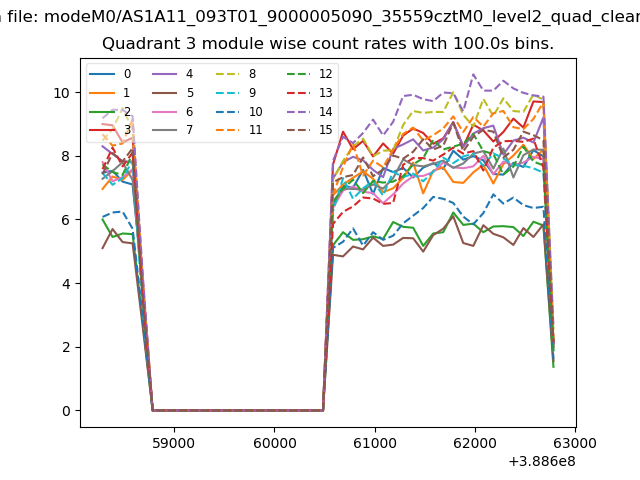 |
 |
| Parameter | Plot |
|---|---|
| CZT HV Monitor | 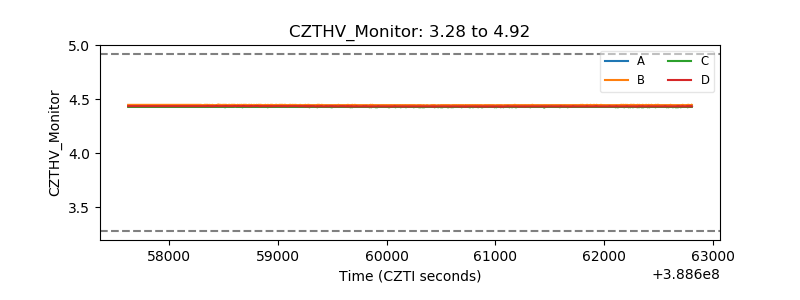 |
| D_VDD | 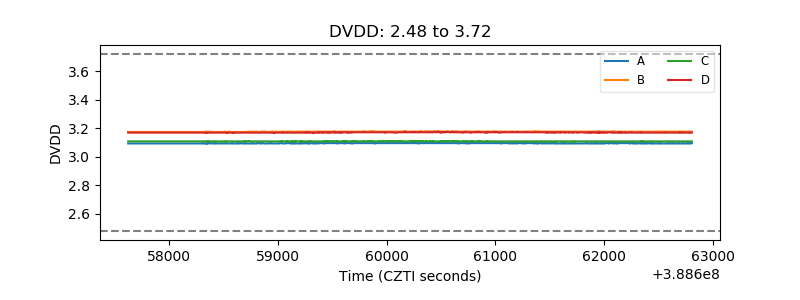 |
| Temperature 1 | 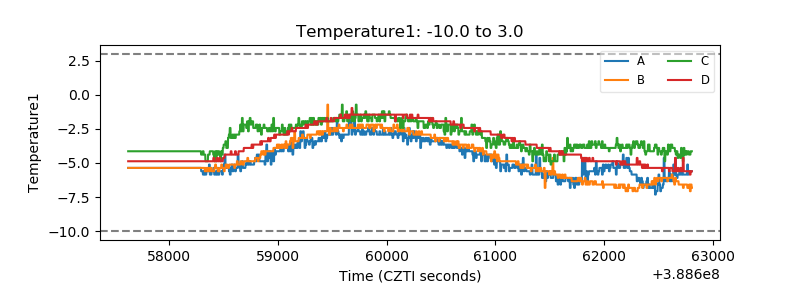 |
| Veto HV Monitor | 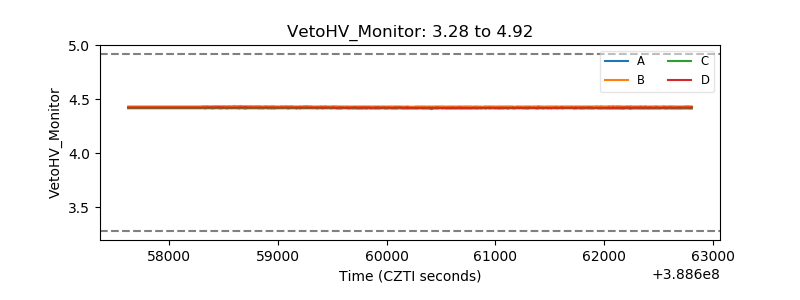 |
| Veto LLD | 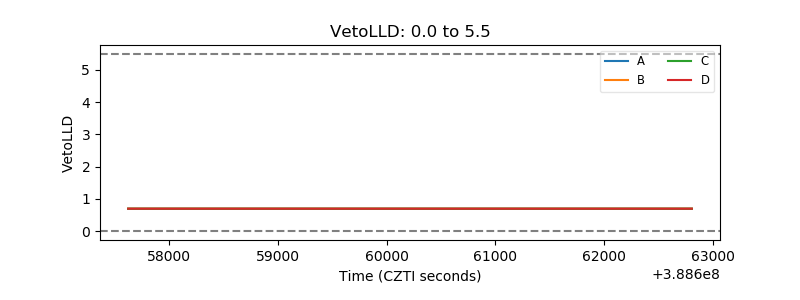 |
| Alpha Counter | 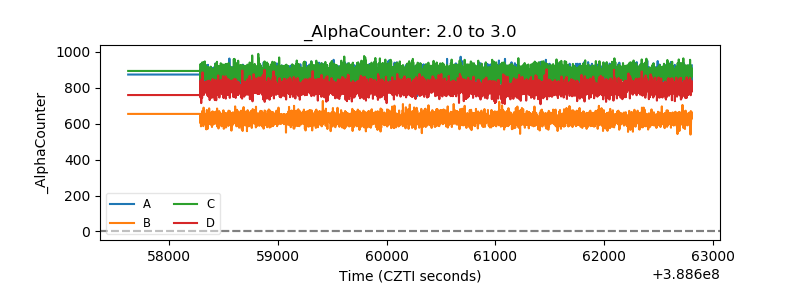 |
| _CPM_Rate | 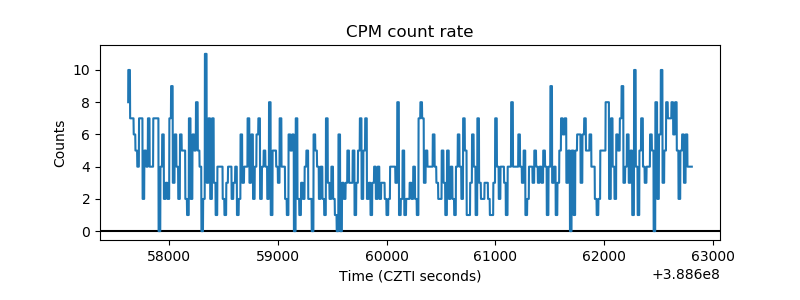 |
| CZT Counter | 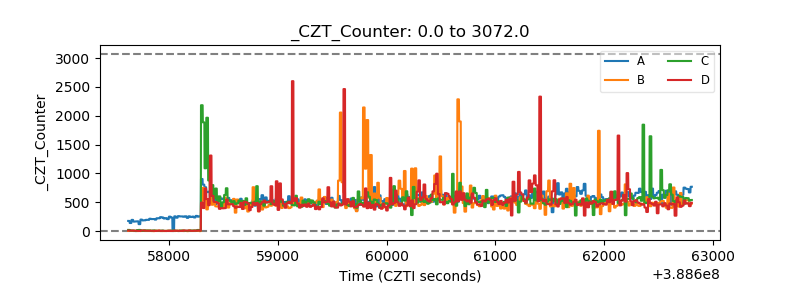 |
| +2.5 Volts monitor | 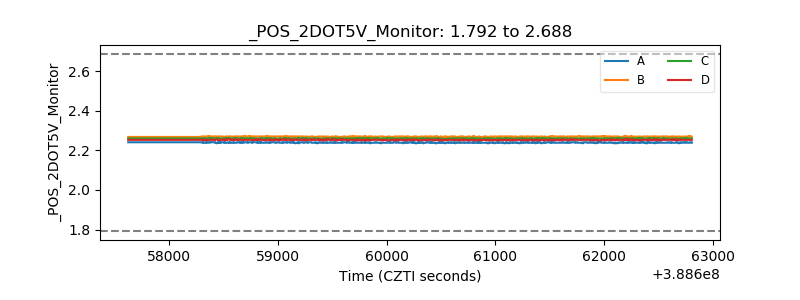 |
| +5 Volts monitor | 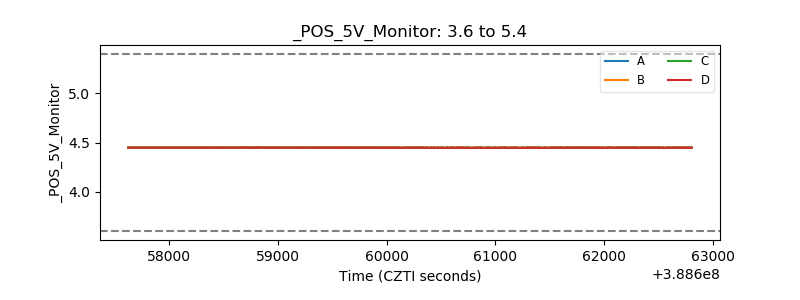 |
| _ROLL_ROT | 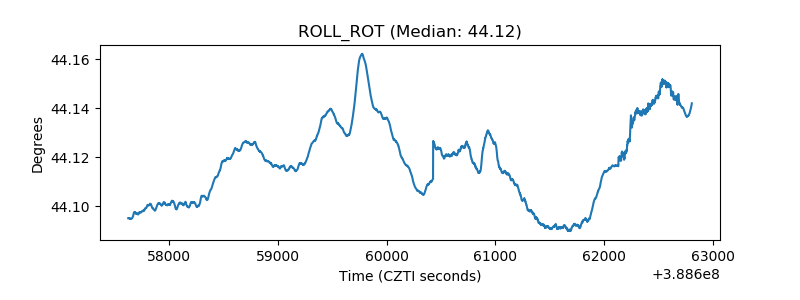 |
| _Roll_DEC | 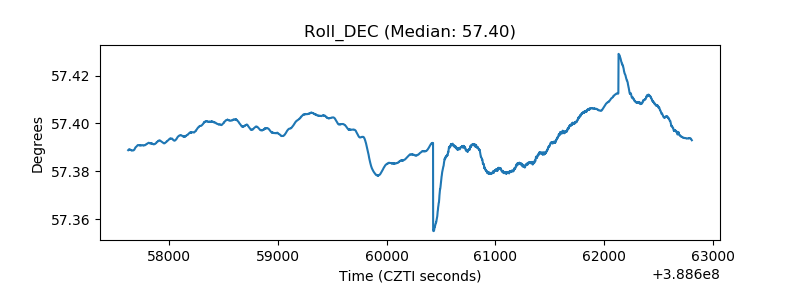 |
| _Roll_RA | 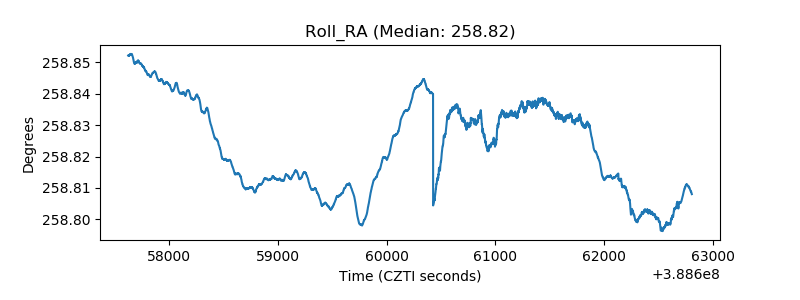 |
| Veto Counter | 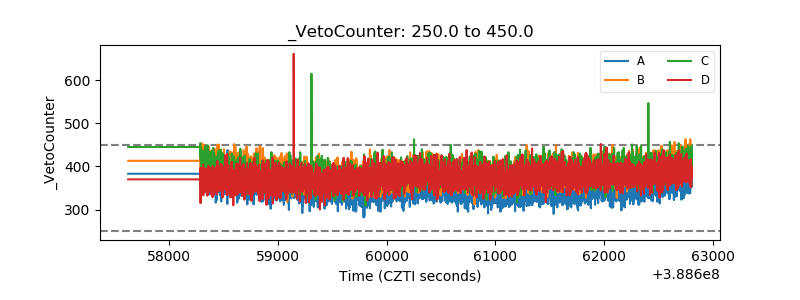 |