| Param | Original file | Final file |
|---|---|---|
| Filename | modeM0/AS1A11_093T01_9000005090_35554cztM0_level2.evt | modeM0/AS1A11_093T01_9000005090_35554cztM0_level2_quad_clean.evt |
| Size (bytes) | 618,744,960 | 65,790,720 |
| Size | 590.1 MB | 62.7 MB |
| Events in quadrant A | 9,118,617 | 252,996 |
| Events in quadrant B | 3,157,060 | 458,625 |
| Events in quadrant C | 3,131,872 | 463,629 |
| Events in quadrant D | 2,963,850 | 437,333 |
| Mode SS | |||
|---|---|---|---|
| Quadrant | BADHDUFLAG | Total packets | Discarded packets |
| A | 0 | 110 | 0 |
| B | 0 | 110 | 0 |
| C | 0 | 110 | 0 |
| D | 0 | 110 | 0 |
| Mode M0 | |||
|---|---|---|---|
| Quadrant | BADHDUFLAG | Total packets | Discarded packets |
| A | 0 | 30888 | 3 |
| B | 0 | 13004 | 2 |
| C | 0 | 12557 | 2 |
| D | 0 | 12706 | 2 |
| Mode M9 | |||
|---|---|---|---|
| Quadrant | BADHDUFLAG | Total packets | Discarded packets |
| A | 0 | 30 | 0 |
| B | 0 | 30 | 0 |
| C | 0 | 30 | 0 |
| D | 0 | 31 | 0 |
| Quadrant | Total seconds | Saturated seconds | Saturation percentage |
|---|---|---|---|
| A | 5402 | 3924 | 72.639763% |
| B | 5402 | 164 | 3.035913% |
| C | 5402 | 168 | 3.109959% |
| D | 5402 | 179 | 3.313588% |
Noise dominated data is calculated using 1-second bins in cleaned event files. If a bin has >2000 counts, and if more than 50% of those come from <1% of pixels, then it is considered to be noise-dominated and hence unusable.
| Quadrant | # 1 sec bins | Bins with >0 counts | Bins with >2000 counts | High rate bins dominated by noise | Noise dominated (total time) | Noise dominated (detector-on time) | Marked lightcurve |
|---|---|---|---|---|---|---|---|
| A | 7344 | 5402 | 946 | 946 | 12.88% | 17.51% | 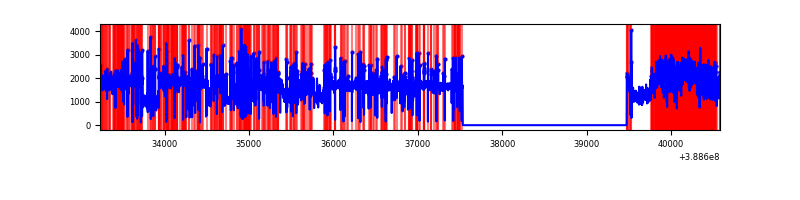 |
| B | 7344 | 5403 | 100 | 100 | 1.36% | 1.85% | 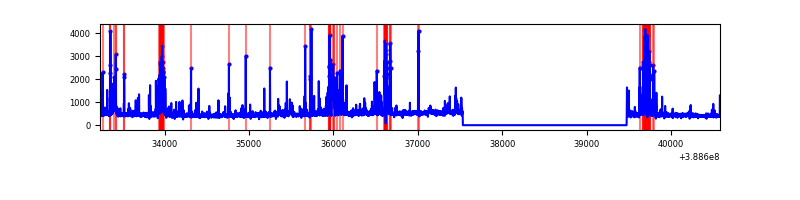 |
| C | 7344 | 5403 | 130 | 130 | 1.77% | 2.41% | 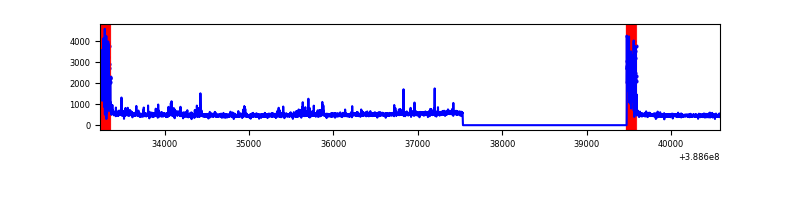 |
| D | 7344 | 5403 | 105 | 105 | 1.43% | 1.94% | 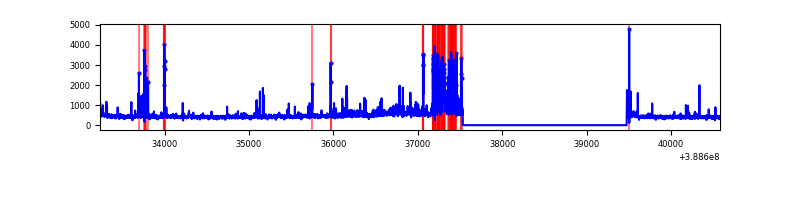 |
Top three noisy pixels from each quadrant. If the there are fewer than three noisy pixels in the level2.evt file, extra rows are filled as -1
| Pixel properties | Quadrant properties | ||||||
|---|---|---|---|---|---|---|---|
| Quadrant | DetID | PixID | Counts | Sigma | Mean | Median | Sigma |
| A | 15 | 169 | 7689488 | 109172.59 | 343 | 336 | 70.4 |
| A | 10 | 83 | 87917 | 1243.5 | 343 | 336 | 70.4 |
| A | 13 | 6 | 8569 | 116.89 | 343 | 336 | 70.4 |
| B | 5 | 172 | 685484 | 5956.89 | 605 | 590 | 115.0 |
| B | 0 | 189 | 24542 | 208.32 | 605 | 590 | 115.0 |
| B | 5 | 31 | 16518 | 138.53 | 605 | 590 | 115.0 |
| C | 0 | 10 | 536282 | 3924.21 | 592 | 598 | 136.5 |
| C | 15 | 214 | 241151 | 1762.19 | 592 | 598 | 136.5 |
| C | 14 | 67 | 17755 | 125.69 | 592 | 598 | 136.5 |
| D | 10 | 118 | 345122 | 2441.59 | 582 | 566 | 141.1 |
| D | 8 | 195 | 119013 | 839.34 | 582 | 566 | 141.1 |
| D | 13 | 249 | 96248 | 678.02 | 582 | 566 | 141.1 |
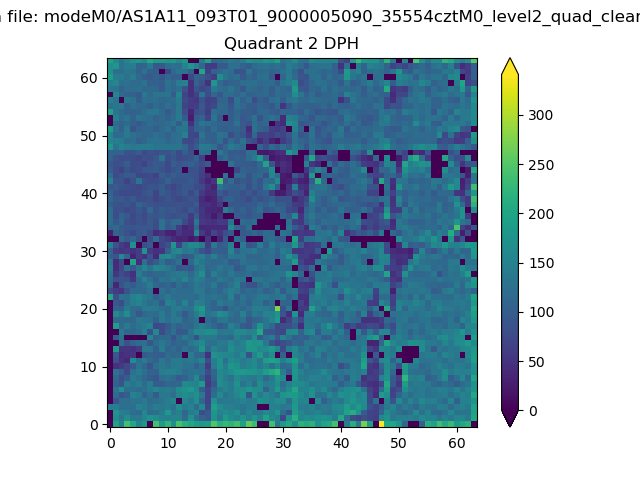
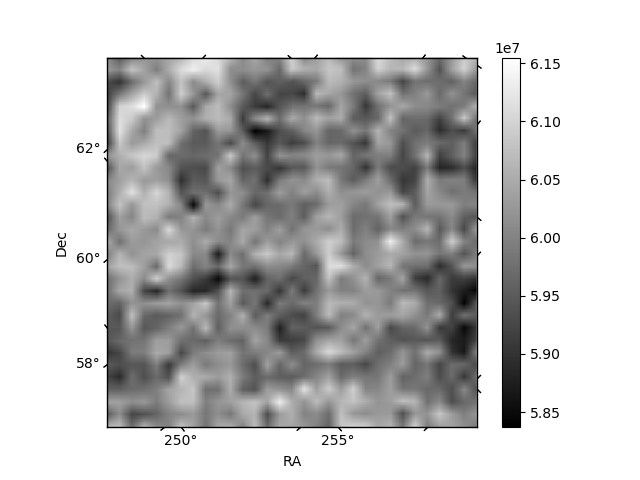
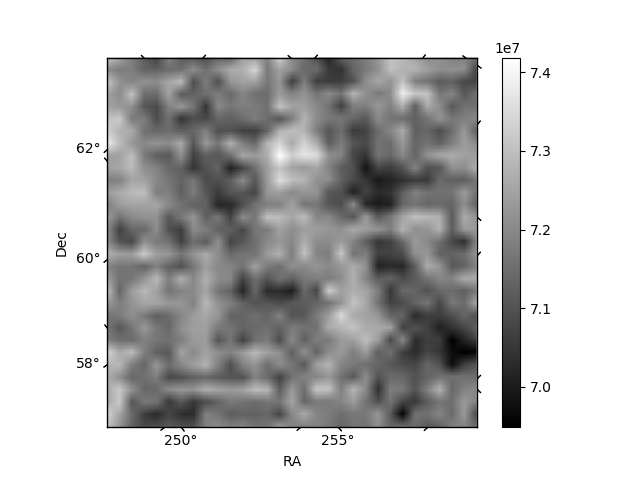
Histogram calculated using DETX and DETY for each event in the final _common_clean file
| Quadrant A | 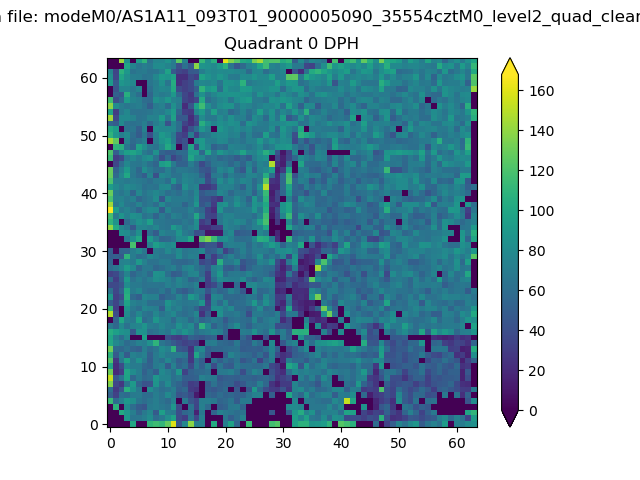 |
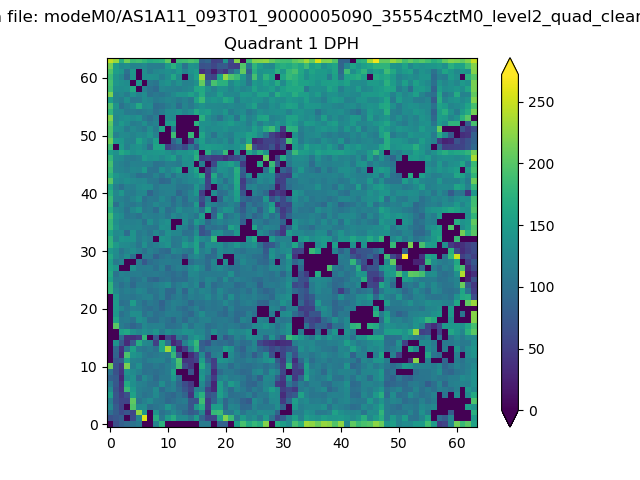 |
Quadrant B |
|---|---|---|---|
| Quadrant D | 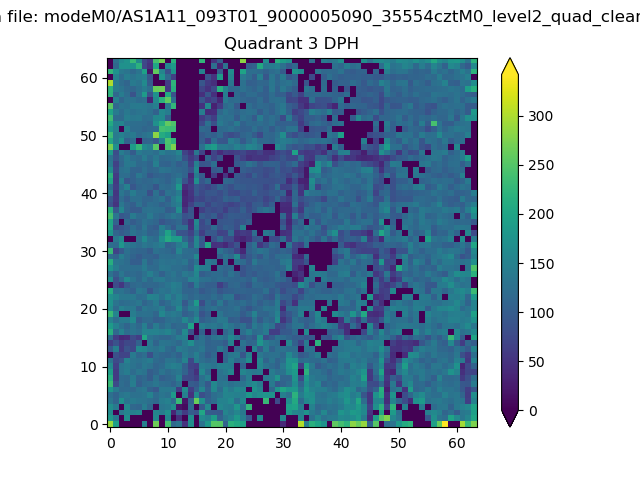 |
 |
Quadrant C |
| Plot type | Count rate plots | Images |
|---|---|---|
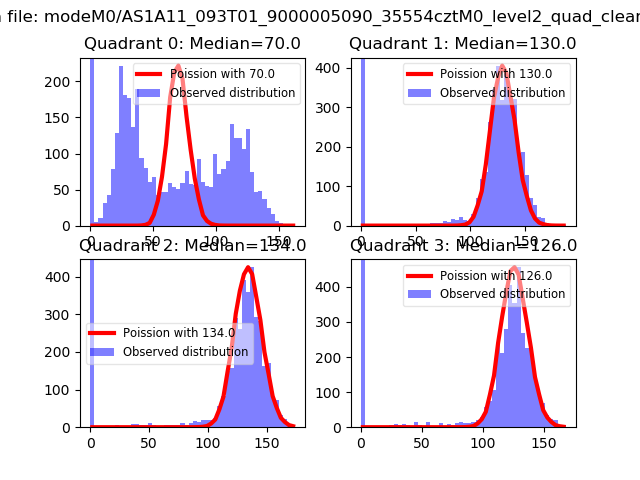
| Comparison with Poisson distribution Blue bars denote a histogram of data divided into 1 sec bins. Red curve is a Poisson curve with rate = median count rate of data. |
 |
 |
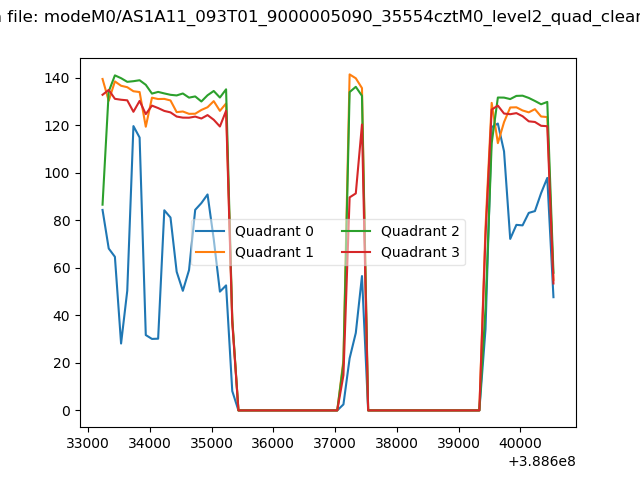
| Quadrant-wise count rates Data is divided into 100 sec bins |
 |
|
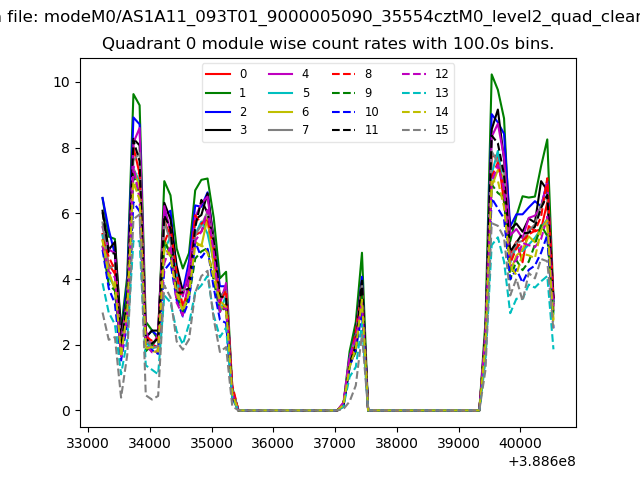
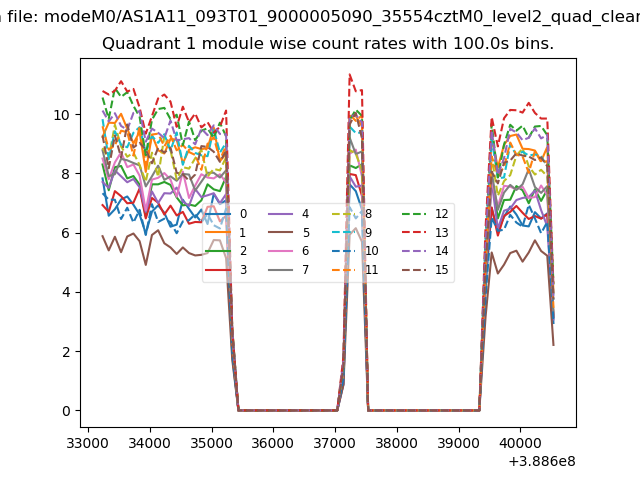
| Module-wise count rates for Quadrant A Data is divided into 100 sec bins |
 |
 |
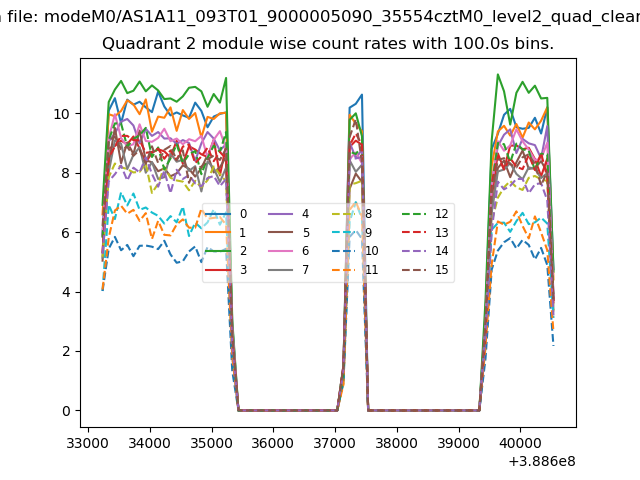
| Module-wise count rates for Quadrant B Data is divided into 100 sec bins |
 |
 |
| Module-wise count rates for Quadrant C Data is divided into 100 sec bins |
 |
 |
| Module-wise count rates for Quadrant D Data is divided into 100 sec bins |
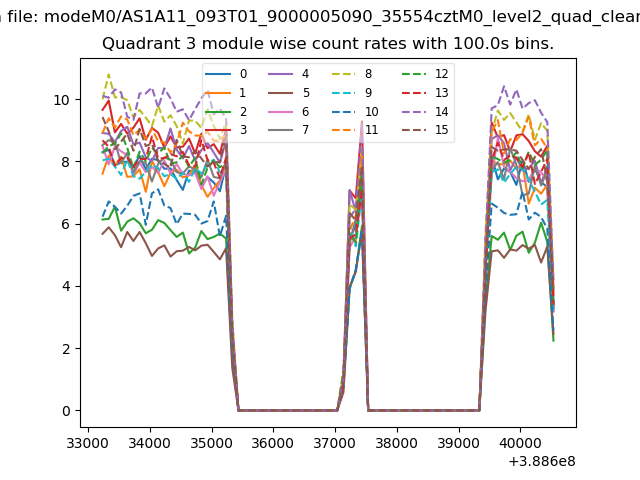 |
 |
| Parameter | Plot |
|---|---|
| CZT HV Monitor | 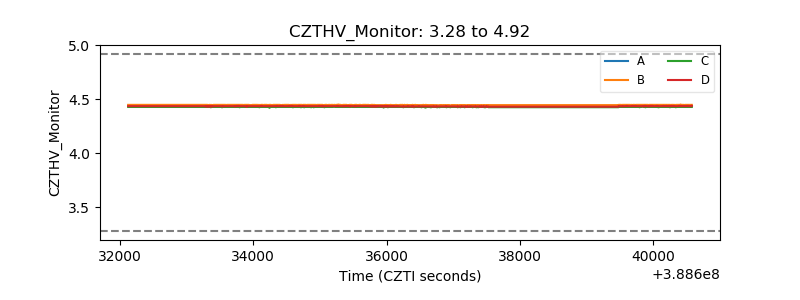 |
| D_VDD | 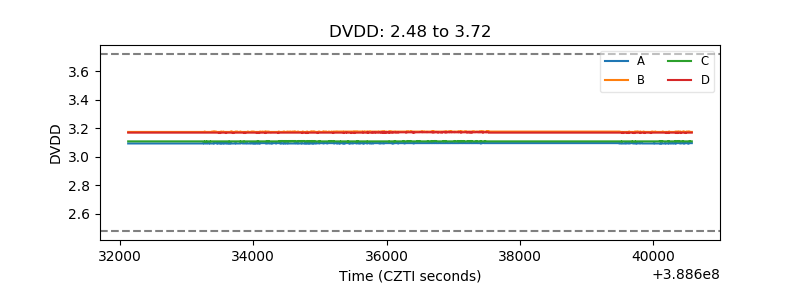 |
| Temperature 1 | 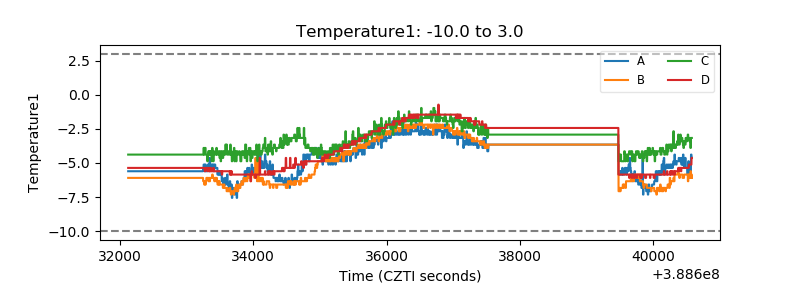 |
| Veto HV Monitor | 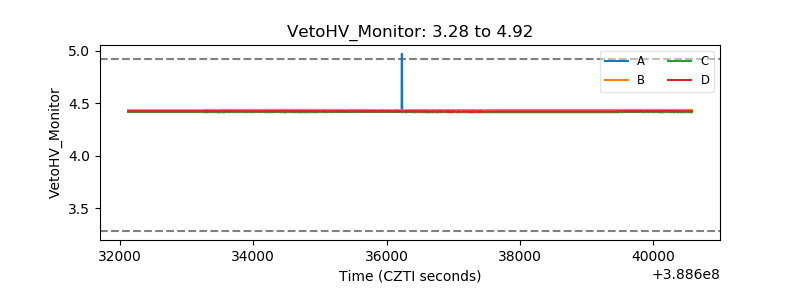 |
| Veto LLD | 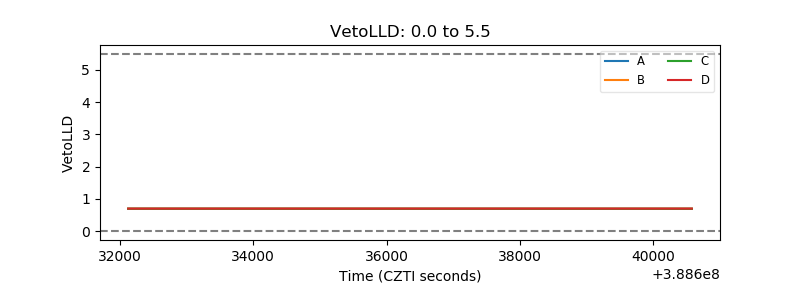 |
| Alpha Counter | 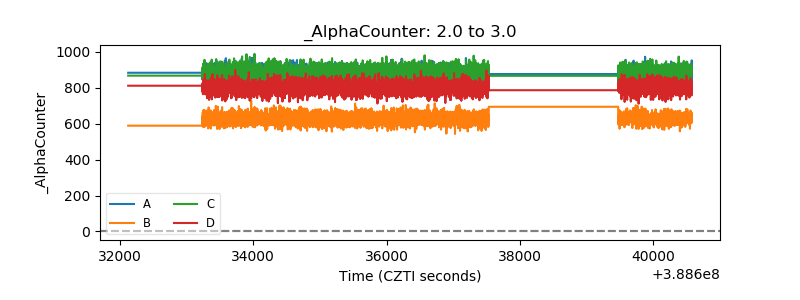 |
| _CPM_Rate | 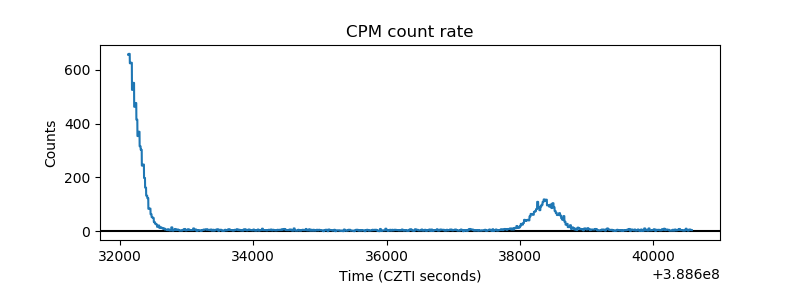 |
| CZT Counter | 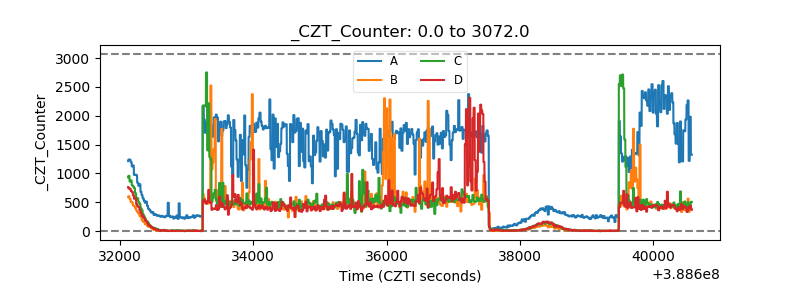 |
| +2.5 Volts monitor | 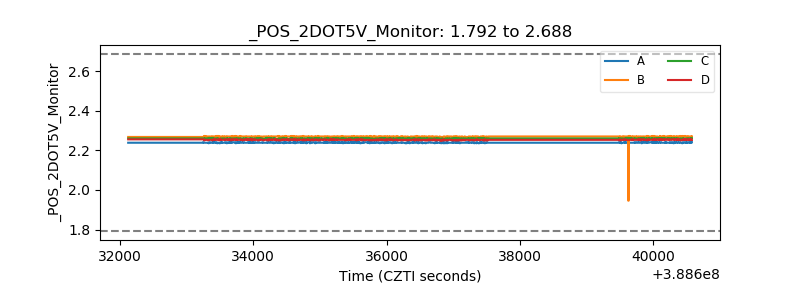 |
| +5 Volts monitor |  |
| _ROLL_ROT | 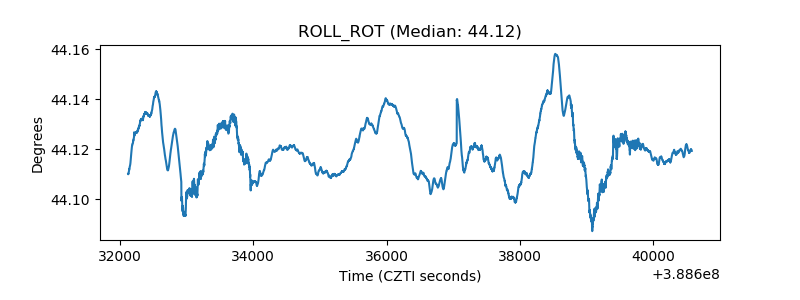 |
| _Roll_DEC | 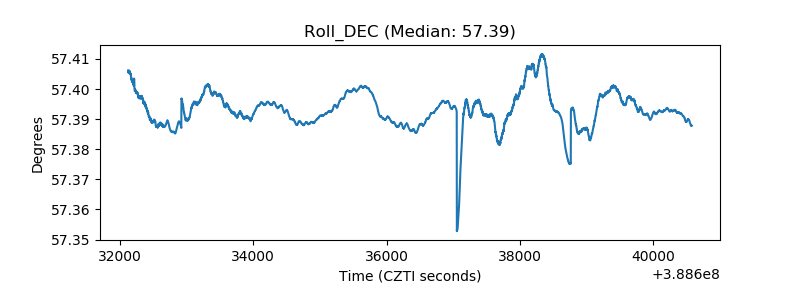 |
| _Roll_RA | 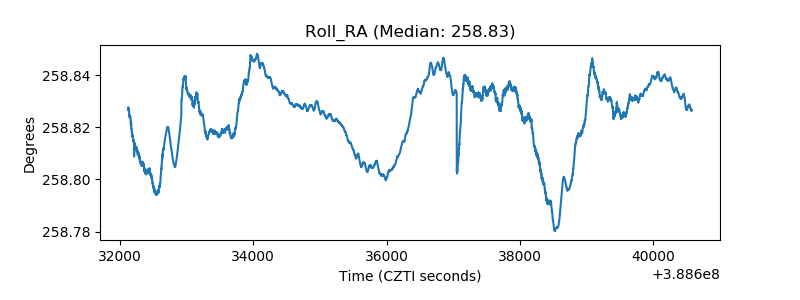 |
| Veto Counter | 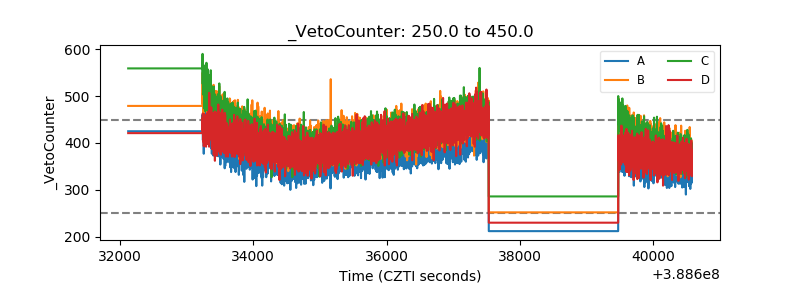 |