| Param | Original file | Final file |
|---|---|---|
| Filename | modeM0/AS1A11_093T01_9000005090_35553cztM0_level2.evt | modeM0/AS1A11_093T01_9000005090_35553cztM0_level2_quad_clean.evt |
| Size (bytes) | 527,172,480 | 66,565,440 |
| Size | 502.8 MB | 63.5 MB |
| Events in quadrant A | 7,034,497 | 312,388 |
| Events in quadrant B | 2,808,462 | 460,884 |
| Events in quadrant C | 3,110,259 | 458,372 |
| Events in quadrant D | 2,680,916 | 440,595 |
| Mode SS | |||
|---|---|---|---|
| Quadrant | BADHDUFLAG | Total packets | Discarded packets |
| A | 0 | 98 | 0 |
| B | 0 | 98 | 0 |
| C | 0 | 98 | 0 |
| D | 0 | 98 | 0 |
| Mode M0 | |||
|---|---|---|---|
| Quadrant | BADHDUFLAG | Total packets | Discarded packets |
| A | 0 | 24443 | 3 |
| B | 0 | 11479 | 2 |
| C | 0 | 12254 | 2 |
| D | 0 | 11155 | 2 |
| Mode M9 | |||
|---|---|---|---|
| Quadrant | BADHDUFLAG | Total packets | Discarded packets |
| A | 0 | 39 | 0 |
| B | 0 | 39 | 0 |
| C | 0 | 39 | 0 |
| D | 0 | 40 | 0 |
| Quadrant | Total seconds | Saturated seconds | Saturation percentage |
|---|---|---|---|
| A | 4888 | 1948 | 39.852700% |
| B | 4888 | 142 | 2.905074% |
| C | 4888 | 168 | 3.436989% |
| D | 4888 | 80 | 1.636661% |
Noise dominated data is calculated using 1-second bins in cleaned event files. If a bin has >2000 counts, and if more than 50% of those come from <1% of pixels, then it is considered to be noise-dominated and hence unusable.
| Quadrant | # 1 sec bins | Bins with >0 counts | Bins with >2000 counts | High rate bins dominated by noise | Noise dominated (total time) | Noise dominated (detector-on time) | Marked lightcurve |
|---|---|---|---|---|---|---|---|
| A | 7011 | 4888 | 758 | 758 | 10.81% | 15.51% | 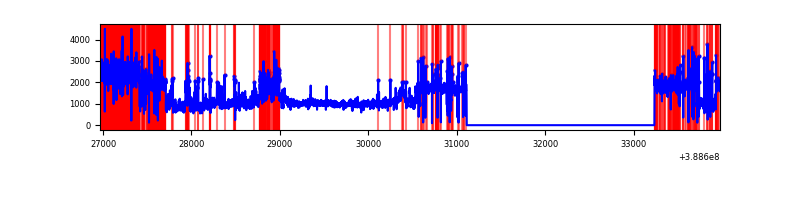 |
| B | 7011 | 4888 | 86 | 86 | 1.23% | 1.76% | 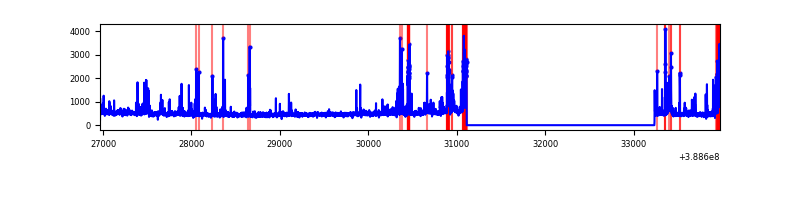 |
| C | 7011 | 4889 | 140 | 140 | 2.00% | 2.86% | 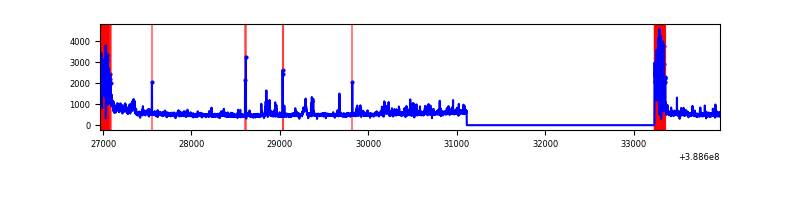 |
| D | 7011 | 4889 | 50 | 50 | 0.71% | 1.02% | 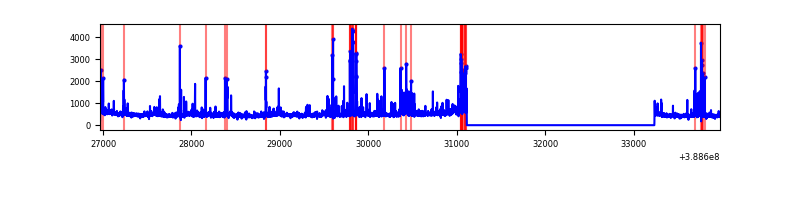 |
Top three noisy pixels from each quadrant. If the there are fewer than three noisy pixels in the level2.evt file, extra rows are filled as -1
| Pixel properties | Quadrant properties | ||||||
|---|---|---|---|---|---|---|---|
| Quadrant | DetID | PixID | Counts | Sigma | Mean | Median | Sigma |
| A | 15 | 169 | 5322973 | 61807.22 | 419 | 411 | 86.1 |
| A | 10 | 83 | 80624 | 931.46 | 419 | 411 | 86.1 |
| A | 13 | 6 | 9913 | 110.34 | 419 | 411 | 86.1 |
| B | 5 | 172 | 525775 | 4907.41 | 566 | 552 | 107.0 |
| B | 0 | 189 | 31663 | 290.68 | 566 | 552 | 107.0 |
| B | 12 | 111 | 12616 | 112.72 | 566 | 552 | 107.0 |
| C | 0 | 10 | 566382 | 4427.13 | 554 | 558 | 127.8 |
| C | 15 | 214 | 215887 | 1684.78 | 554 | 558 | 127.8 |
| C | 10 | 49 | 80671 | 626.82 | 554 | 558 | 127.8 |
| D | 8 | 195 | 121682 | 921.3 | 548 | 535 | 131.5 |
| D | 13 | 249 | 100012 | 756.5 | 548 | 535 | 131.5 |
| D | 5 | 157 | 71687 | 541.1 | 548 | 535 | 131.5 |
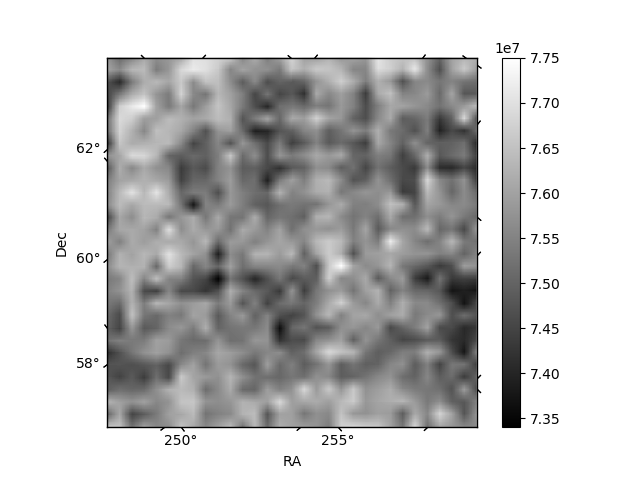
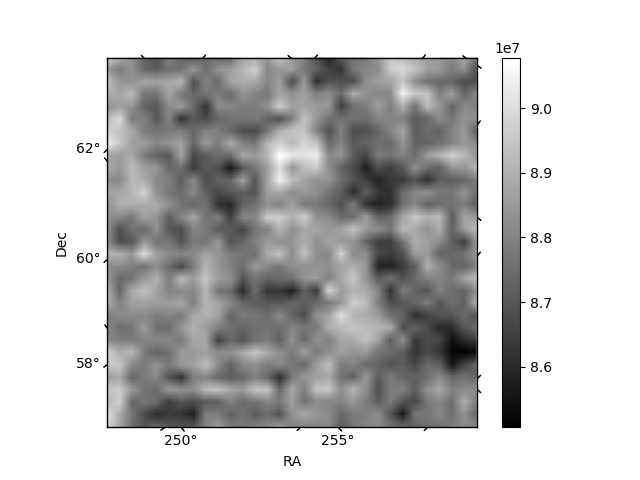
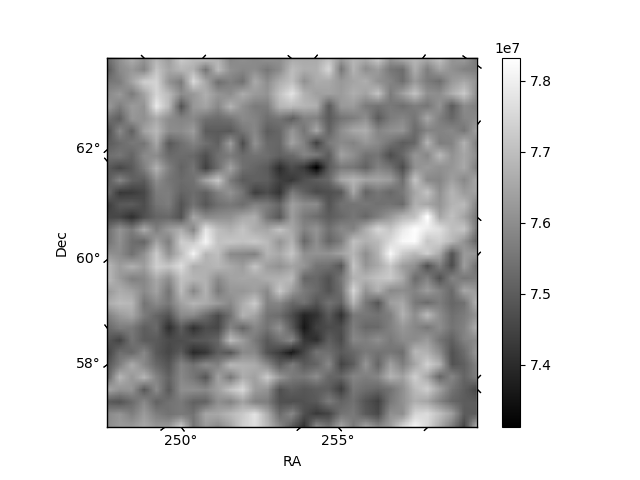
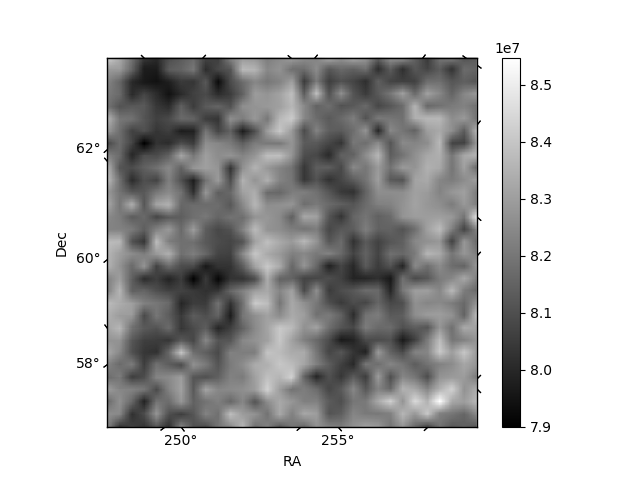
Histogram calculated using DETX and DETY for each event in the final _common_clean file
| Quadrant A | 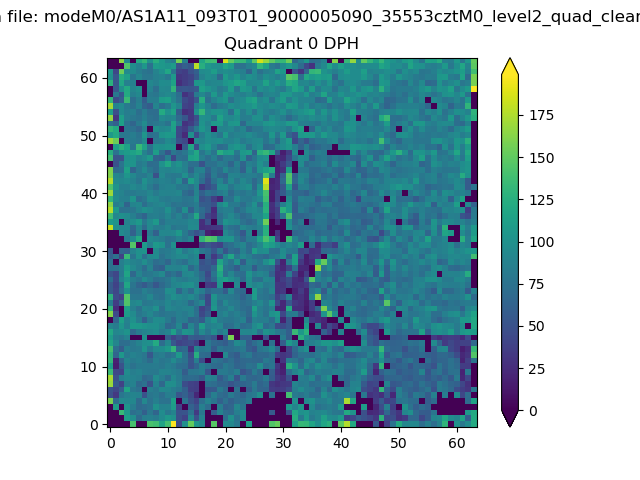 |
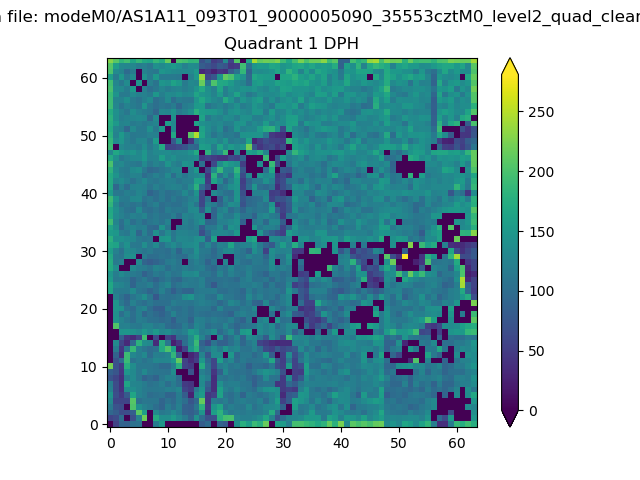 |
Quadrant B |
|---|---|---|---|
| Quadrant D | 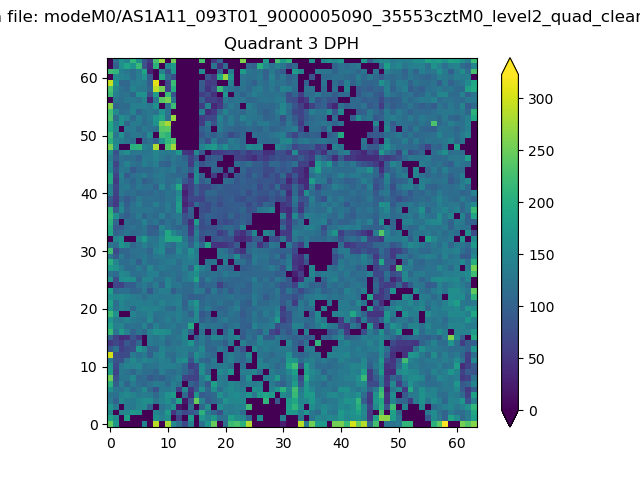 |
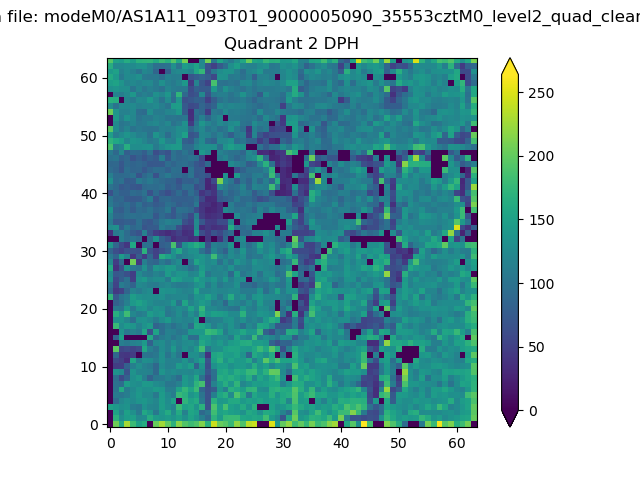 |
Quadrant C |
| Plot type | Count rate plots | Images |
|---|---|---|
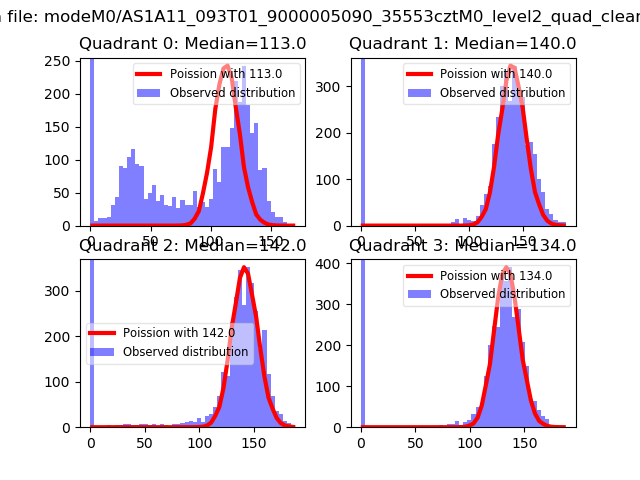
| Comparison with Poisson distribution Blue bars denote a histogram of data divided into 1 sec bins. Red curve is a Poisson curve with rate = median count rate of data. |
 |
 |
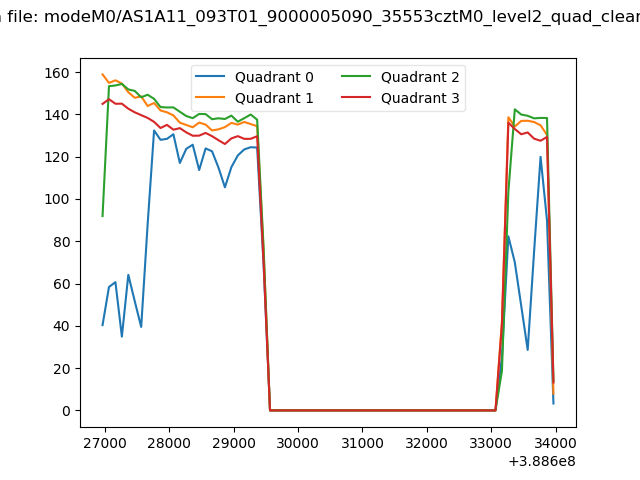
| Quadrant-wise count rates Data is divided into 100 sec bins |
 |
|
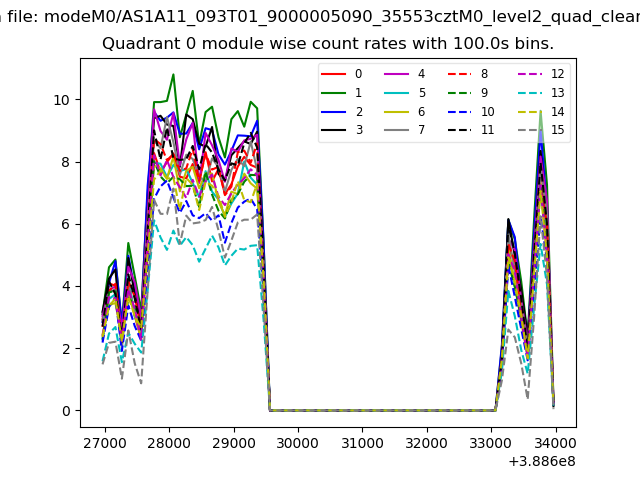
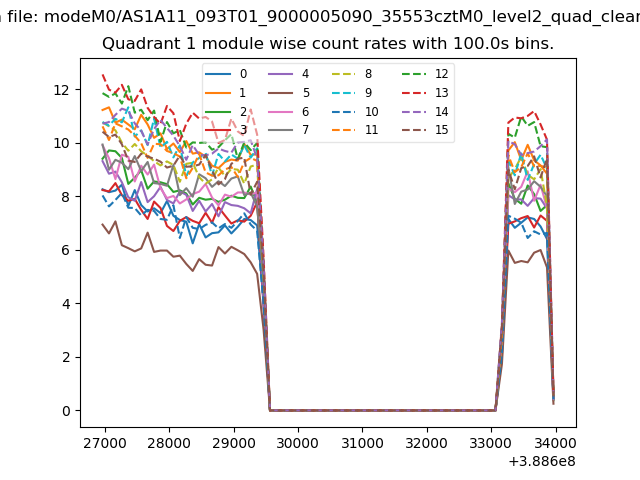
| Module-wise count rates for Quadrant A Data is divided into 100 sec bins |
 |
 |
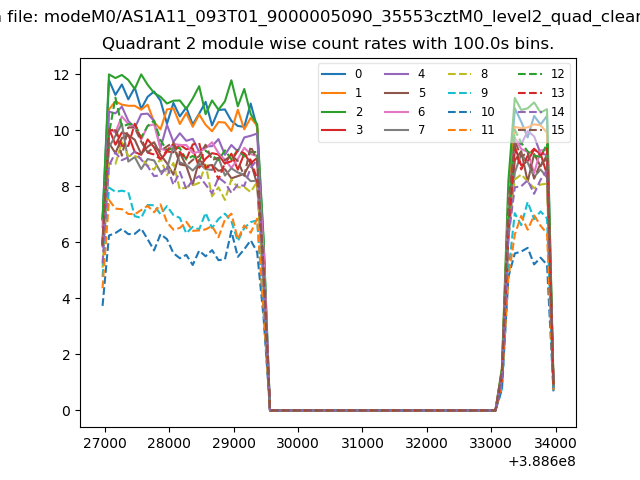
| Module-wise count rates for Quadrant B Data is divided into 100 sec bins |
 |
 |
| Module-wise count rates for Quadrant C Data is divided into 100 sec bins |
 |
 |
| Module-wise count rates for Quadrant D Data is divided into 100 sec bins |
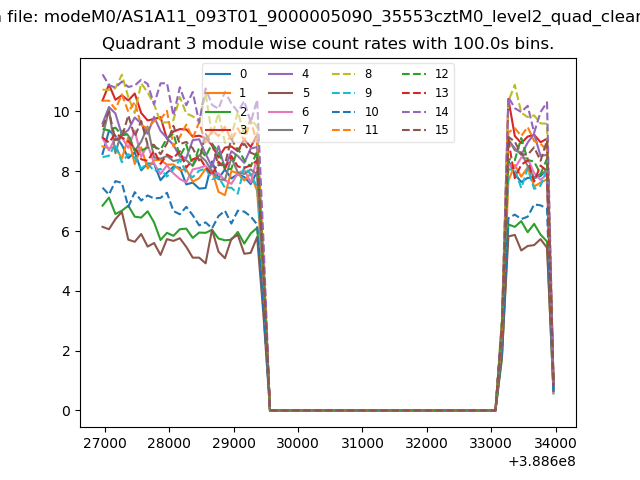 |
 |
| Parameter | Plot |
|---|---|
| CZT HV Monitor | 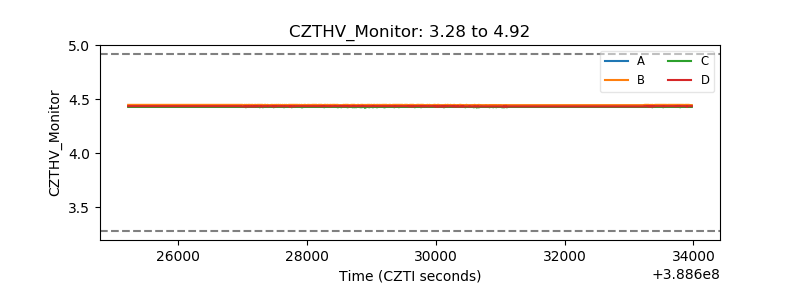 |
| D_VDD | 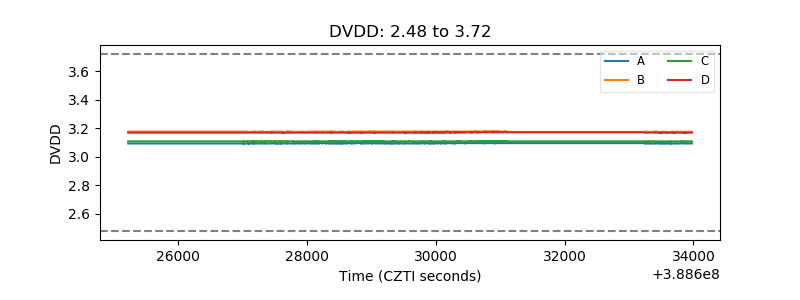 |
| Temperature 1 | 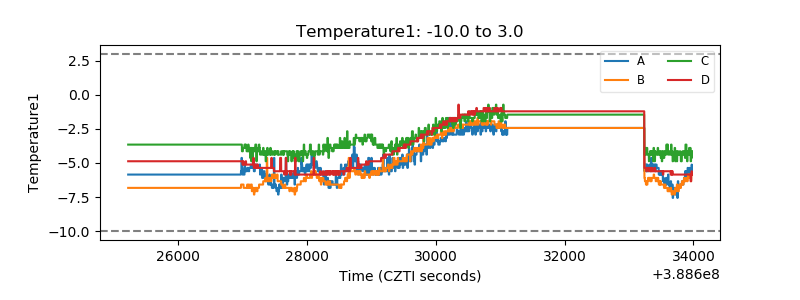 |
| Veto HV Monitor | 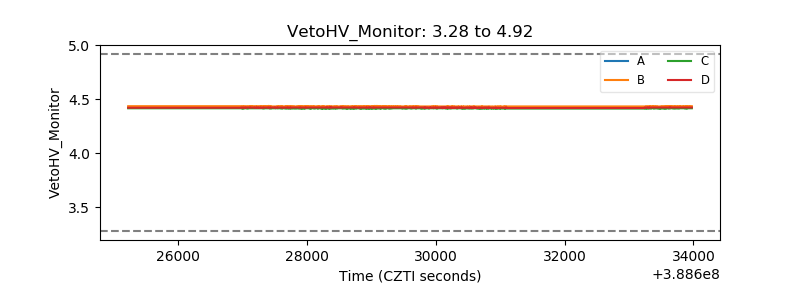 |
| Veto LLD | 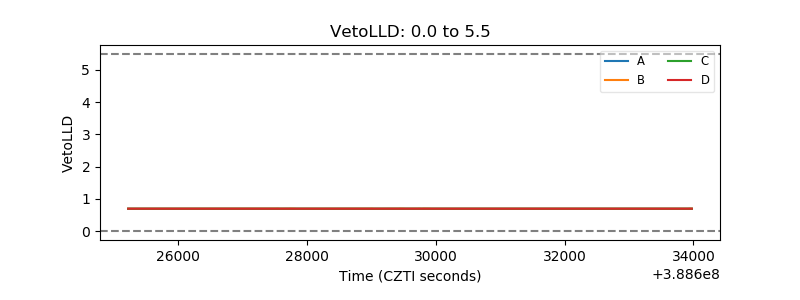 |
| Alpha Counter | 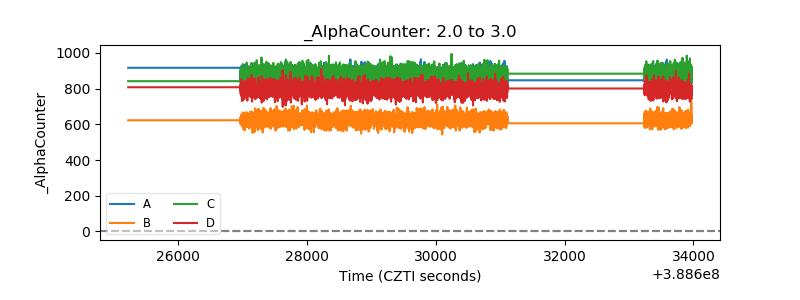 |
| _CPM_Rate | 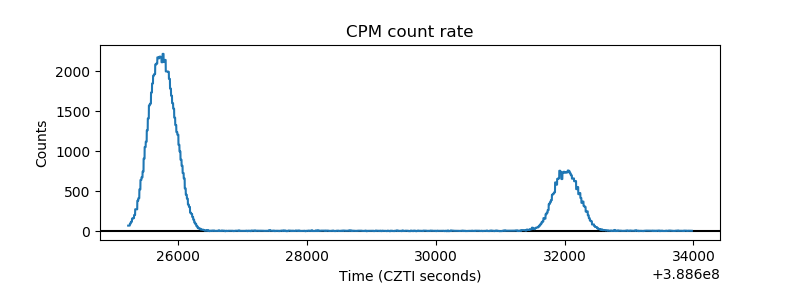 |
| CZT Counter | 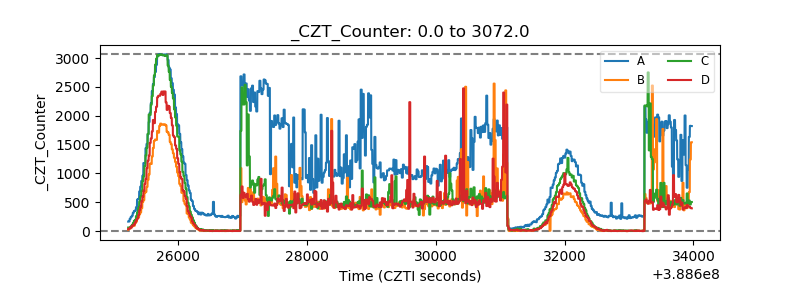 |
| +2.5 Volts monitor | 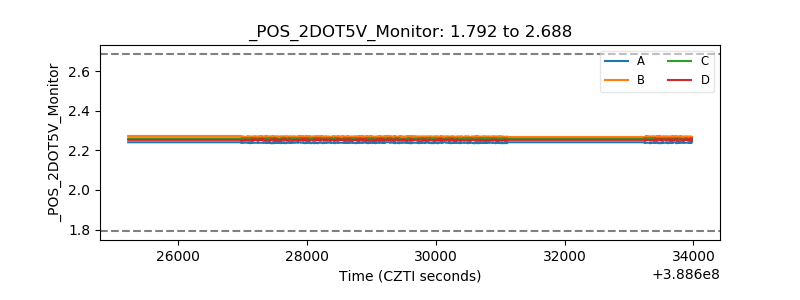 |
| +5 Volts monitor | 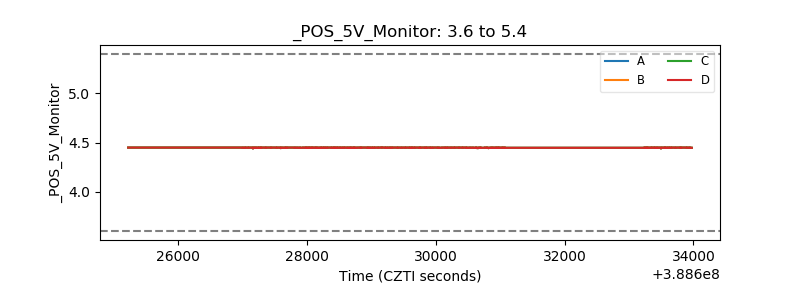 |
| _ROLL_ROT | 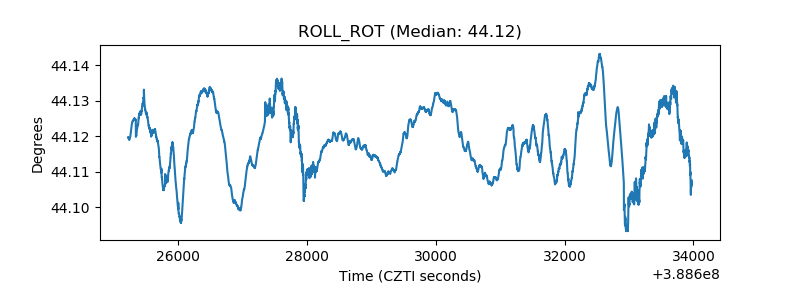 |
| _Roll_DEC | 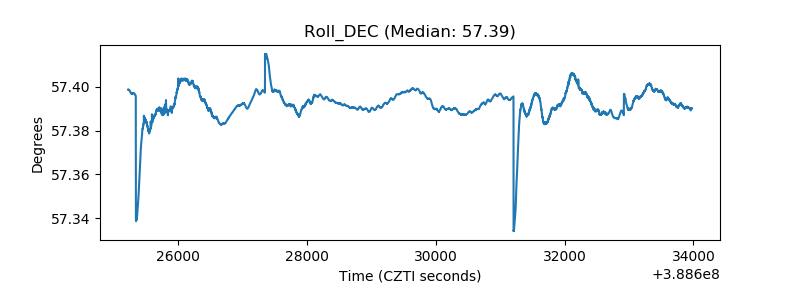 |
| _Roll_RA | 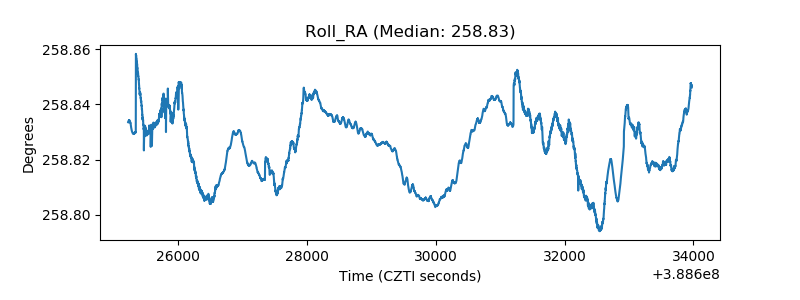 |
| Veto Counter | 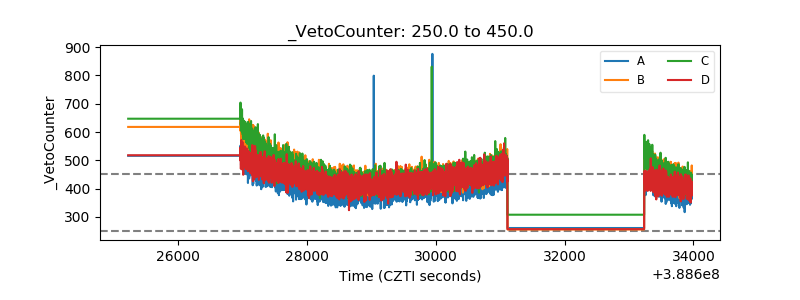 |