| Param | Original file | Final file |
|---|---|---|
| Filename | modeM0/AS1A11_093T01_9000005090_35552cztM0_level2.evt | modeM0/AS1A11_093T01_9000005090_35552cztM0_level2_quad_clean.evt |
| Size (bytes) | 699,975,360 | 71,743,680 |
| Size | 667.5 MB | 68.4 MB |
| Events in quadrant A | 12,162,346 | 168,833 |
| Events in quadrant B | 2,830,709 | 562,543 |
| Events in quadrant C | 3,156,113 | 560,965 |
| Events in quadrant D | 2,716,975 | 533,956 |
| Mode SS | |||
|---|---|---|---|
| Quadrant | BADHDUFLAG | Total packets | Discarded packets |
| A | 0 | 100 | 0 |
| B | 0 | 100 | 0 |
| C | 0 | 100 | 0 |
| D | 0 | 100 | 0 |
| Mode M0 | |||
|---|---|---|---|
| Quadrant | BADHDUFLAG | Total packets | Discarded packets |
| A | 0 | 39509 | 3 |
| B | 0 | 11482 | 2 |
| C | 0 | 12329 | 2 |
| D | 0 | 11260 | 2 |
| Mode M9 | |||
|---|---|---|---|
| Quadrant | BADHDUFLAG | Total packets | Discarded packets |
| A | 0 | 29 | 0 |
| B | 0 | 29 | 0 |
| C | 0 | 29 | 0 |
| D | 0 | 30 | 0 |
| Quadrant | Total seconds | Saturated seconds | Saturation percentage |
|---|---|---|---|
| A | 4908 | 4777 | 97.330888% |
| B | 4908 | 127 | 2.587612% |
| C | 4908 | 181 | 3.687857% |
| D | 4908 | 31 | 0.631622% |
Noise dominated data is calculated using 1-second bins in cleaned event files. If a bin has >2000 counts, and if more than 50% of those come from <1% of pixels, then it is considered to be noise-dominated and hence unusable.
| Quadrant | # 1 sec bins | Bins with >0 counts | Bins with >2000 counts | High rate bins dominated by noise | Noise dominated (total time) | Noise dominated (detector-on time) | Marked lightcurve |
|---|---|---|---|---|---|---|---|
| A | 7061 | 4908 | 4276 | 4276 | 60.56% | 87.12% | 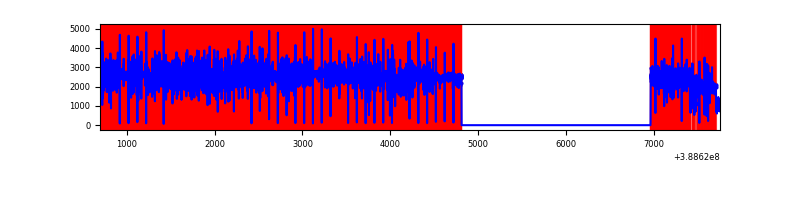 |
| B | 7061 | 4909 | 77 | 77 | 1.09% | 1.57% | 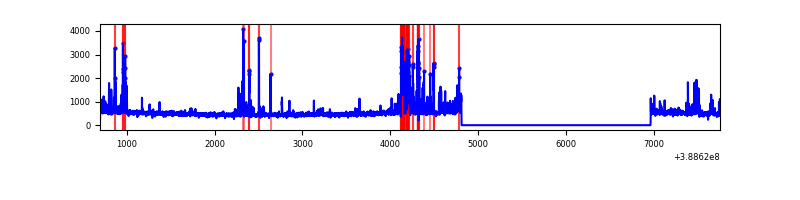 |
| C | 7061 | 4909 | 139 | 139 | 1.97% | 2.83% | 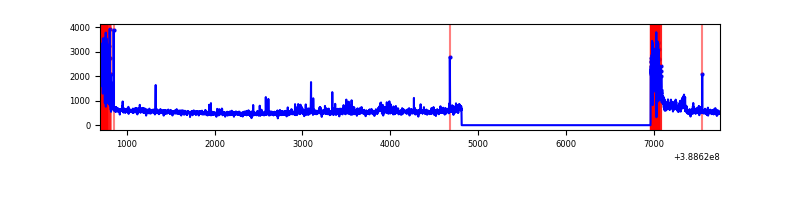 |
| D | 7061 | 4909 | 21 | 21 | 0.30% | 0.43% | 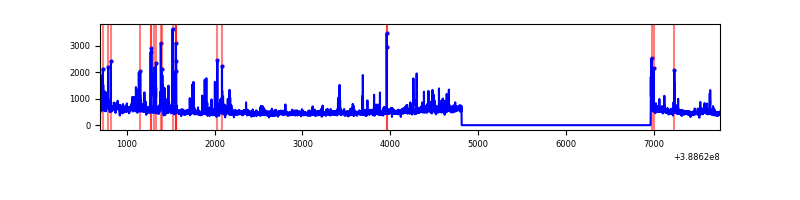 |
Top three noisy pixels from each quadrant. If the there are fewer than three noisy pixels in the level2.evt file, extra rows are filled as -1
| Pixel properties | Quadrant properties | ||||||
|---|---|---|---|---|---|---|---|
| Quadrant | DetID | PixID | Counts | Sigma | Mean | Median | Sigma |
| A | 15 | 169 | 11262364 | 251531.42 | 215 | 211 | 44.8 |
| A | 10 | 83 | 49910 | 1109.99 | 215 | 211 | 44.8 |
| A | 13 | 6 | 10303 | 225.4 | 215 | 211 | 44.8 |
| B | 5 | 172 | 441735 | 3984.96 | 588 | 573 | 110.7 |
| B | 15 | 85 | 31957 | 283.49 | 588 | 573 | 110.7 |
| B | 0 | 189 | 22846 | 201.19 | 588 | 573 | 110.7 |
| C | 0 | 10 | 531176 | 3998.34 | 580 | 587 | 132.7 |
| C | 15 | 214 | 217489 | 1634.5 | 580 | 587 | 132.7 |
| C | 10 | 49 | 87280 | 653.29 | 580 | 587 | 132.7 |
| D | 8 | 195 | 191568 | 1383.27 | 574 | 560 | 138.1 |
| D | 2 | 250 | 176027 | 1270.73 | 574 | 560 | 138.1 |
| D | 2 | 153 | 42605 | 304.49 | 574 | 560 | 138.1 |
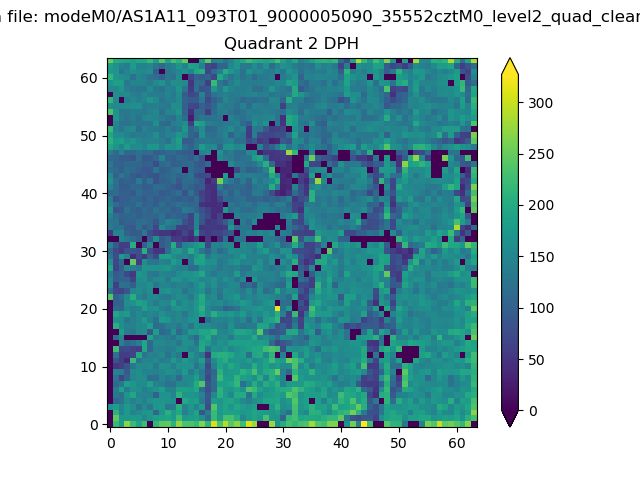
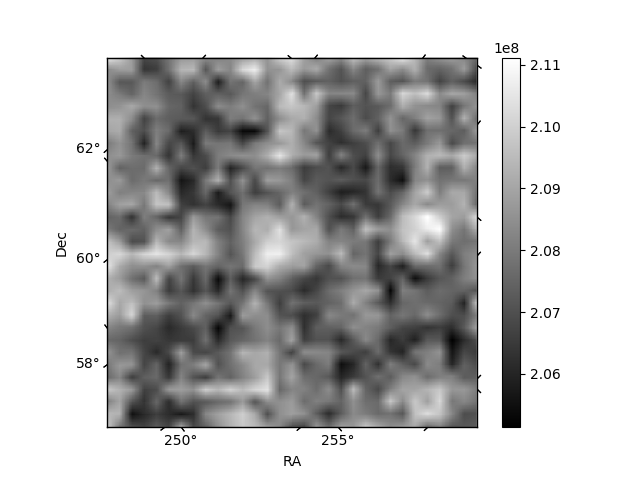
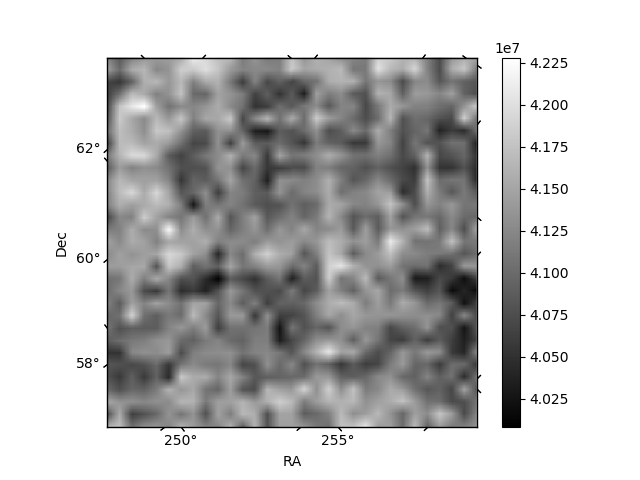
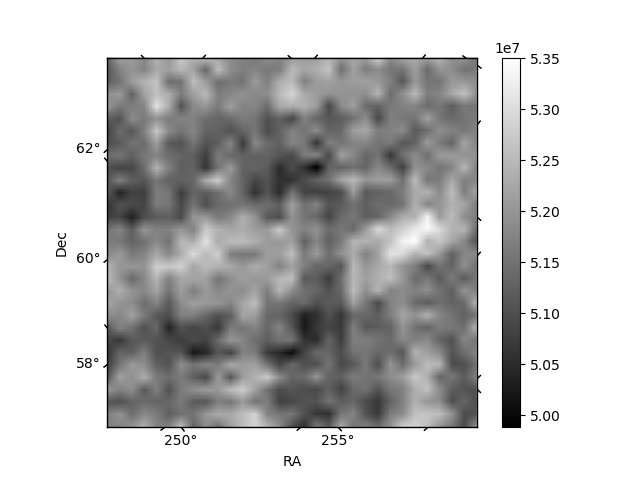
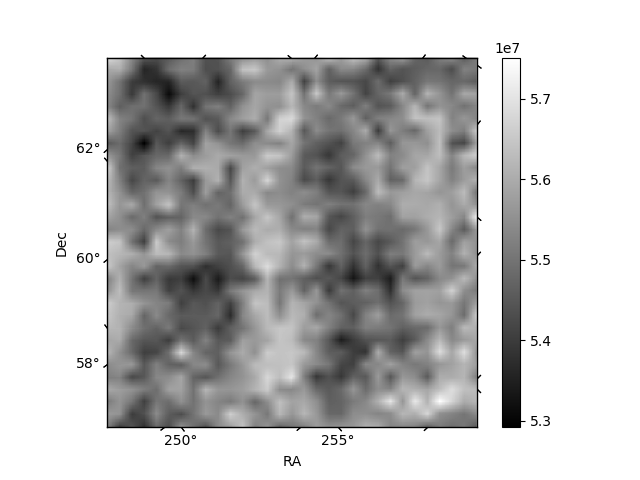
Histogram calculated using DETX and DETY for each event in the final _common_clean file
| Quadrant A | 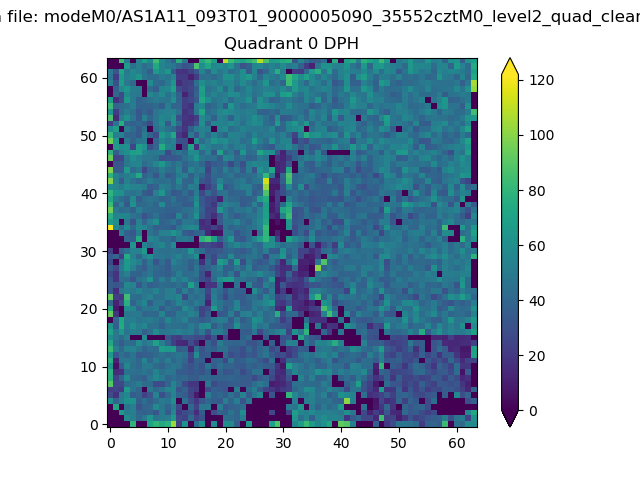 |
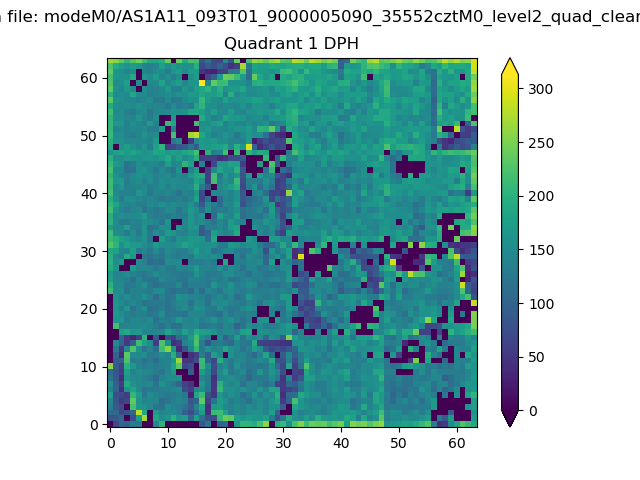 |
Quadrant B |
|---|---|---|---|
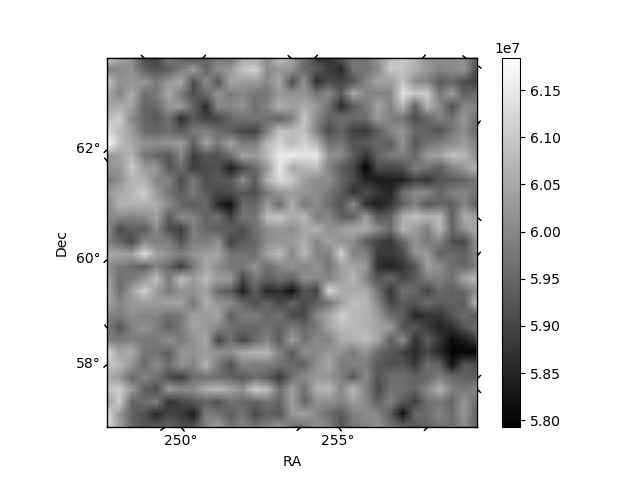
| Quadrant D | 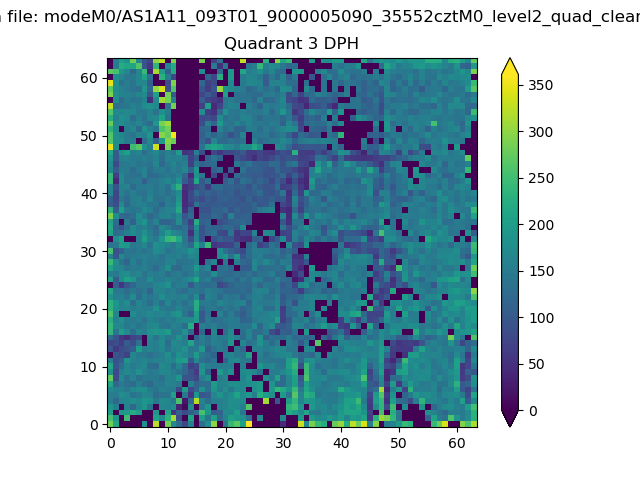 |
 |
Quadrant C |
| Plot type | Count rate plots | Images |
|---|---|---|
| Comparison with Poisson distribution Blue bars denote a histogram of data divided into 1 sec bins. Red curve is a Poisson curve with rate = median count rate of data. |
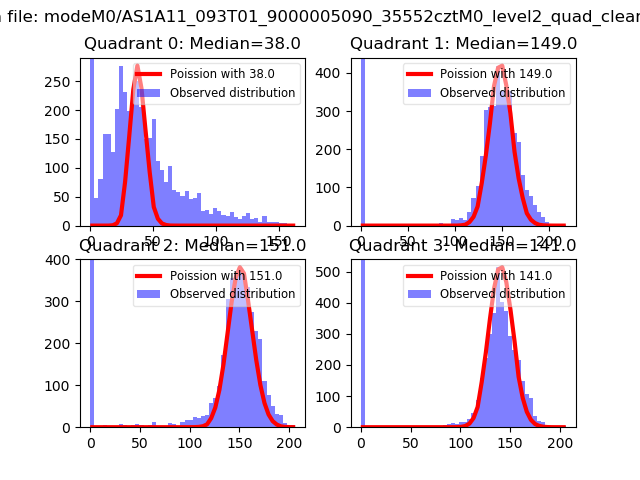 |
 |
| Quadrant-wise count rates Data is divided into 100 sec bins |
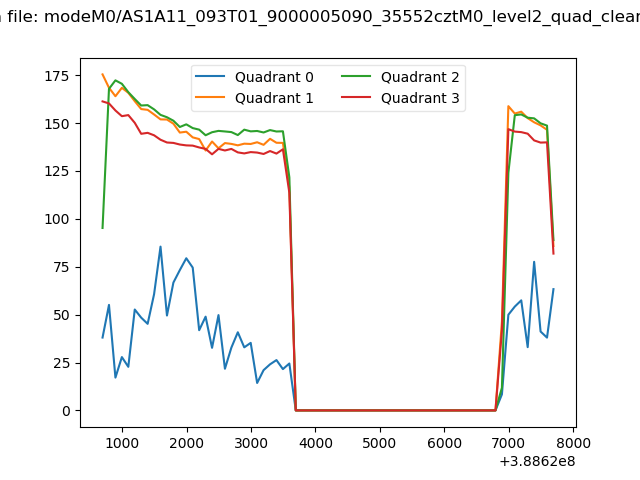 |
|
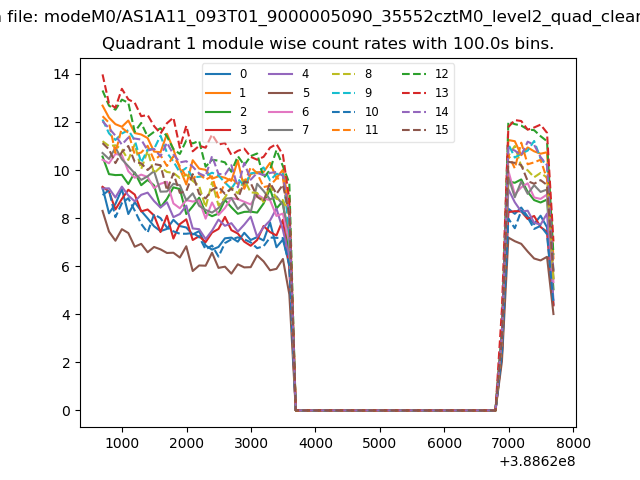
| Module-wise count rates for Quadrant A Data is divided into 100 sec bins |
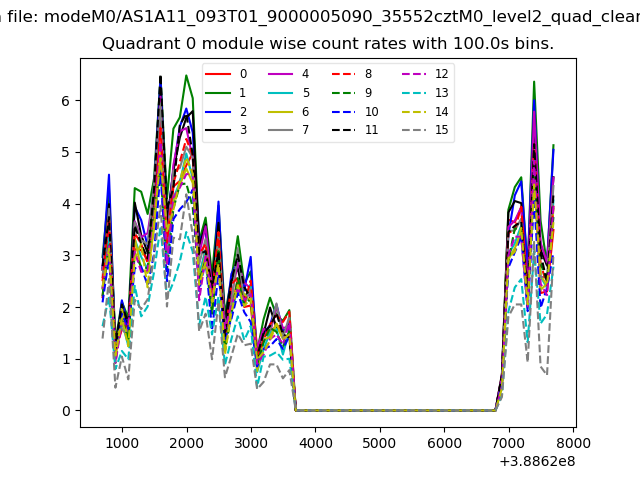 |
 |
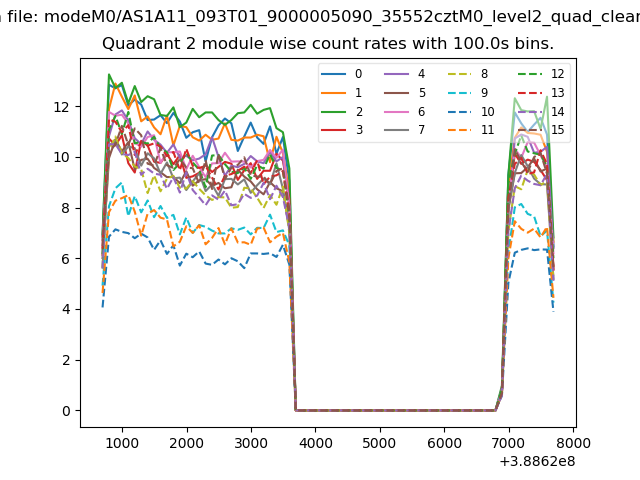
| Module-wise count rates for Quadrant B Data is divided into 100 sec bins |
 |
 |
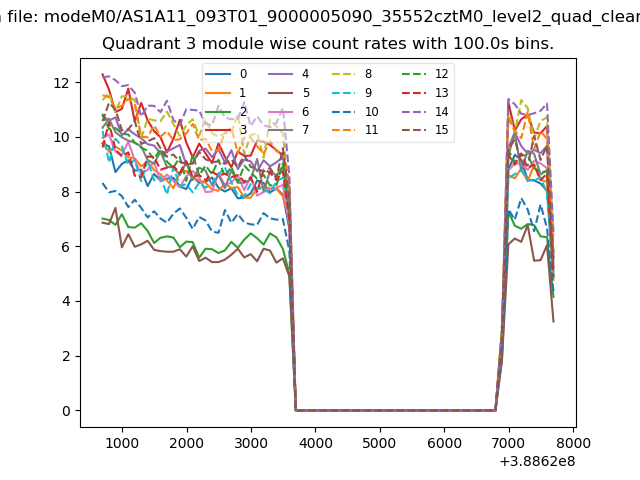
| Module-wise count rates for Quadrant C Data is divided into 100 sec bins |
 |
 |
| Module-wise count rates for Quadrant D Data is divided into 100 sec bins |
 |
 |
| Parameter | Plot |
|---|---|
| CZT HV Monitor | 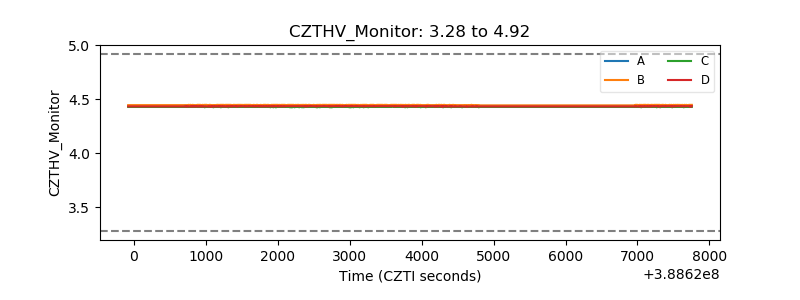 |
| D_VDD | 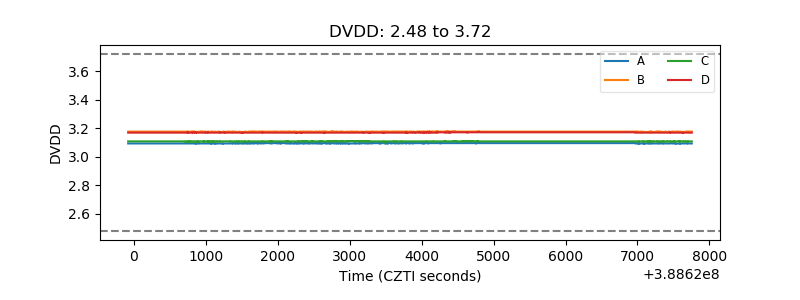 |
| Temperature 1 |  |
| Veto HV Monitor | 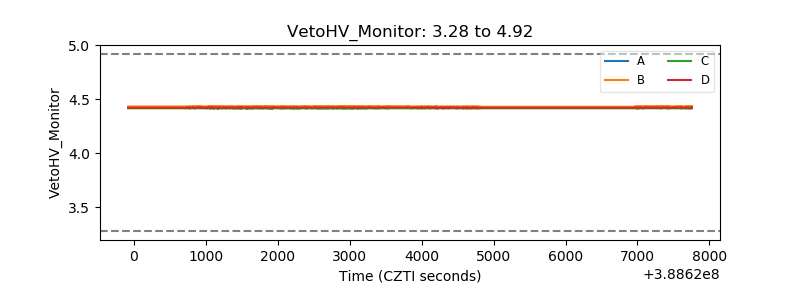 |
| Veto LLD | 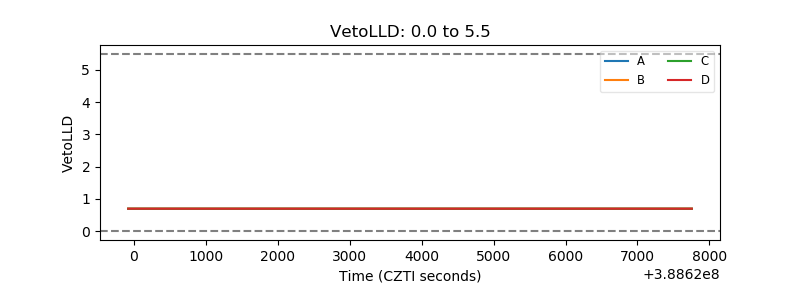 |
| Alpha Counter | 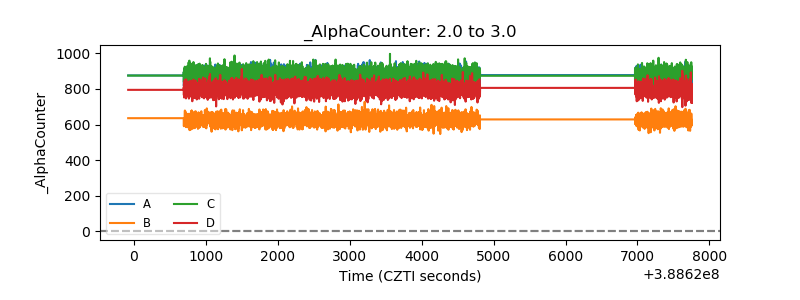 |
| _CPM_Rate | 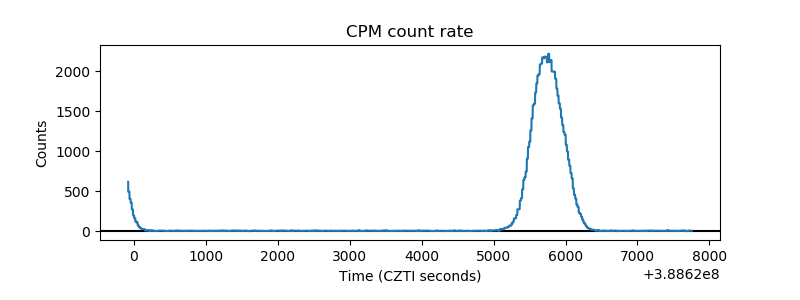 |
| CZT Counter | 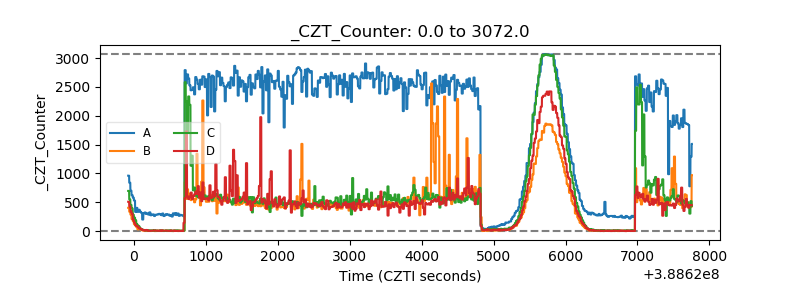 |
| +2.5 Volts monitor | 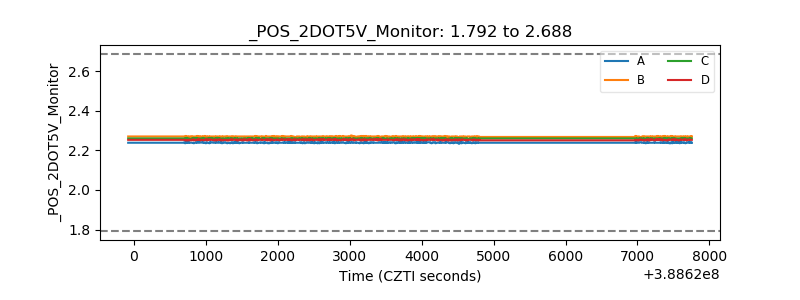 |
| +5 Volts monitor | 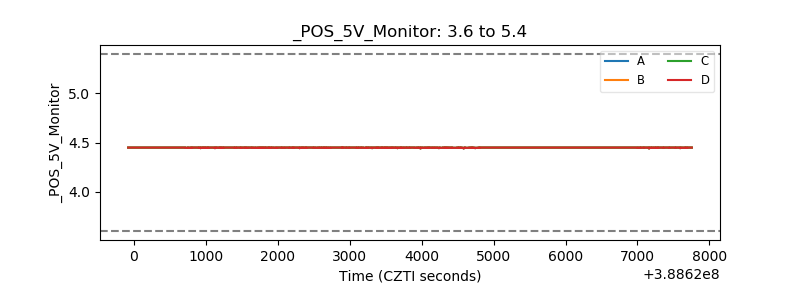 |
| _ROLL_ROT | 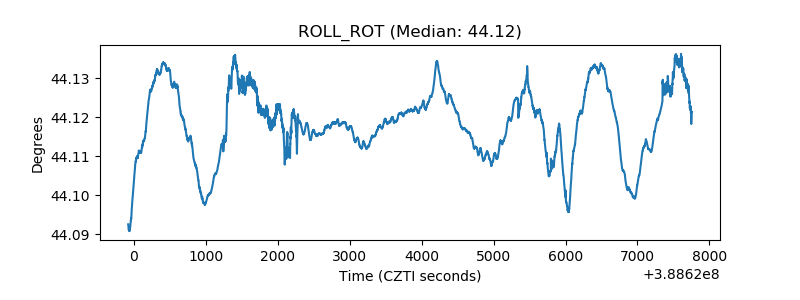 |
| _Roll_DEC | 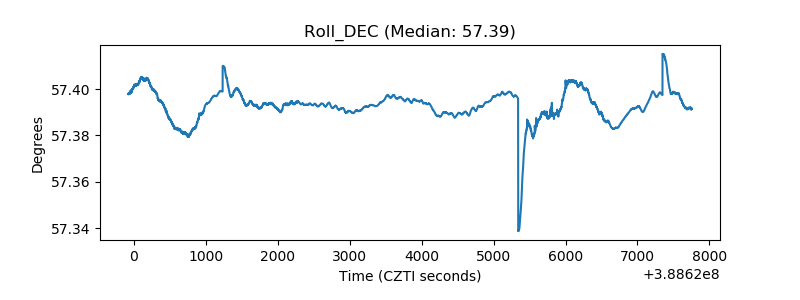 |
| _Roll_RA | 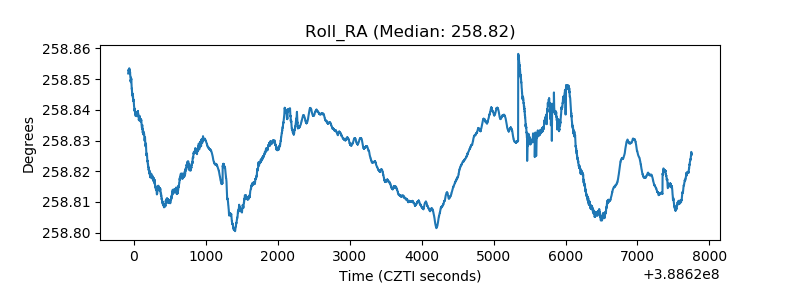 |
| Veto Counter | 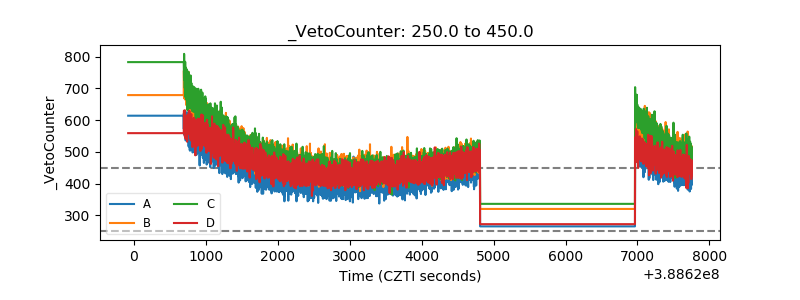 |