| Param | Original file | Final file |
|---|---|---|
| Filename | modeM0/AS1A11_093T01_9000005090_35547cztM0_level2.evt | modeM0/AS1A11_093T01_9000005090_35547cztM0_level2_quad_clean.evt |
| Size (bytes) | 643,772,160 | 80,418,240 |
| Size | 613.9 MB | 76.7 MB |
| Events in quadrant A | 9,067,956 | 377,994 |
| Events in quadrant B | 3,588,515 | 555,612 |
| Events in quadrant C | 3,117,417 | 577,079 |
| Events in quadrant D | 3,356,767 | 545,178 |
| Mode SS | |||
|---|---|---|---|
| Quadrant | BADHDUFLAG | Total packets | Discarded packets |
| A | 0 | 112 | 0 |
| B | 0 | 112 | 0 |
| C | 0 | 112 | 0 |
| D | 0 | 112 | 0 |
| Mode M0 | |||
|---|---|---|---|
| Quadrant | BADHDUFLAG | Total packets | Discarded packets |
| A | 0 | 30478 | 3 |
| B | 0 | 14352 | 2 |
| C | 0 | 12479 | 2 |
| D | 0 | 13656 | 2 |
| Mode M9 | |||
|---|---|---|---|
| Quadrant | BADHDUFLAG | Total packets | Discarded packets |
| A | 0 | 29 | 0 |
| B | 0 | 29 | 0 |
| C | 0 | 29 | 0 |
| D | 0 | 30 | 0 |
| Quadrant | Total seconds | Saturated seconds | Saturation percentage |
|---|---|---|---|
| A | 5396 | 2980 | 55.226093% |
| B | 5396 | 260 | 4.818384% |
| C | 5396 | 148 | 2.742772% |
| D | 5396 | 153 | 2.835434% |
Noise dominated data is calculated using 1-second bins in cleaned event files. If a bin has >2000 counts, and if more than 50% of those come from <1% of pixels, then it is considered to be noise-dominated and hence unusable.
| Quadrant | # 1 sec bins | Bins with >0 counts | Bins with >2000 counts | High rate bins dominated by noise | Noise dominated (total time) | Noise dominated (detector-on time) | Marked lightcurve |
|---|---|---|---|---|---|---|---|
| A | 7128 | 5397 | 2601 | 2601 | 36.49% | 48.19% | 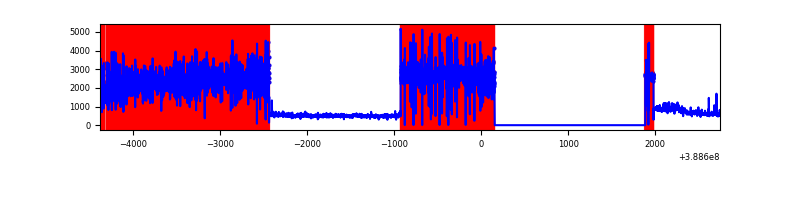 |
| B | 7128 | 5397 | 154 | 154 | 2.16% | 2.85% | 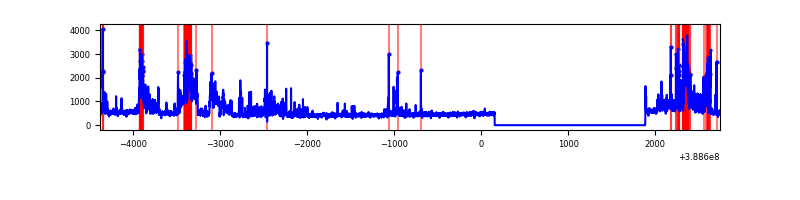 |
| C | 7128 | 5397 | 92 | 92 | 1.29% | 1.70% | 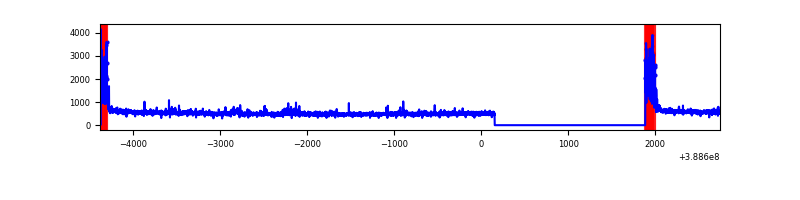 |
| D | 7128 | 5397 | 103 | 103 | 1.45% | 1.91% | 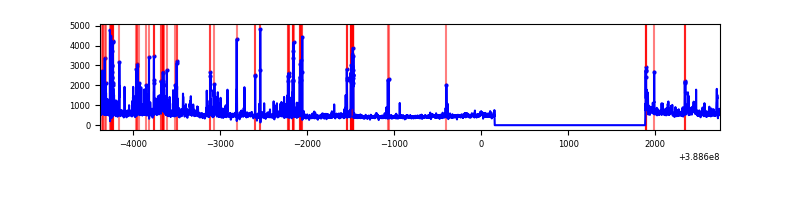 |
Top three noisy pixels from each quadrant. If the there are fewer than three noisy pixels in the level2.evt file, extra rows are filled as -1
| Pixel properties | Quadrant properties | ||||||
|---|---|---|---|---|---|---|---|
| Quadrant | DetID | PixID | Counts | Sigma | Mean | Median | Sigma |
| A | 15 | 169 | 7225753 | 79353.39 | 448 | 439 | 91.1 |
| A | 10 | 83 | 97954 | 1070.98 | 448 | 439 | 91.1 |
| A | 8 | 6 | 7928 | 82.25 | 448 | 439 | 91.1 |
| B | 5 | 172 | 665804 | 5622.17 | 619 | 604 | 118.3 |
| B | 5 | 200 | 290011 | 2446.03 | 619 | 604 | 118.3 |
| B | 0 | 190 | 154322 | 1299.2 | 619 | 604 | 118.3 |
| C | 0 | 10 | 414702 | 2892.9 | 620 | 626 | 143.1 |
| C | 15 | 214 | 238254 | 1660.17 | 620 | 626 | 143.1 |
| C | 14 | 67 | 25466 | 173.54 | 620 | 626 | 143.1 |
| D | 2 | 250 | 384631 | 2569.19 | 615 | 598 | 149.5 |
| D | 8 | 195 | 205828 | 1372.99 | 615 | 598 | 149.5 |
| D | 10 | 118 | 179217 | 1194.96 | 615 | 598 | 149.5 |
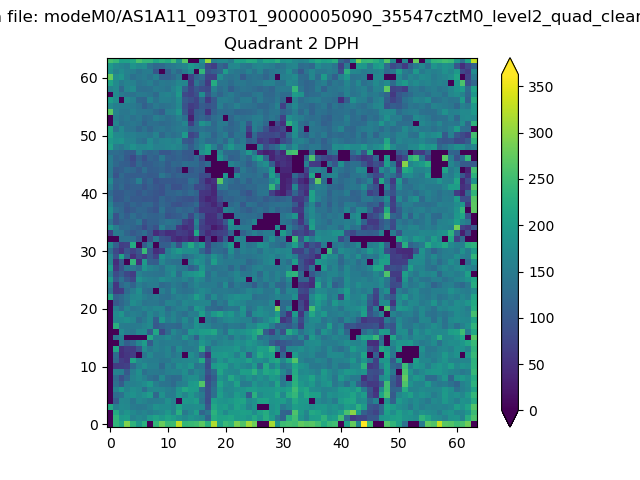
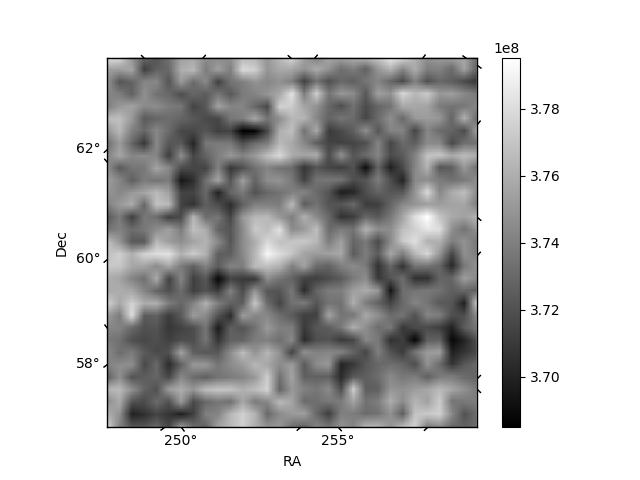
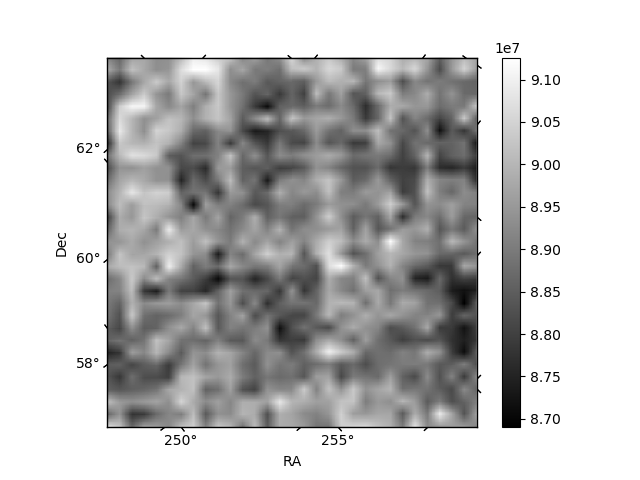
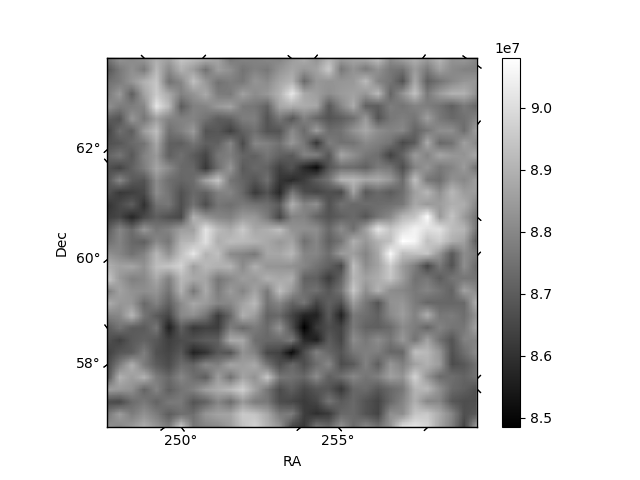
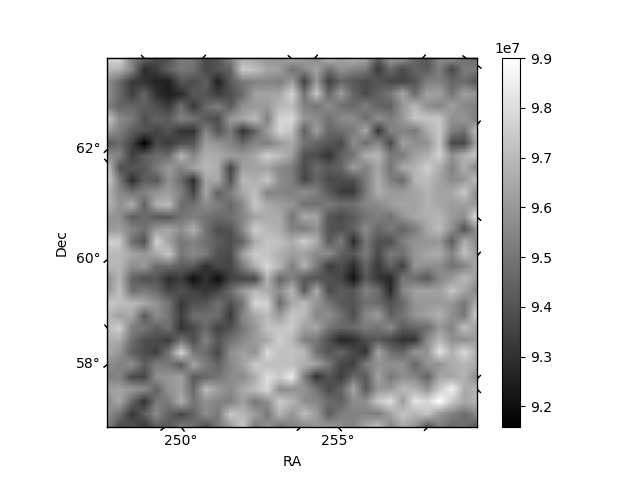
Histogram calculated using DETX and DETY for each event in the final _common_clean file
| Quadrant A | 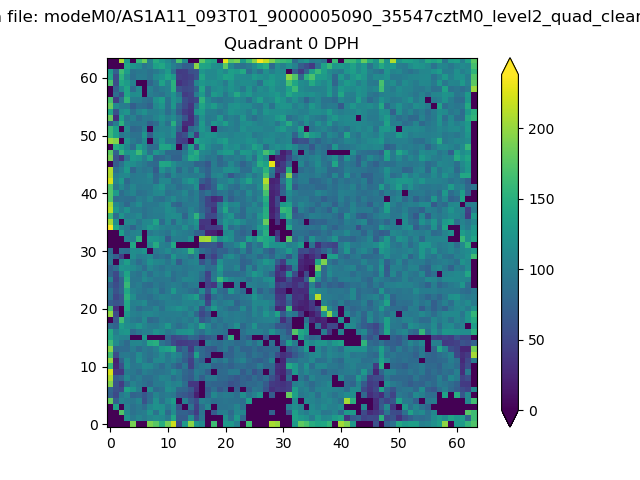 |
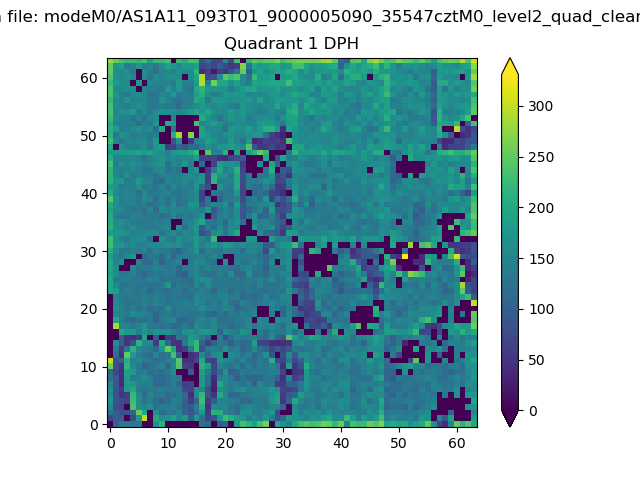 |
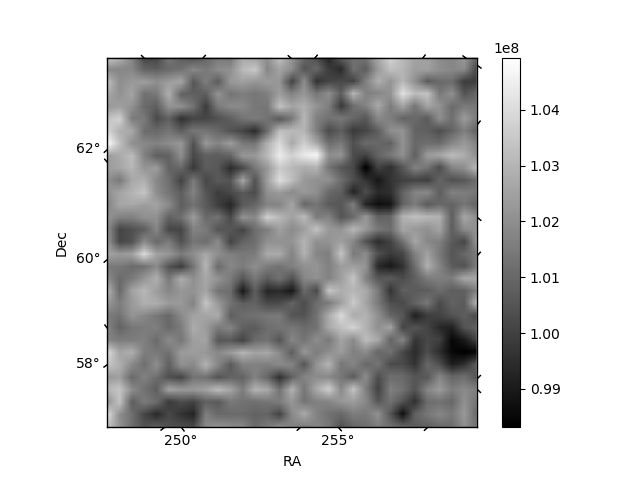
Quadrant B |
|---|---|---|---|
| Quadrant D | 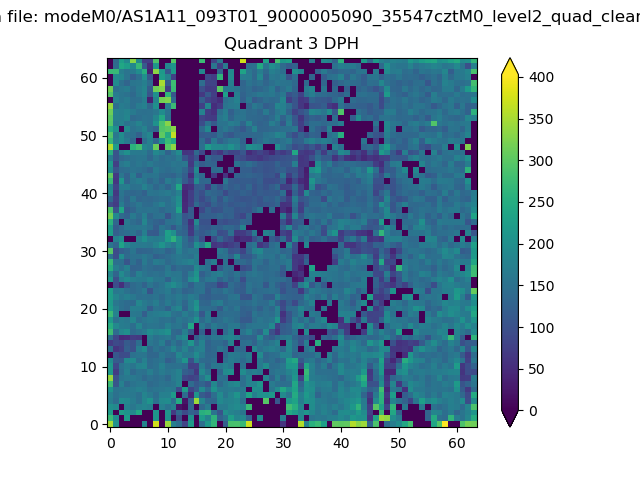 |
 |
Quadrant C |
| Plot type | Count rate plots | Images |
|---|---|---|
| Comparison with Poisson distribution Blue bars denote a histogram of data divided into 1 sec bins. Red curve is a Poisson curve with rate = median count rate of data. |
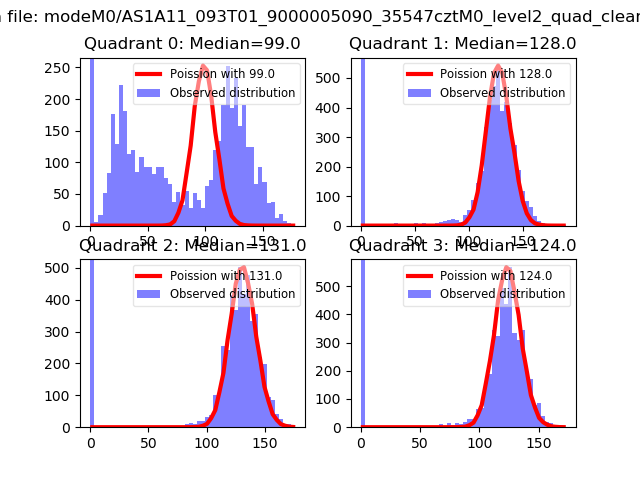 |
 |
| Quadrant-wise count rates Data is divided into 100 sec bins |
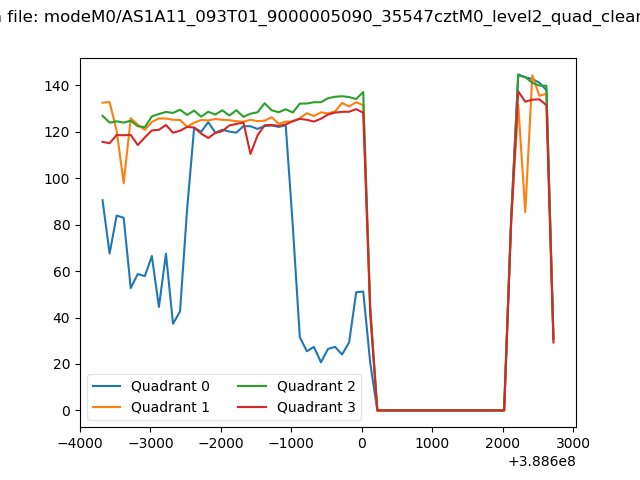 |
|
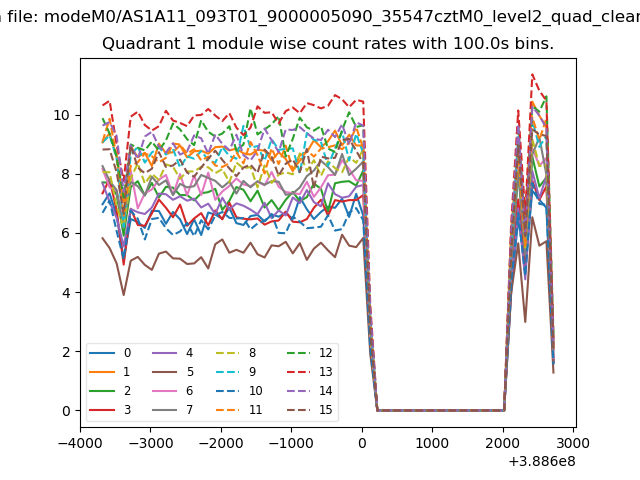
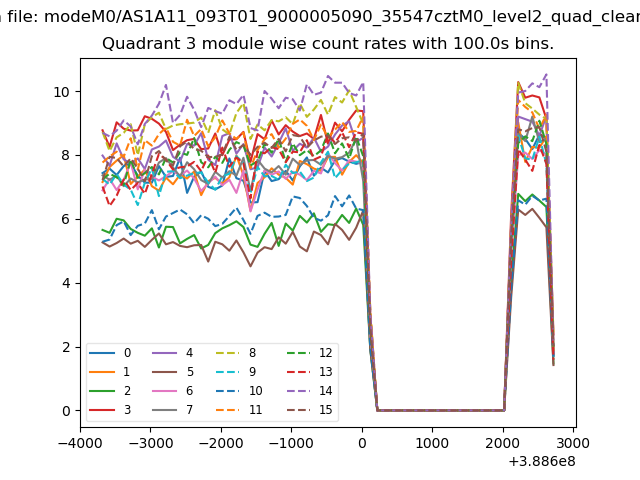
| Module-wise count rates for Quadrant A Data is divided into 100 sec bins |
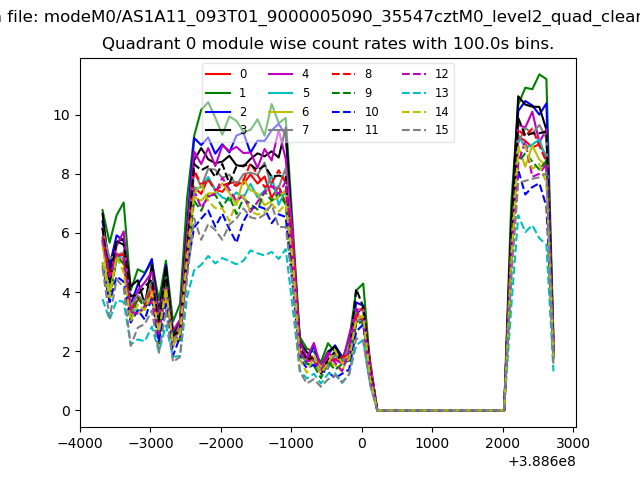 |
 |
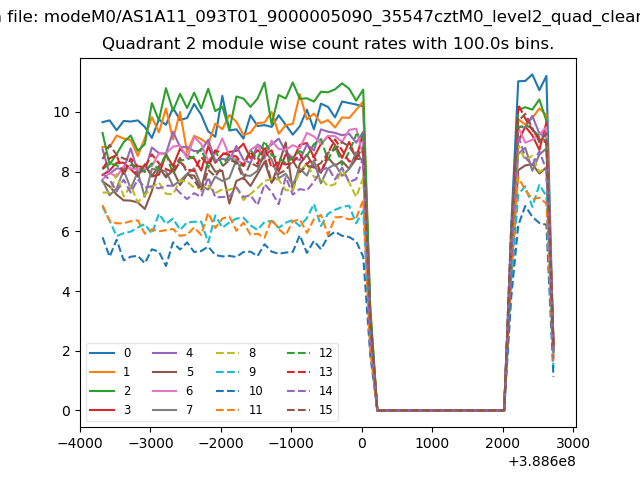
| Module-wise count rates for Quadrant B Data is divided into 100 sec bins |
 |
 |
| Module-wise count rates for Quadrant C Data is divided into 100 sec bins |
 |
 |
| Module-wise count rates for Quadrant D Data is divided into 100 sec bins |
 |
 |
| Parameter | Plot |
|---|---|
| CZT HV Monitor | 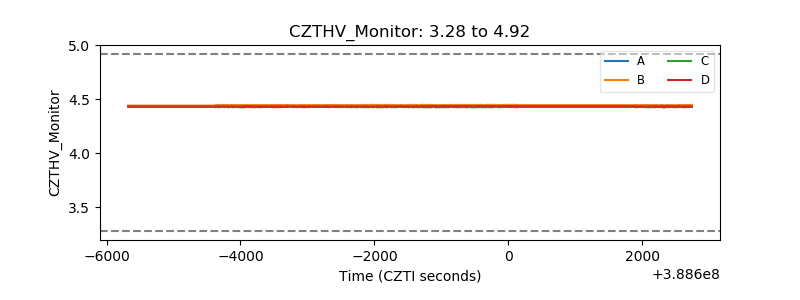 |
| D_VDD | 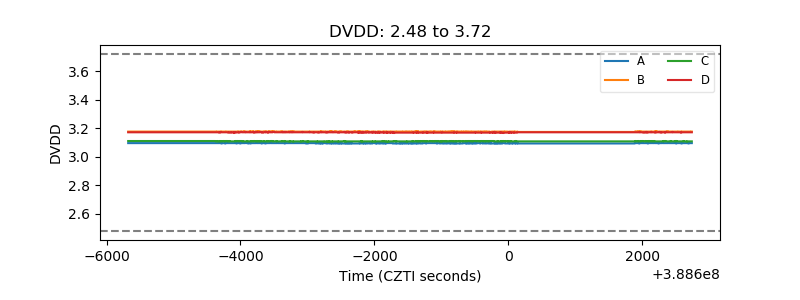 |
| Temperature 1 | 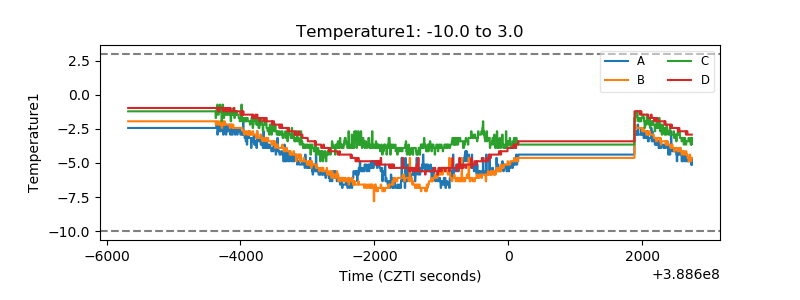 |
| Veto HV Monitor | 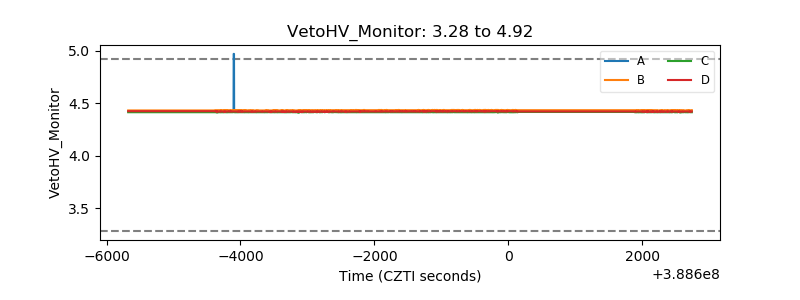 |
| Veto LLD | 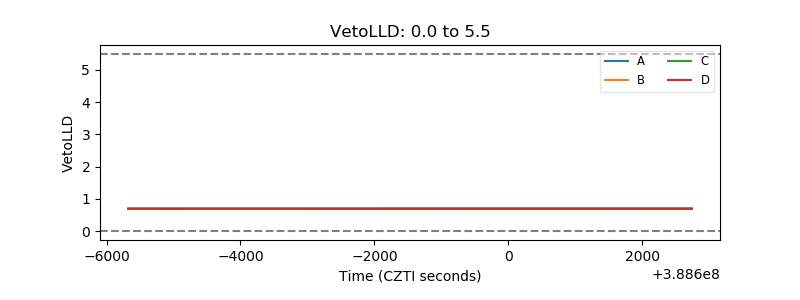 |
| Alpha Counter | 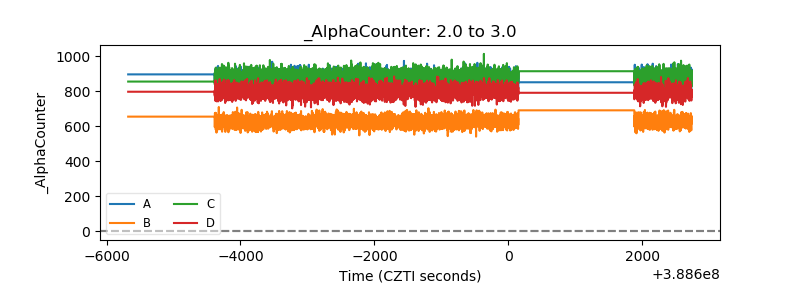 |
| _CPM_Rate | 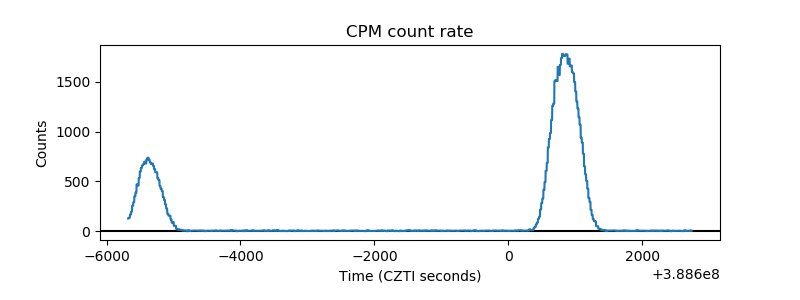 |
| CZT Counter | 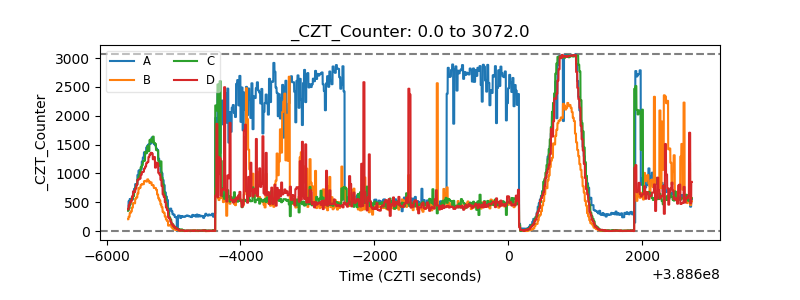 |
| +2.5 Volts monitor | 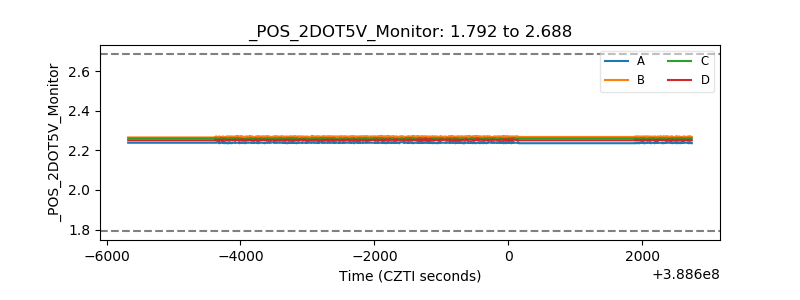 |
| +5 Volts monitor | 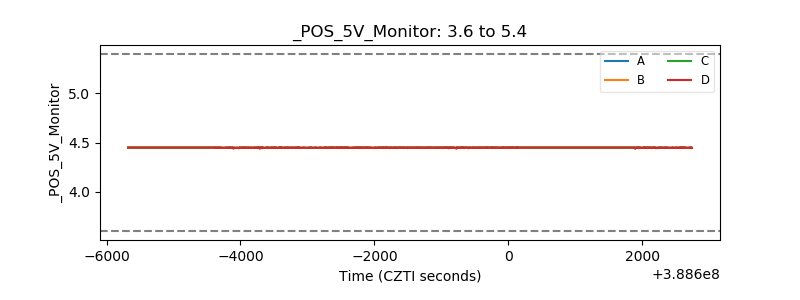 |
| _ROLL_ROT | 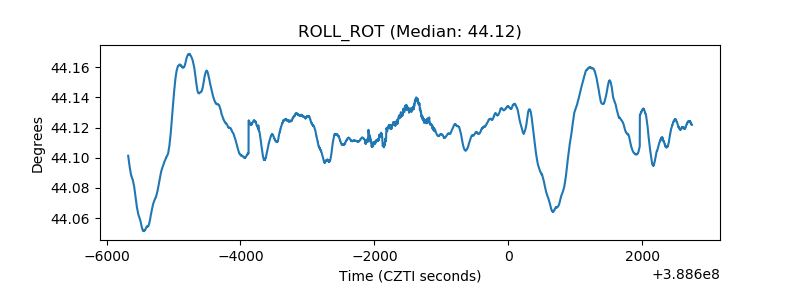 |
| _Roll_DEC |  |
| _Roll_RA | 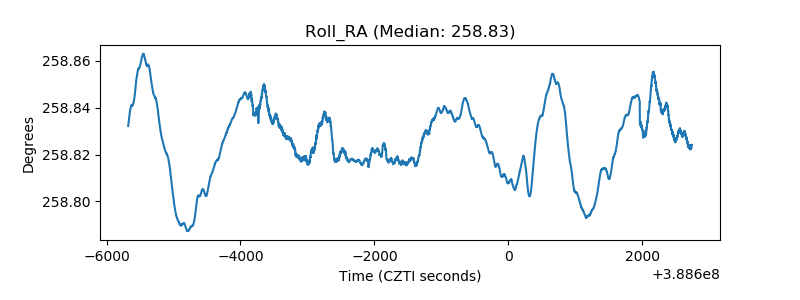 |
| Veto Counter | 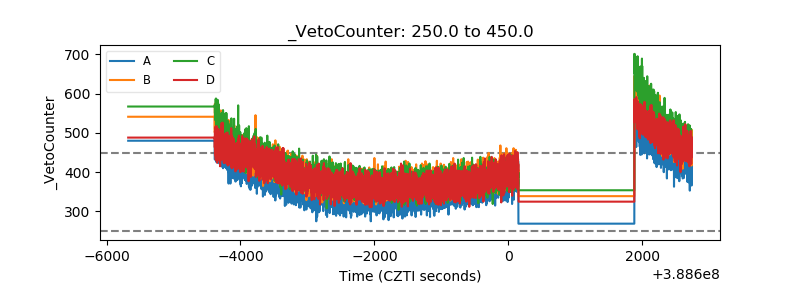 |