| Param | Original file | Final file |
|---|---|---|
| Filename | modeM0/AS1A11_093T01_9000005090_35546cztM0_level2.evt | modeM0/AS1A11_093T01_9000005090_35546cztM0_level2_quad_clean.evt |
| Size (bytes) | 720,276,480 | 114,984,000 |
| Size | 686.9 MB | 109.7 MB |
| Events in quadrant A | 8,226,573 | 686,039 |
| Events in quadrant B | 4,095,152 | 753,829 |
| Events in quadrant C | 4,315,397 | 768,113 |
| Events in quadrant D | 4,643,264 | 726,352 |
| Mode SS | |||
|---|---|---|---|
| Quadrant | BADHDUFLAG | Total packets | Discarded packets |
| A | 0 | 162 | 0 |
| B | 0 | 162 | 0 |
| C | 0 | 162 | 0 |
| D | 0 | 162 | 0 |
| Mode M0 | |||
|---|---|---|---|
| Quadrant | BADHDUFLAG | Total packets | Discarded packets |
| A | 0 | 29795 | 3 |
| B | 0 | 17373 | 2 |
| C | 0 | 17328 | 2 |
| D | 0 | 18867 | 2 |
| Mode M9 | |||
|---|---|---|---|
| Quadrant | BADHDUFLAG | Total packets | Discarded packets |
| A | 0 | 30 | 0 |
| B | 0 | 30 | 0 |
| C | 0 | 30 | 0 |
| D | 0 | 30 | 0 |
| Quadrant | Total seconds | Saturated seconds | Saturation percentage |
|---|---|---|---|
| A | 7876 | 1711 | 21.724225% |
| B | 7876 | 136 | 1.726765% |
| C | 7876 | 105 | 1.333164% |
| D | 7876 | 213 | 2.704418% |
Noise dominated data is calculated using 1-second bins in cleaned event files. If a bin has >2000 counts, and if more than 50% of those come from <1% of pixels, then it is considered to be noise-dominated and hence unusable.
| Quadrant | # 1 sec bins | Bins with >0 counts | Bins with >2000 counts | High rate bins dominated by noise | Noise dominated (total time) | Noise dominated (detector-on time) | Marked lightcurve |
|---|---|---|---|---|---|---|---|
| A | 10922 | 7878 | 1520 | 1520 | 13.92% | 19.29% | 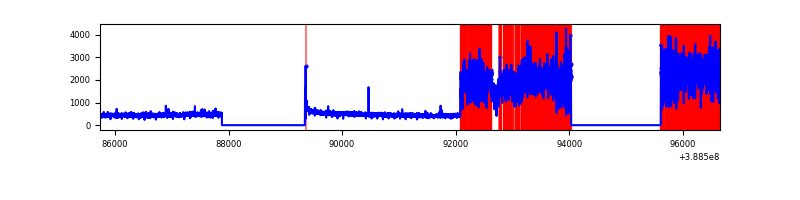 |
| B | 10922 | 7878 | 91 | 91 | 0.83% | 1.16% | 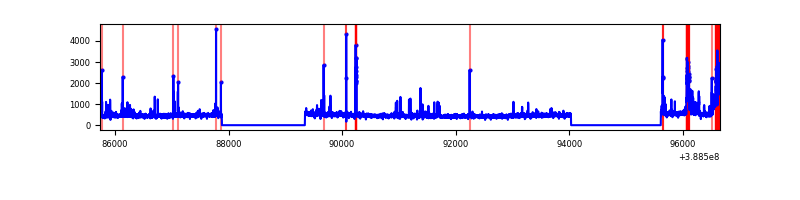 |
| C | 10922 | 7878 | 70 | 70 | 0.64% | 0.89% | 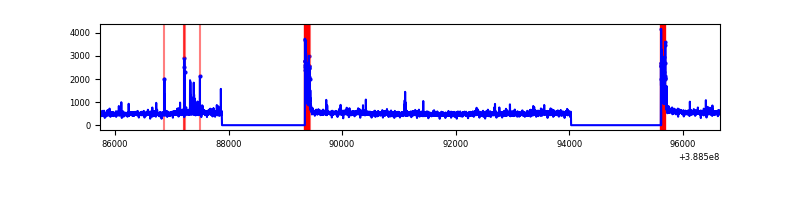 |
| D | 10922 | 7878 | 137 | 137 | 1.25% | 1.74% | 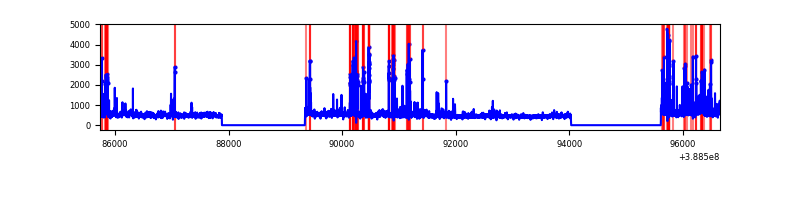 |
Top three noisy pixels from each quadrant. If the there are fewer than three noisy pixels in the level2.evt file, extra rows are filled as -1
| Pixel properties | Quadrant properties | ||||||
|---|---|---|---|---|---|---|---|
| Quadrant | DetID | PixID | Counts | Sigma | Mean | Median | Sigma |
| A | 15 | 169 | 4791405 | 28208.62 | 840 | 826 | 169.8 |
| A | 10 | 83 | 156337 | 915.7 | 840 | 826 | 169.8 |
| A | 13 | 6 | 16699 | 93.47 | 840 | 826 | 169.8 |
| B | 5 | 172 | 348752 | 1995.22 | 901 | 873 | 174.4 |
| B | 5 | 200 | 106341 | 604.9 | 901 | 873 | 174.4 |
| B | 4 | 81 | 31215 | 174.02 | 901 | 873 | 174.4 |
| C | 0 | 10 | 357064 | 1729.59 | 888 | 894 | 205.9 |
| C | 15 | 214 | 345413 | 1673.01 | 888 | 894 | 205.9 |
| C | 0 | 239 | 77995 | 374.41 | 888 | 894 | 205.9 |
| D | 10 | 118 | 390082 | 1834.5 | 877 | 854 | 212.2 |
| D | 8 | 195 | 311092 | 1462.21 | 877 | 854 | 212.2 |
| D | 2 | 250 | 275618 | 1295.01 | 877 | 854 | 212.2 |
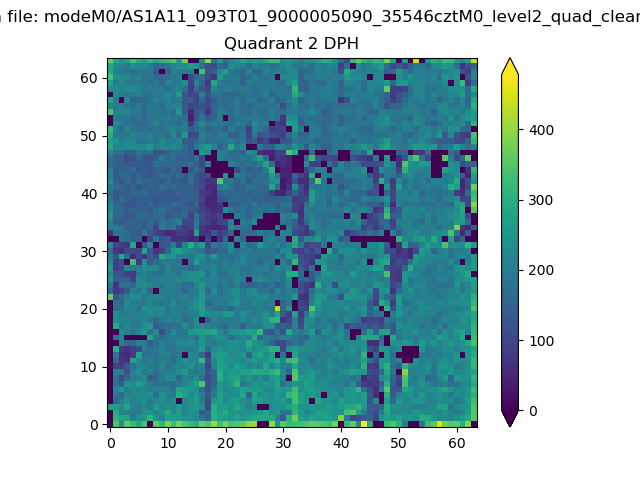
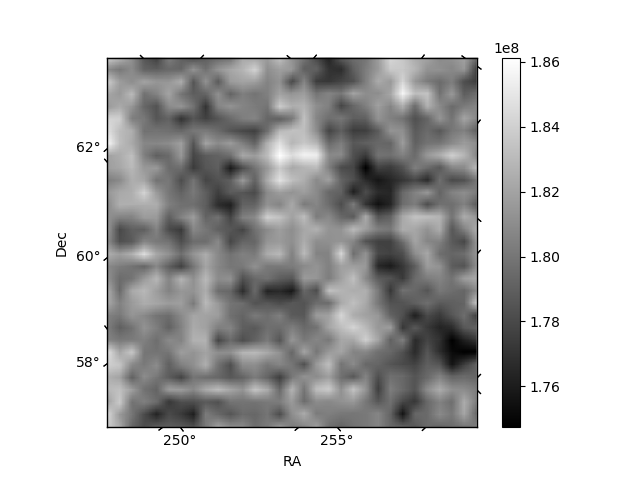
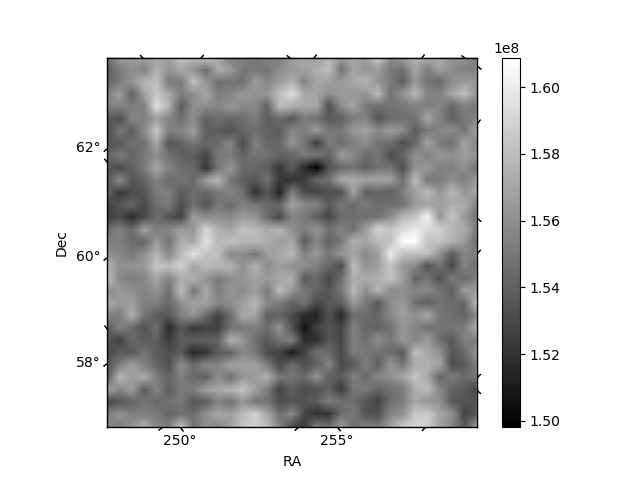
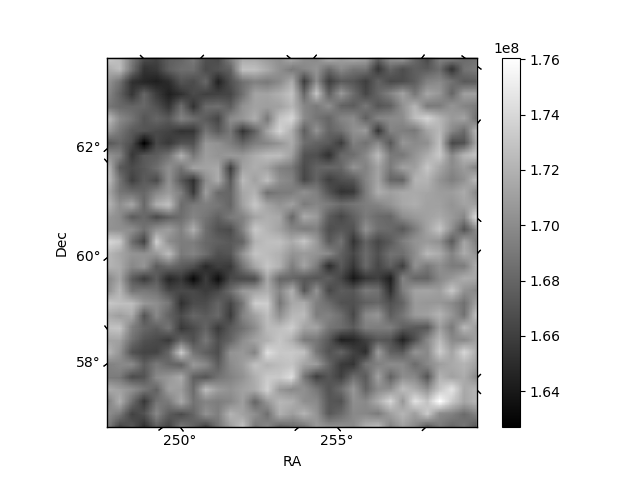
Histogram calculated using DETX and DETY for each event in the final _common_clean file
| Quadrant A | 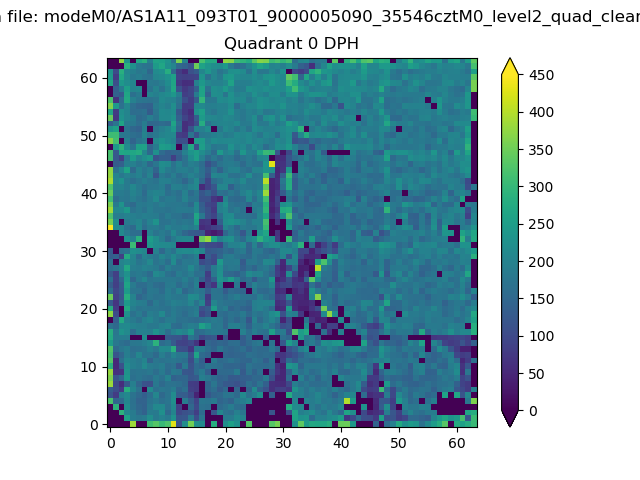 |
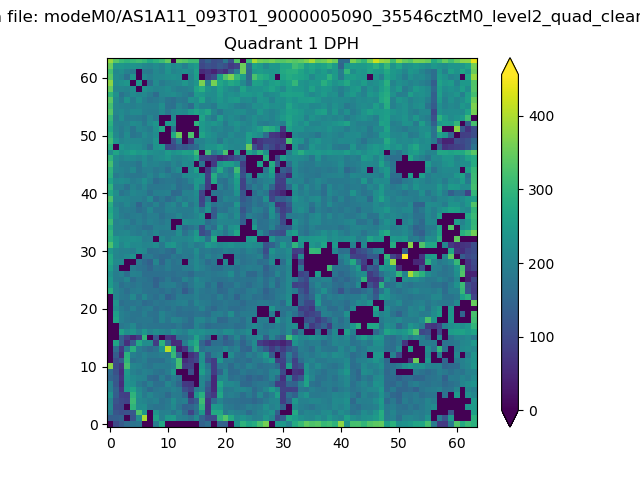 |
Quadrant B |
|---|---|---|---|
| Quadrant D | 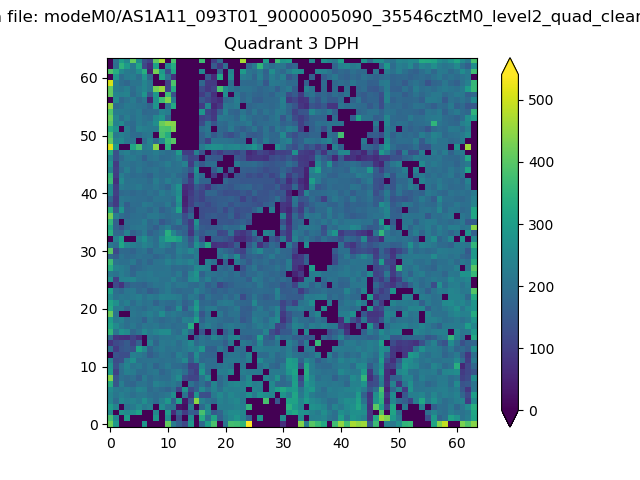 |
 |
Quadrant C |
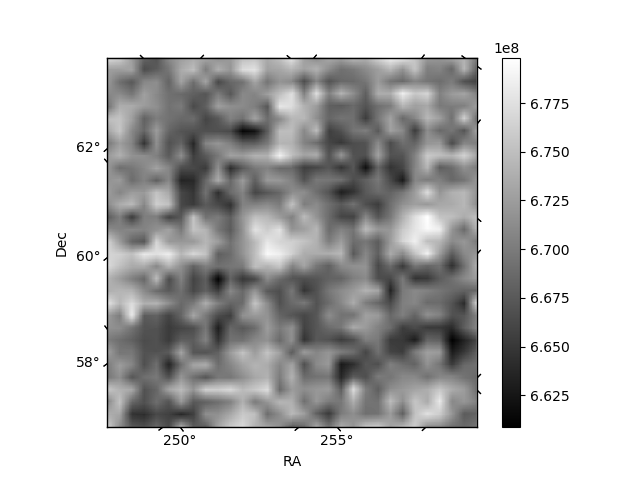
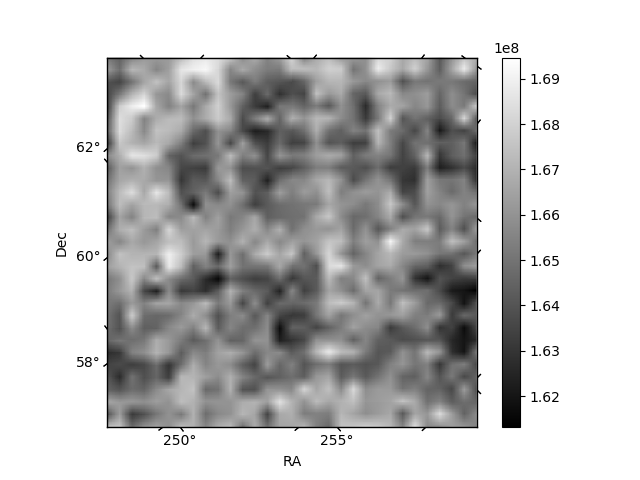
| Plot type | Count rate plots | Images |
|---|---|---|
| Comparison with Poisson distribution Blue bars denote a histogram of data divided into 1 sec bins. Red curve is a Poisson curve with rate = median count rate of data. |
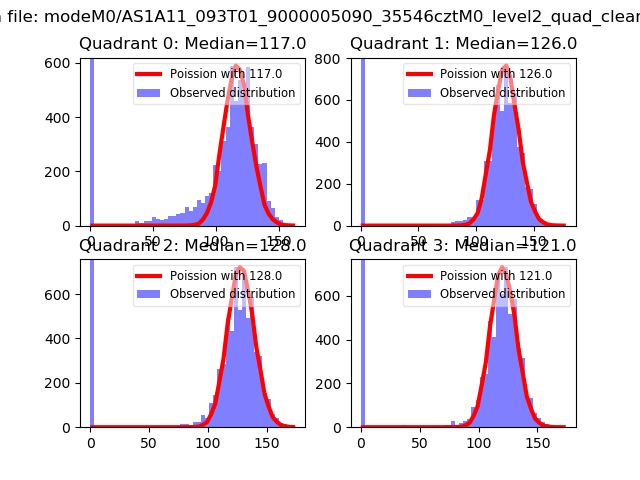 |
 |
| Quadrant-wise count rates Data is divided into 100 sec bins |
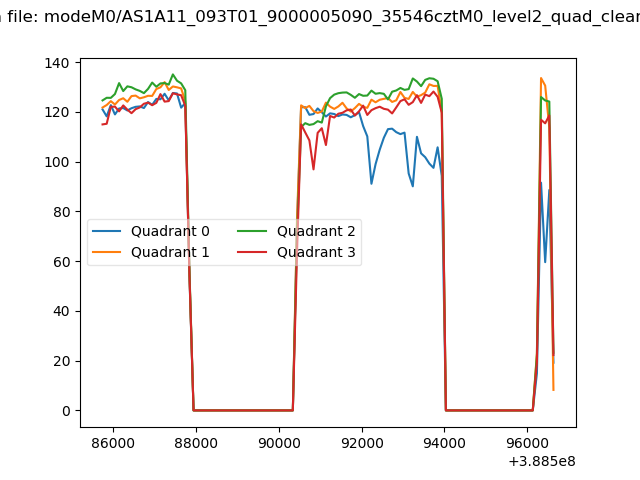 |
|
| Module-wise count rates for Quadrant A Data is divided into 100 sec bins |
 |
 |
| Module-wise count rates for Quadrant B Data is divided into 100 sec bins |
 |
 |
| Module-wise count rates for Quadrant C Data is divided into 100 sec bins |
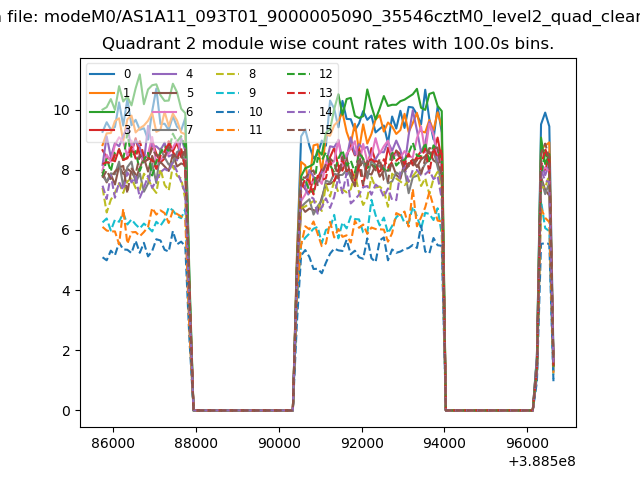 |
 |
| Module-wise count rates for Quadrant D Data is divided into 100 sec bins |
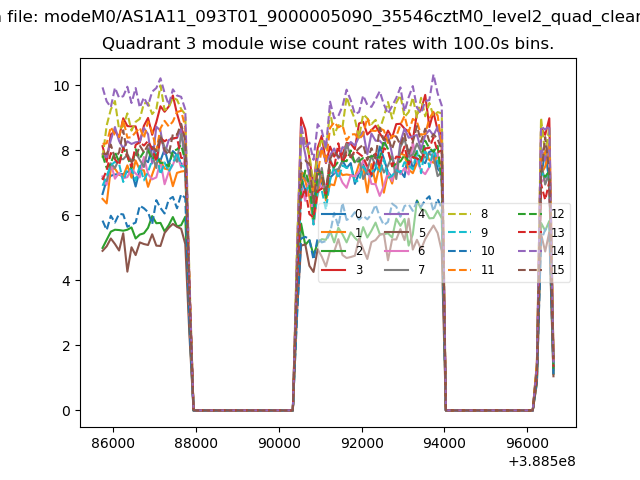 |
 |
| Parameter | Plot |
|---|---|
| CZT HV Monitor | 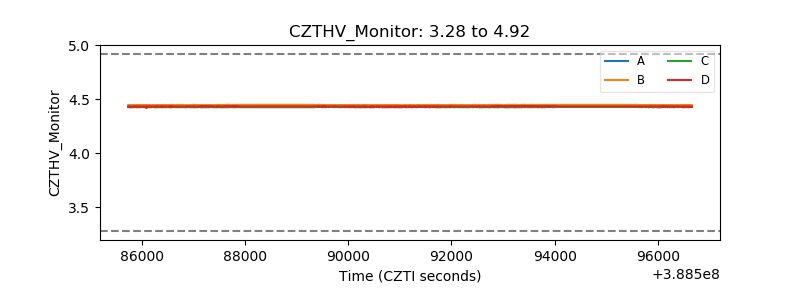 |
| D_VDD | 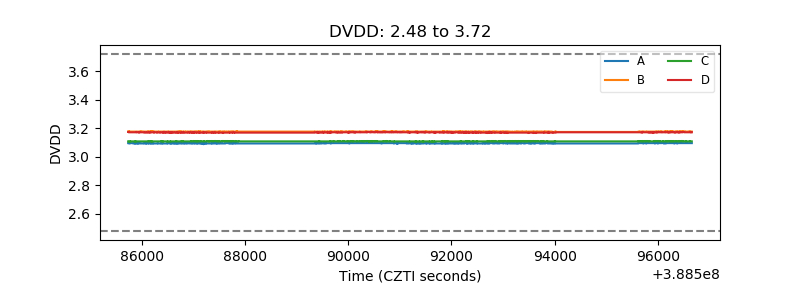 |
| Temperature 1 | 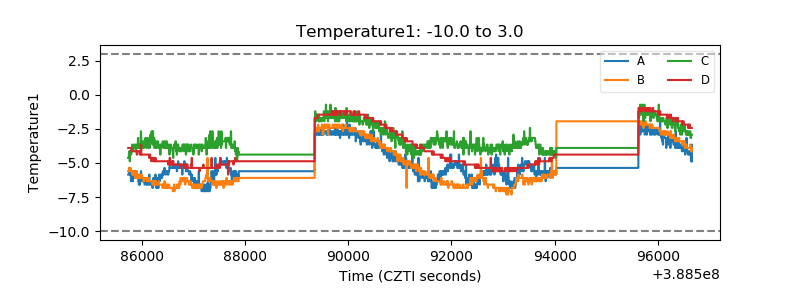 |
| Veto HV Monitor | 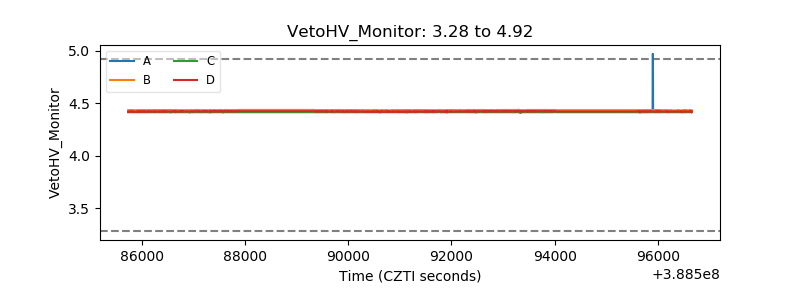 |
| Veto LLD | 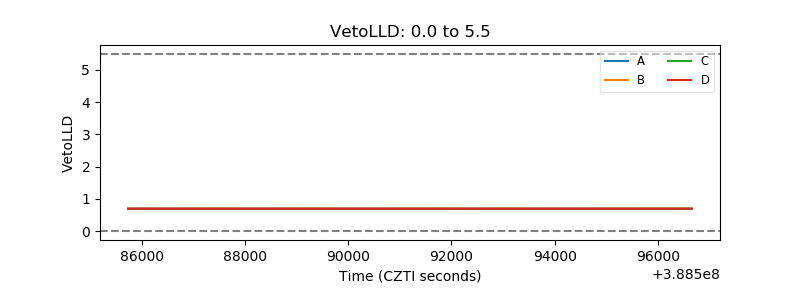 |
| Alpha Counter | 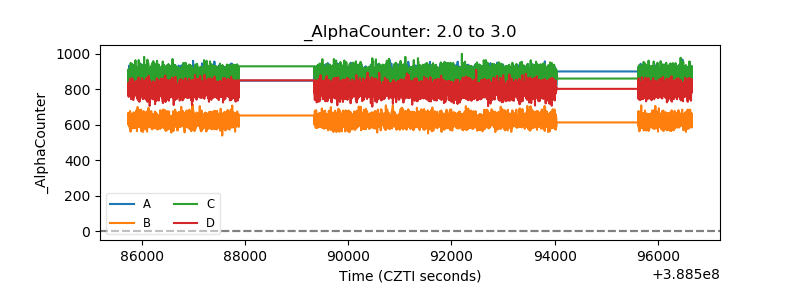 |
| _CPM_Rate | 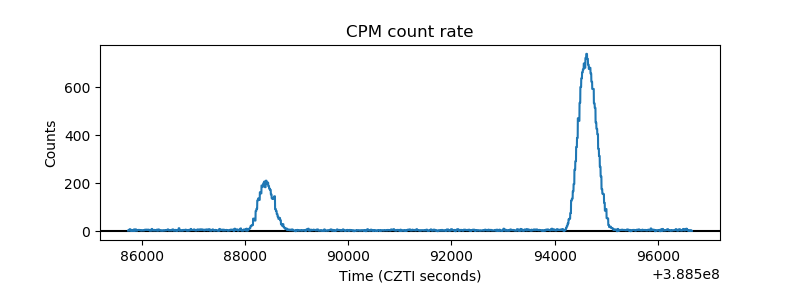 |
| CZT Counter | 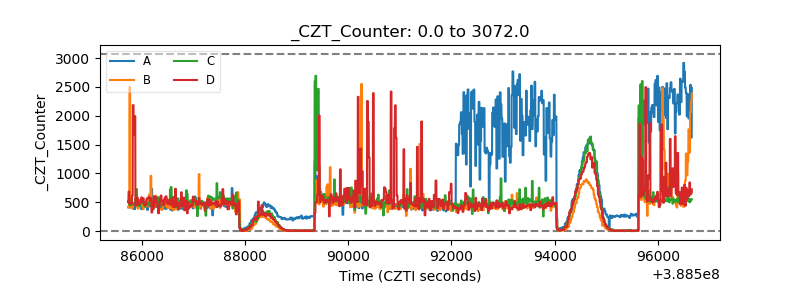 |
| +2.5 Volts monitor | 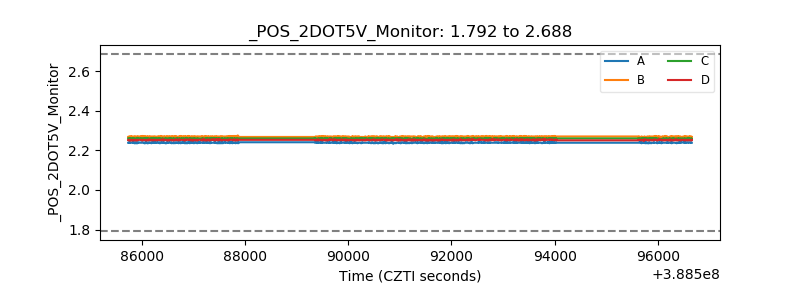 |
| +5 Volts monitor | 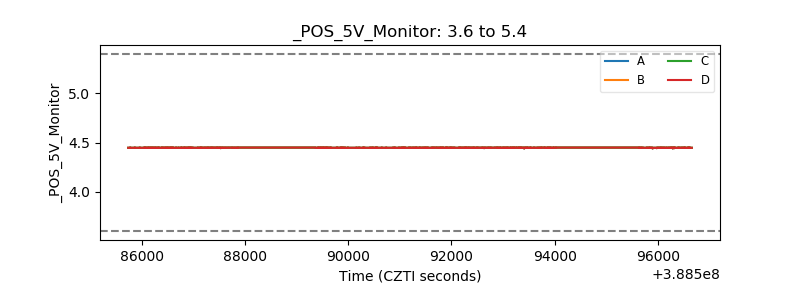 |
| _ROLL_ROT | 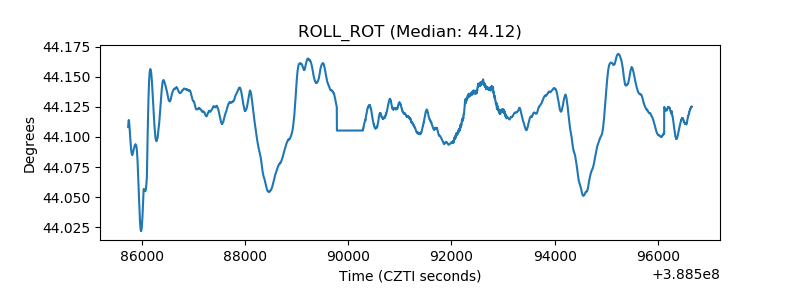 |
| _Roll_DEC | 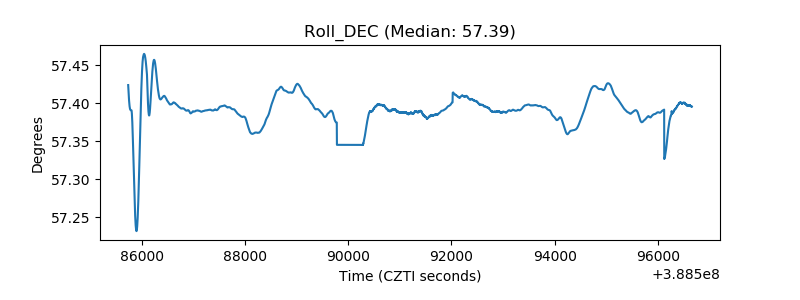 |
| _Roll_RA | 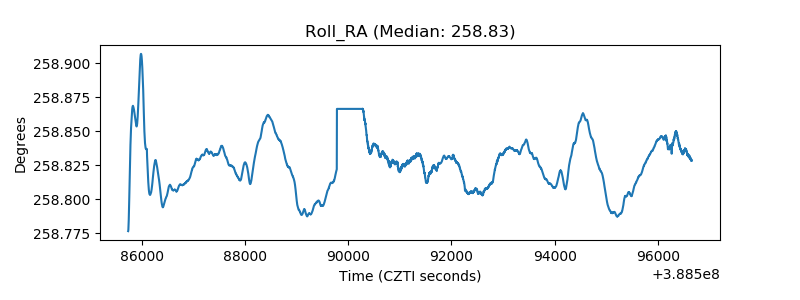 |
| Veto Counter | 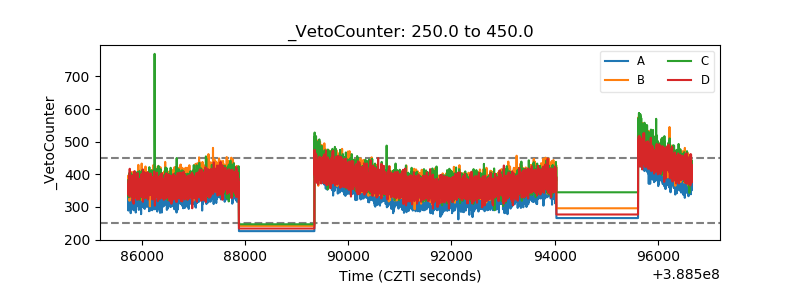 |