| Param | Original file | Final file |
|---|---|---|
| Filename | modeM0/AS1A11_046T08_9000005088_35545cztM0_level2.evt | modeM0/AS1A11_046T08_9000005088_35545cztM0_level2_quad_clean.evt |
| Size (bytes) | 530,449,920 | 94,377,600 |
| Size | 505.9 MB | 90.0 MB |
| Events in quadrant A | 3,442,556 | 586,930 |
| Events in quadrant B | 3,680,997 | 597,139 |
| Events in quadrant C | 3,780,769 | 599,927 |
| Events in quadrant D | 4,661,836 | 562,507 |
| Mode M0 | |||
|---|---|---|---|
| Quadrant | BADHDUFLAG | Total packets | Discarded packets |
| A | 0 | 14964 | 2 |
| B | 0 | 15754 | 2 |
| C | 0 | 15373 | 2 |
| D | 0 | 18540 | 2 |
| Mode SS | |||
|---|---|---|---|
| Quadrant | BADHDUFLAG | Total packets | Discarded packets |
| A | 0 | 150 | 0 |
| B | 0 | 150 | 0 |
| C | 0 | 150 | 0 |
| D | 0 | 150 | 0 |
| Mode M9 | |||
|---|---|---|---|
| Quadrant | BADHDUFLAG | Total packets | Discarded packets |
| A | 0 | 27 | 0 |
| B | 0 | 27 | 0 |
| C | 0 | 27 | 0 |
| D | 0 | 27 | 0 |
| Quadrant | Total seconds | Saturated seconds | Saturation percentage |
|---|---|---|---|
| A | 7350 | 8 | 0.108844% |
| B | 7350 | 79 | 1.074830% |
| C | 7350 | 23 | 0.312925% |
| D | 7350 | 221 | 3.006803% |
Noise dominated data is calculated using 1-second bins in cleaned event files. If a bin has >2000 counts, and if more than 50% of those come from <1% of pixels, then it is considered to be noise-dominated and hence unusable.
| Quadrant | # 1 sec bins | Bins with >0 counts | Bins with >2000 counts | High rate bins dominated by noise | Noise dominated (total time) | Noise dominated (detector-on time) | Marked lightcurve |
|---|---|---|---|---|---|---|---|
| A | 10038 | 7352 | 0 | 0 | 0.00% | 0.00% | 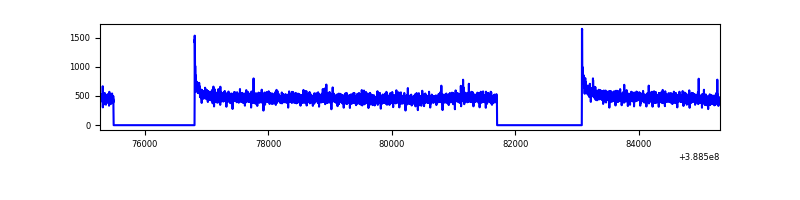 |
| B | 10038 | 7352 | 40 | 40 | 0.40% | 0.54% | 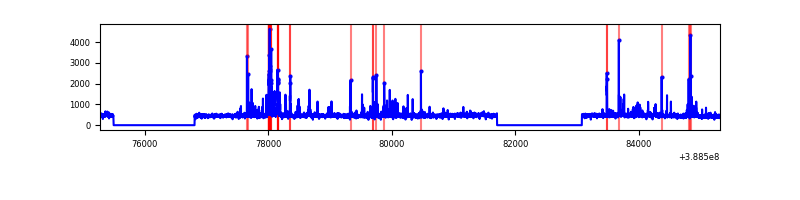 |
| C | 10038 | 7352 | 16 | 16 | 0.16% | 0.22% | 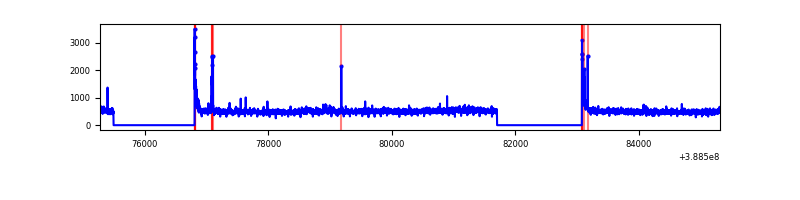 |
| D | 10038 | 7352 | 159 | 159 | 1.58% | 2.16% | 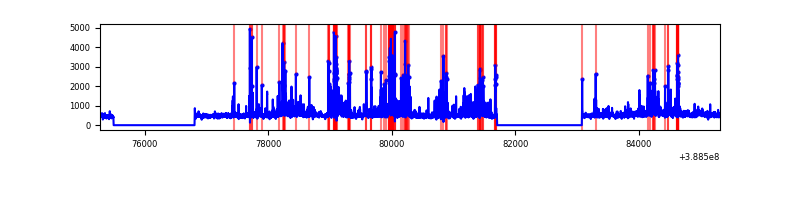 |
Top three noisy pixels from each quadrant. If the there are fewer than three noisy pixels in the level2.evt file, extra rows are filled as -1
| Pixel properties | Quadrant properties | ||||||
|---|---|---|---|---|---|---|---|
| Quadrant | DetID | PixID | Counts | Sigma | Mean | Median | Sigma |
| A | 10 | 83 | 172089 | 1011.57 | 837 | 818 | 169.3 |
| A | 13 | 6 | 19805 | 112.14 | 837 | 818 | 169.3 |
| A | 15 | 169 | 15617 | 87.41 | 837 | 818 | 169.3 |
| B | 5 | 172 | 356307 | 2215.47 | 830 | 807 | 160.5 |
| B | 12 | 111 | 20016 | 119.71 | 830 | 807 | 160.5 |
| B | 11 | 111 | 17637 | 104.88 | 830 | 807 | 160.5 |
| C | 15 | 214 | 328755 | 1741.85 | 818 | 825 | 188.3 |
| C | 0 | 10 | 185643 | 981.69 | 818 | 825 | 188.3 |
| C | 14 | 67 | 56803 | 297.34 | 818 | 825 | 188.3 |
| D | 10 | 118 | 305077 | 1528.78 | 809 | 784 | 199.0 |
| D | 8 | 195 | 291795 | 1462.05 | 809 | 784 | 199.0 |
| D | 2 | 250 | 202808 | 1014.98 | 809 | 784 | 199.0 |
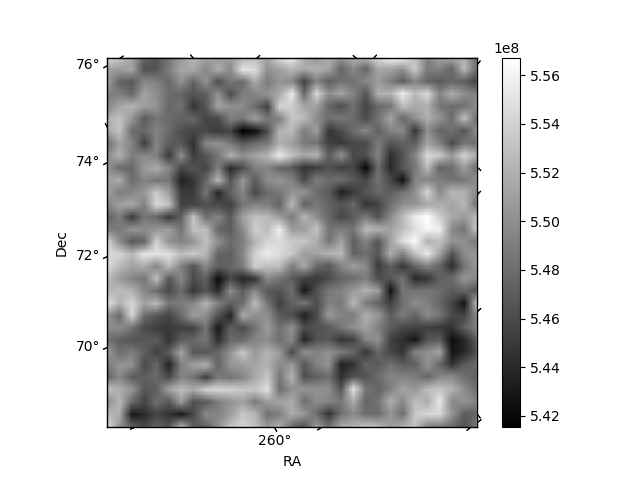
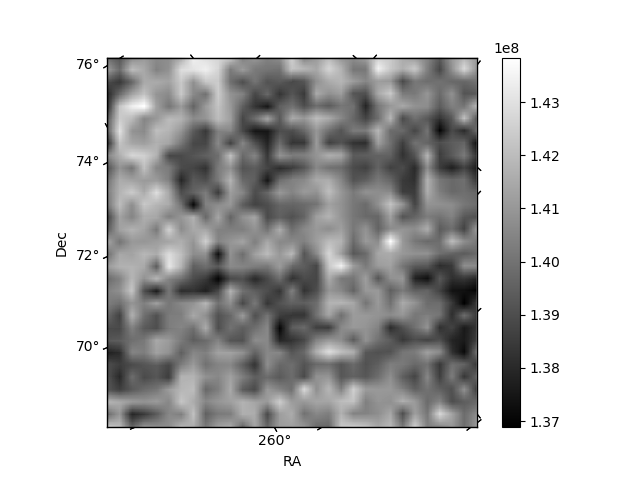
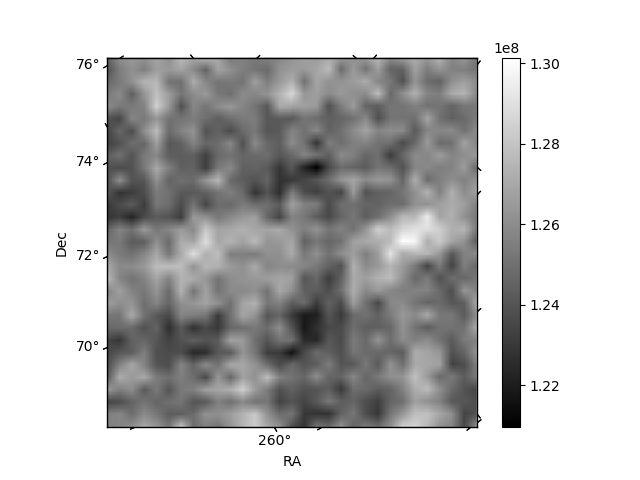
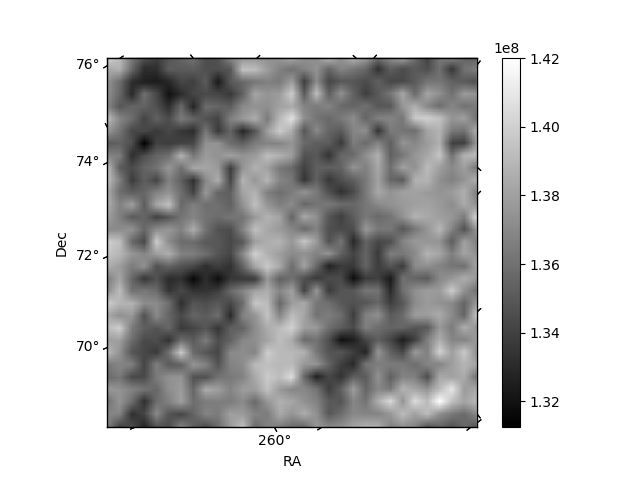
Histogram calculated using DETX and DETY for each event in the final _common_clean file
| Quadrant A | 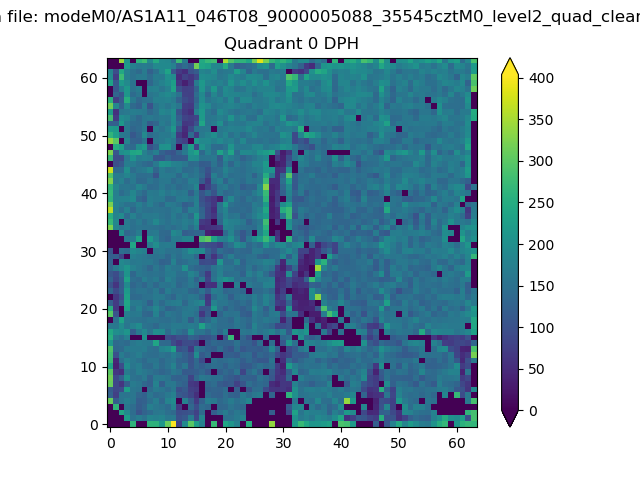 |
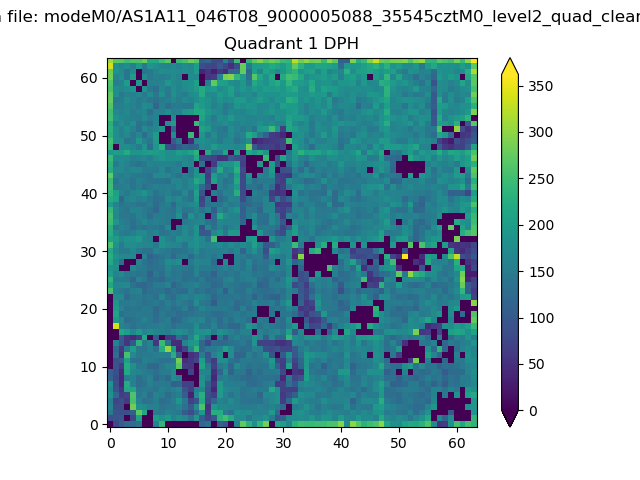 |
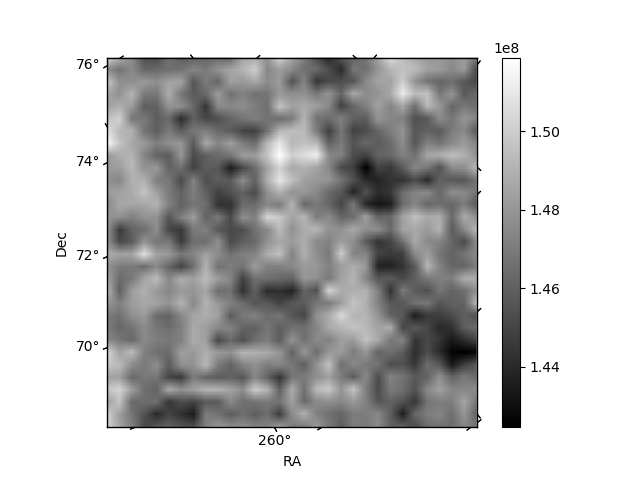
Quadrant B |
|---|---|---|---|
| Quadrant D | 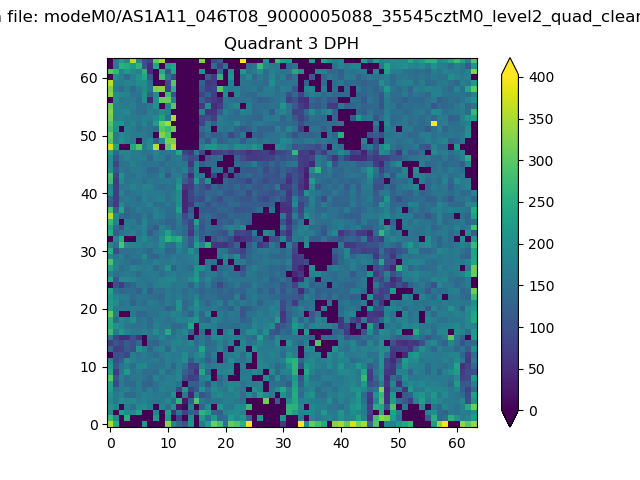 |
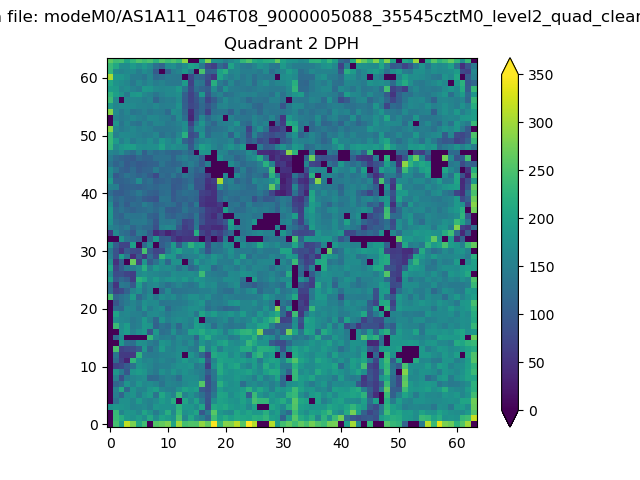 |
Quadrant C |
| Plot type | Count rate plots | Images |
|---|---|---|
| Comparison with Poisson distribution Blue bars denote a histogram of data divided into 1 sec bins. Red curve is a Poisson curve with rate = median count rate of data. |
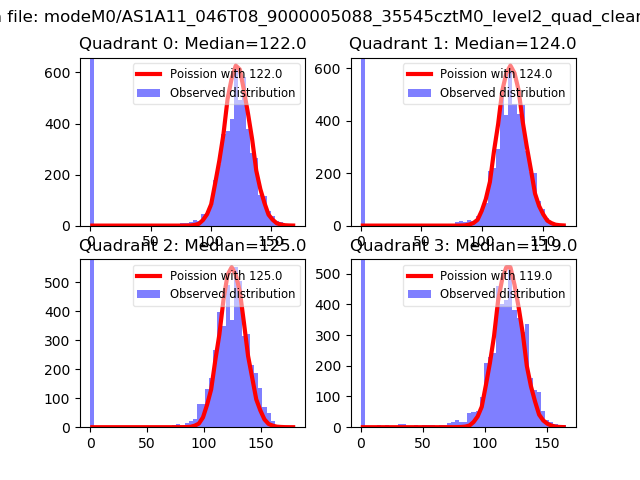 |
 |
| Quadrant-wise count rates Data is divided into 100 sec bins |
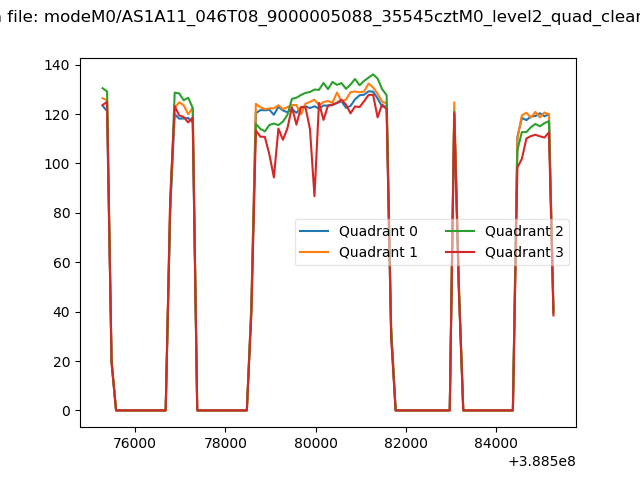 |
|
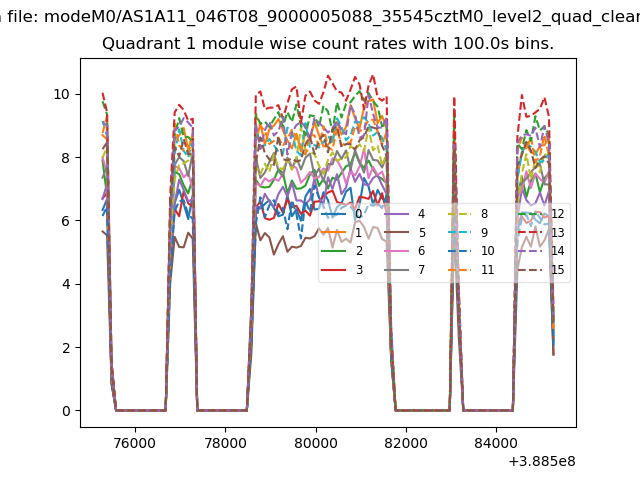
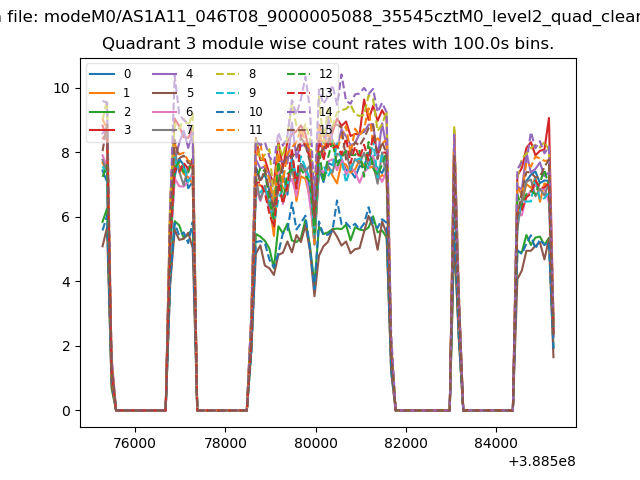
| Module-wise count rates for Quadrant A Data is divided into 100 sec bins |
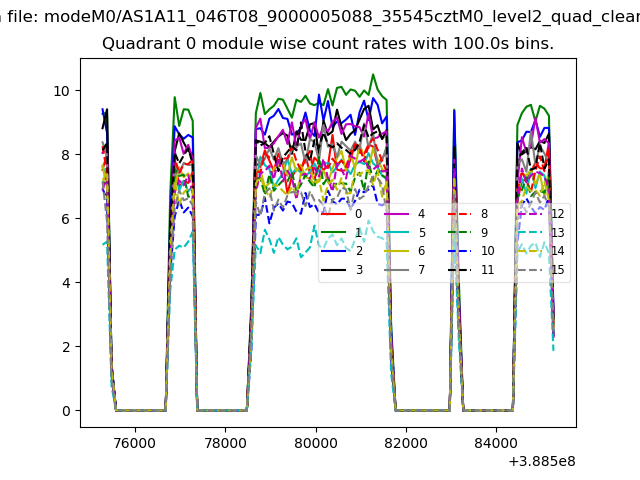 |
 |
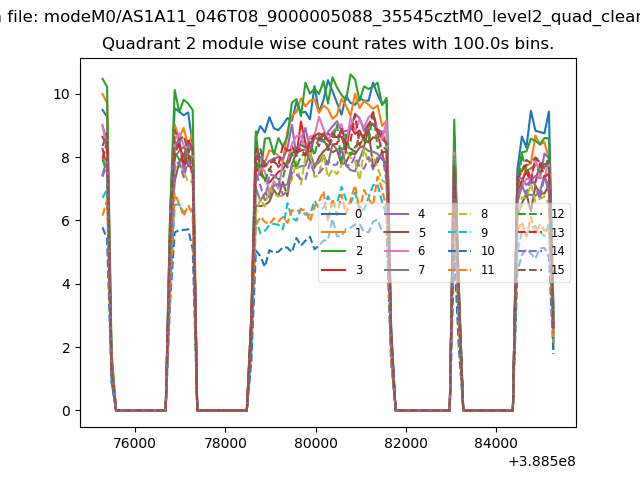
| Module-wise count rates for Quadrant B Data is divided into 100 sec bins |
 |
 |
| Module-wise count rates for Quadrant C Data is divided into 100 sec bins |
 |
 |
| Module-wise count rates for Quadrant D Data is divided into 100 sec bins |
 |
 |
| Parameter | Plot |
|---|---|
| CZT HV Monitor | 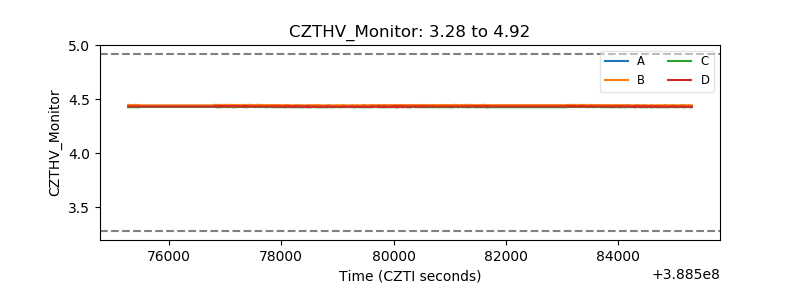 |
| D_VDD | 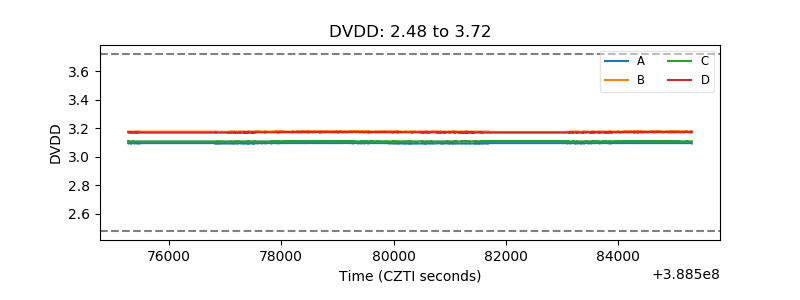 |
| Temperature 1 | 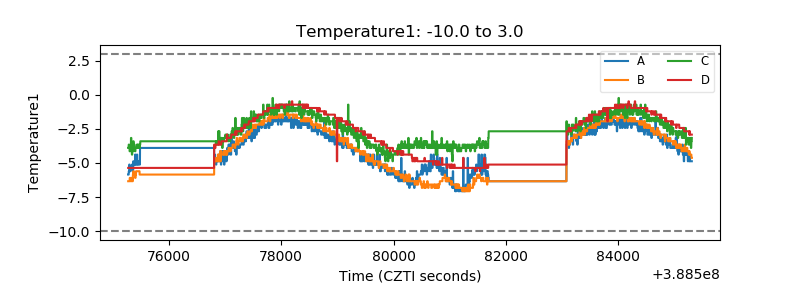 |
| Veto HV Monitor | 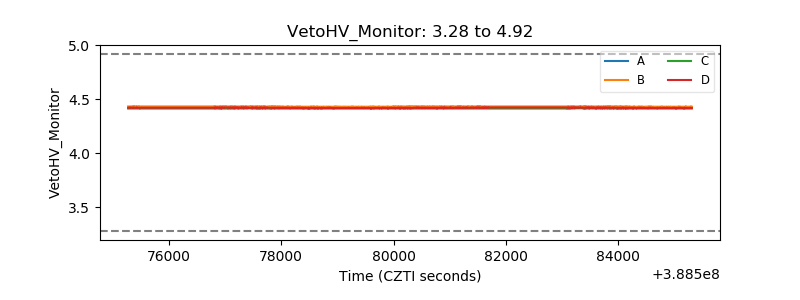 |
| Veto LLD | 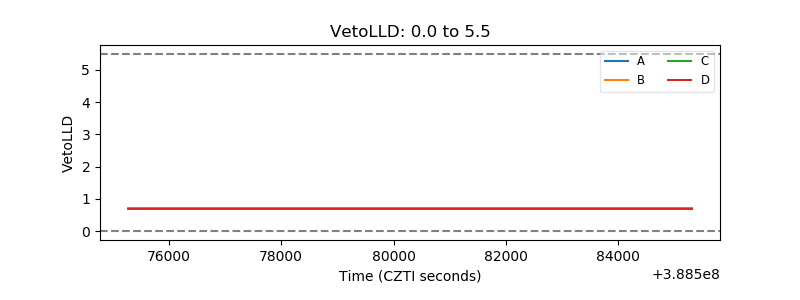 |
| Alpha Counter | 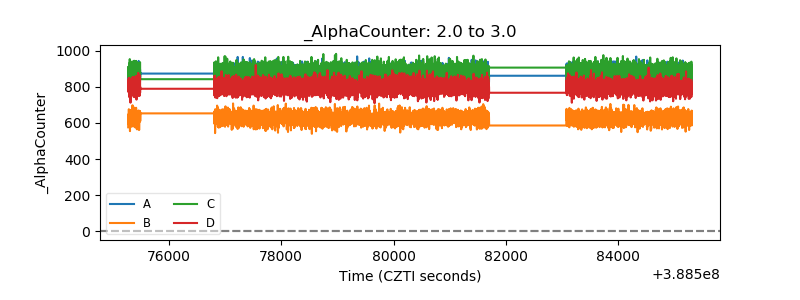 |
| _CPM_Rate | 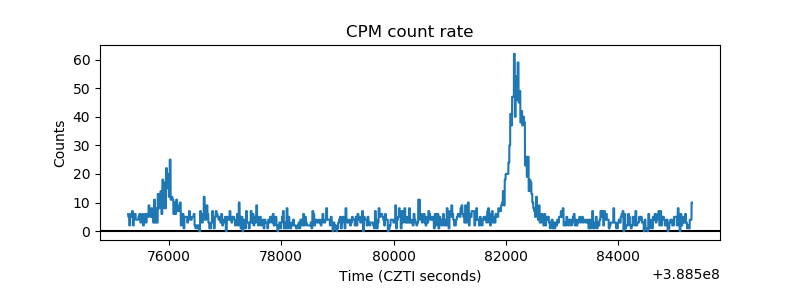 |
| CZT Counter | 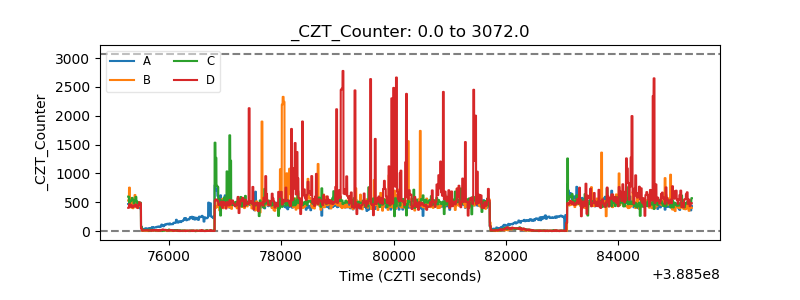 |
| +2.5 Volts monitor | 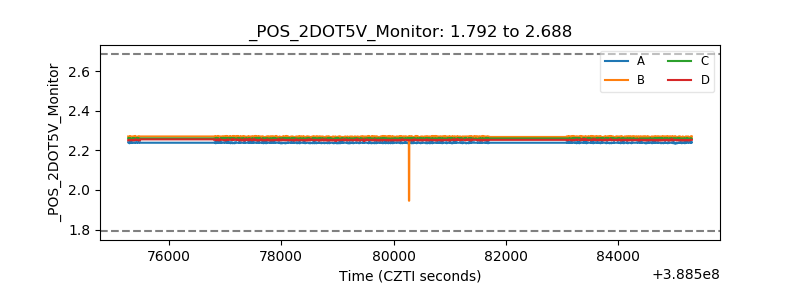 |
| +5 Volts monitor | 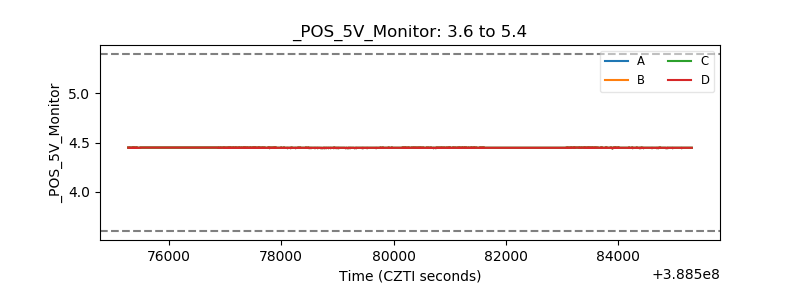 |
| _ROLL_ROT | 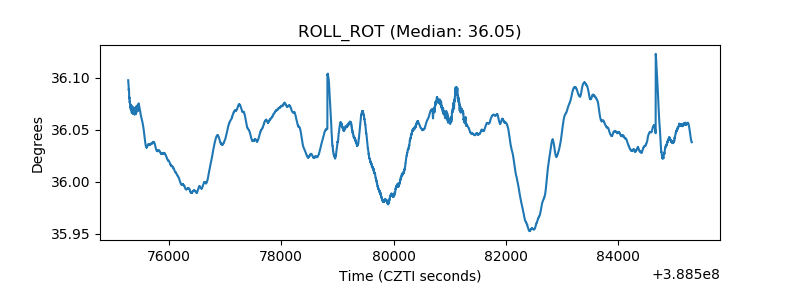 |
| _Roll_DEC | 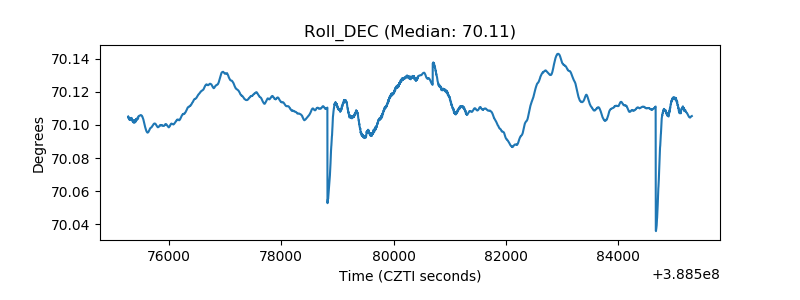 |
| _Roll_RA | 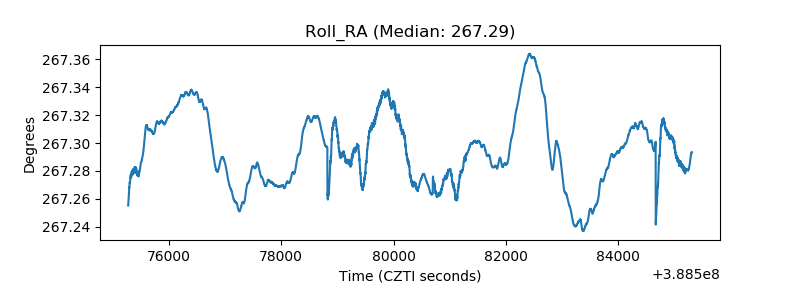 |
| Veto Counter | 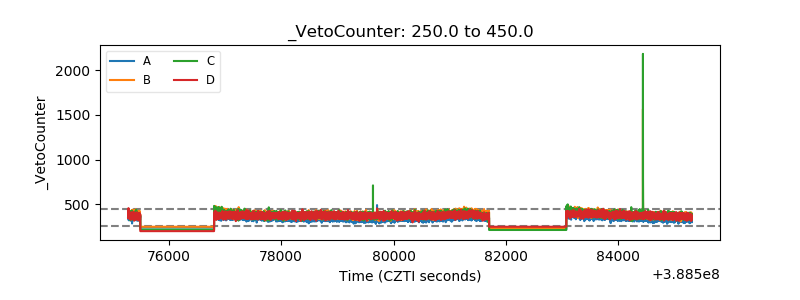 |