| Param | Original file | Final file |
|---|---|---|
| Filename | modeM0/AS1A11_046T08_9000005088_35543cztM0_level2.evt | modeM0/AS1A11_046T08_9000005088_35543cztM0_level2_quad_clean.evt |
| Size (bytes) | 341,513,280 | 64,051,200 |
| Size | 325.7 MB | 61.1 MB |
| Events in quadrant A | 2,247,005 | 401,505 |
| Events in quadrant B | 2,585,264 | 407,196 |
| Events in quadrant C | 2,592,148 | 415,783 |
| Events in quadrant D | 2,609,844 | 396,401 |
| Mode M0 | |||
|---|---|---|---|
| Quadrant | BADHDUFLAG | Total packets | Discarded packets |
| A | 0 | 9566 | 1 |
| B | 0 | 10584 | 0 |
| C | 0 | 10364 | 0 |
| D | 0 | 10714 | 0 |
| Mode SS | |||
|---|---|---|---|
| Quadrant | BADHDUFLAG | Total packets | Discarded packets |
| A | 0 | 90 | 0 |
| B | 0 | 90 | 0 |
| C | 0 | 90 | 0 |
| D | 0 | 90 | 0 |
| Quadrant | Total seconds | Saturated seconds | Saturation percentage |
|---|---|---|---|
| A | 4531 | 18 | 0.397263% |
| B | 4531 | 70 | 1.544913% |
| C | 4531 | 10 | 0.220702% |
| D | 4531 | 86 | 1.898036% |
Noise dominated data is calculated using 1-second bins in cleaned event files. If a bin has >2000 counts, and if more than 50% of those come from <1% of pixels, then it is considered to be noise-dominated and hence unusable.
| Quadrant | # 1 sec bins | Bins with >0 counts | Bins with >2000 counts | High rate bins dominated by noise | Noise dominated (total time) | Noise dominated (detector-on time) | Marked lightcurve |
|---|---|---|---|---|---|---|---|
| A | 4531 | 4531 | 14 | 14 | 0.31% | 0.31% | 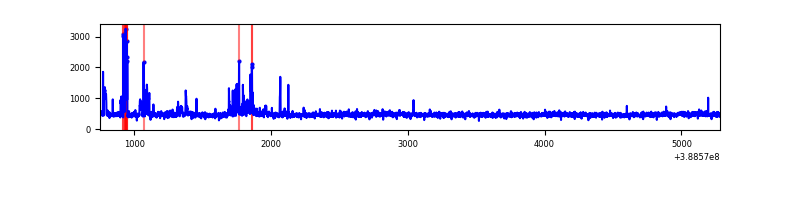 |
| B | 4531 | 4531 | 39 | 39 | 0.86% | 0.86% | 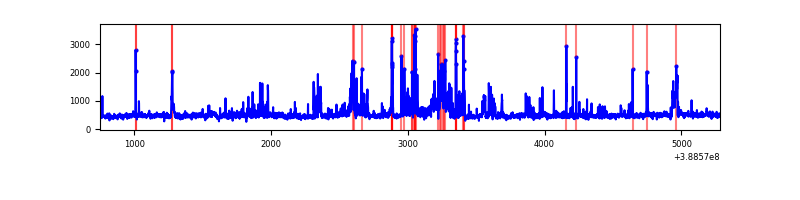 |
| C | 4531 | 4531 | 10 | 10 | 0.22% | 0.22% | 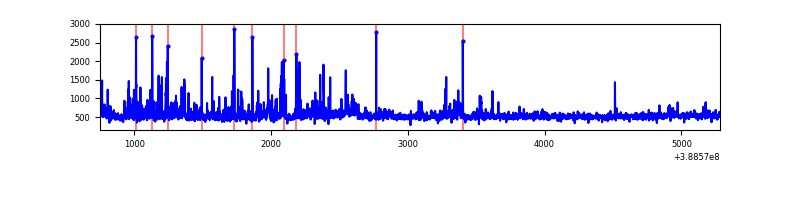 |
| D | 4531 | 4531 | 65 | 65 | 1.43% | 1.43% | 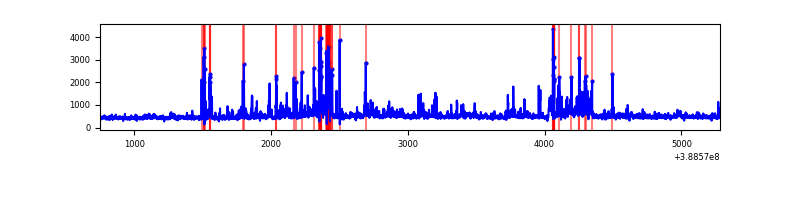 |
Top three noisy pixels from each quadrant. If the there are fewer than three noisy pixels in the level2.evt file, extra rows are filled as -1
| Pixel properties | Quadrant properties | ||||||
|---|---|---|---|---|---|---|---|
| Quadrant | DetID | PixID | Counts | Sigma | Mean | Median | Sigma |
| A | 15 | 169 | 134889 | 1283.46 | 511 | 500 | 104.7 |
| A | 10 | 83 | 65281 | 618.68 | 511 | 500 | 104.7 |
| A | 9 | 143 | 56164 | 531.61 | 511 | 500 | 104.7 |
| B | 5 | 236 | 207463 | 2124.1 | 507 | 495 | 97.4 |
| B | 5 | 172 | 155886 | 1594.77 | 507 | 495 | 97.4 |
| B | 0 | 190 | 81211 | 828.38 | 507 | 495 | 97.4 |
| C | 15 | 214 | 198562 | 1686.22 | 504 | 506 | 117.5 |
| C | 14 | 128 | 188246 | 1598.39 | 504 | 506 | 117.5 |
| C | 0 | 10 | 175493 | 1489.81 | 504 | 506 | 117.5 |
| D | 10 | 118 | 157343 | 1301.17 | 499 | 484 | 120.6 |
| D | 8 | 195 | 117571 | 971.26 | 499 | 484 | 120.6 |
| D | 2 | 250 | 82903 | 683.68 | 499 | 484 | 120.6 |
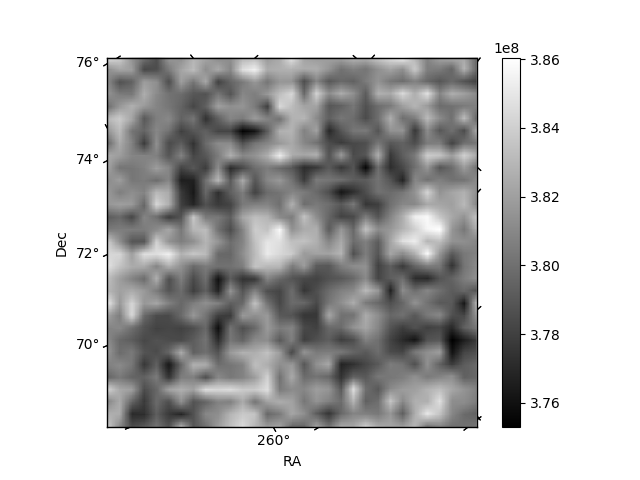
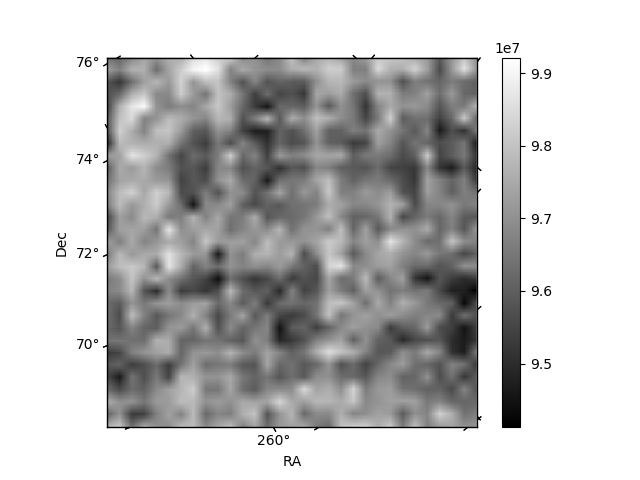
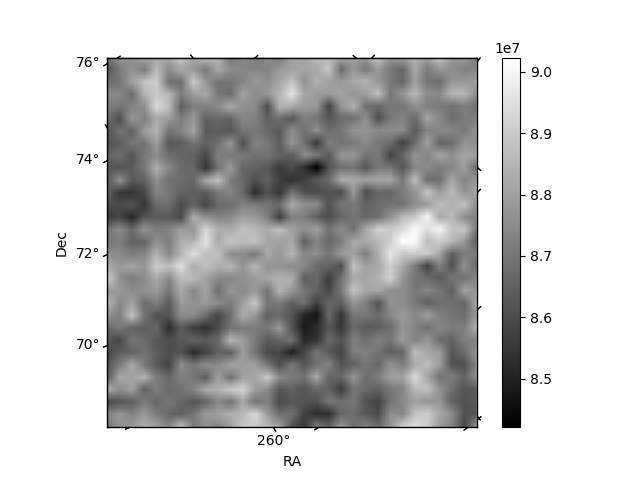
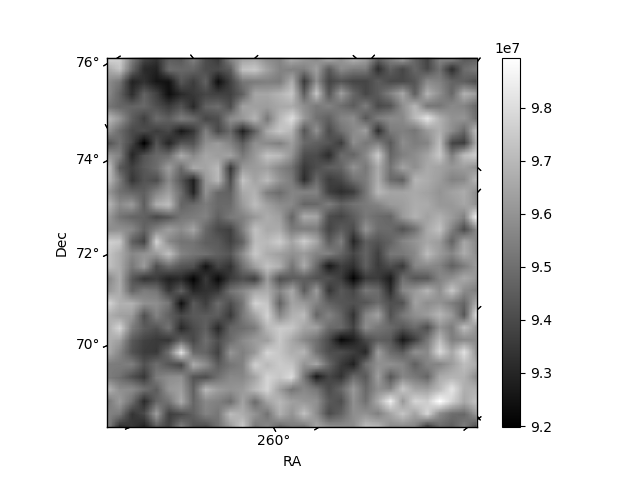
Histogram calculated using DETX and DETY for each event in the final _common_clean file
| Quadrant A | 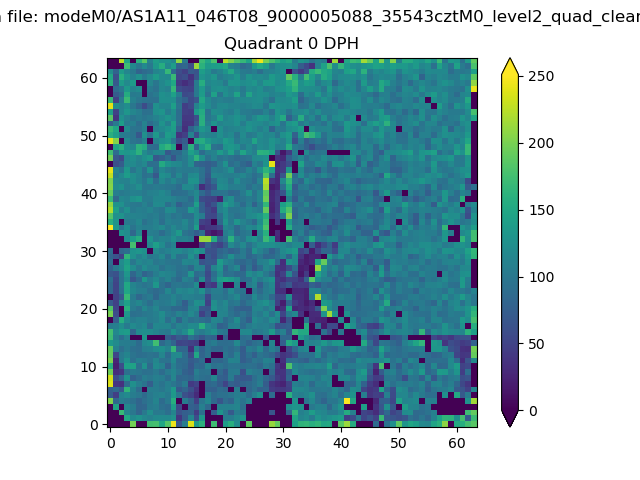 |
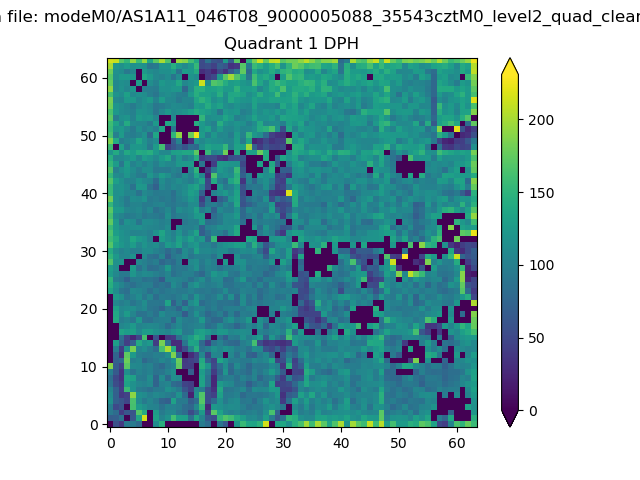 |
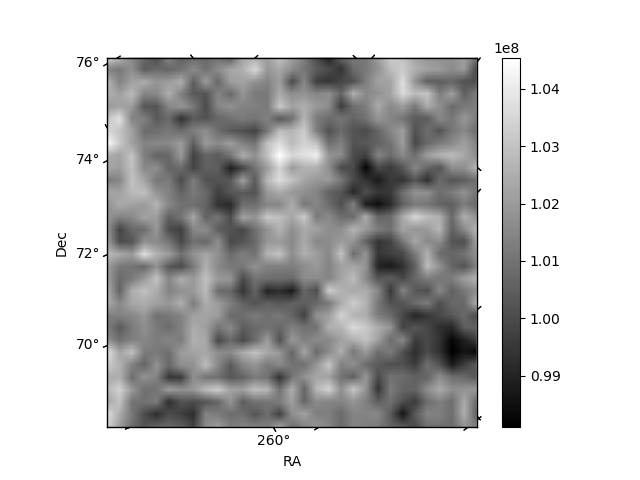
Quadrant B |
|---|---|---|---|
| Quadrant D | 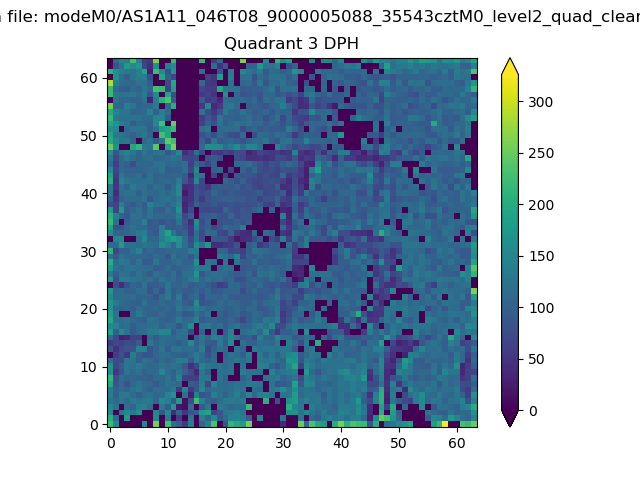 |
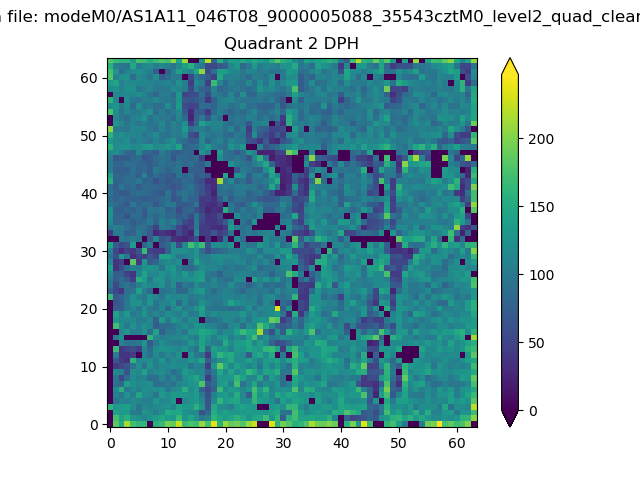 |
Quadrant C |
| Plot type | Count rate plots | Images |
|---|---|---|
| Comparison with Poisson distribution Blue bars denote a histogram of data divided into 1 sec bins. Red curve is a Poisson curve with rate = median count rate of data. |
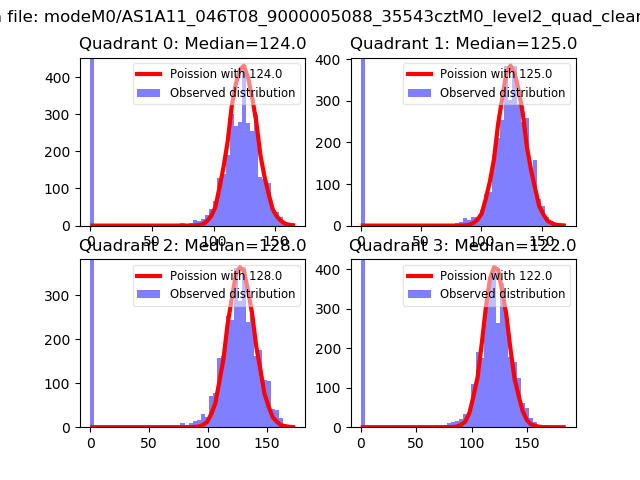 |
 |
| Quadrant-wise count rates Data is divided into 100 sec bins |
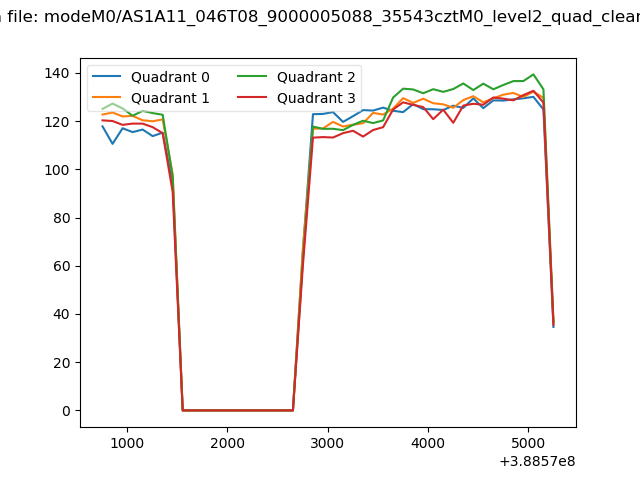 |
|
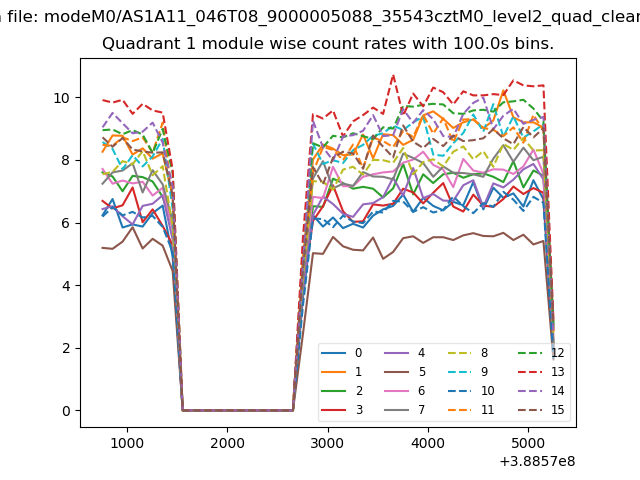
| Module-wise count rates for Quadrant A Data is divided into 100 sec bins |
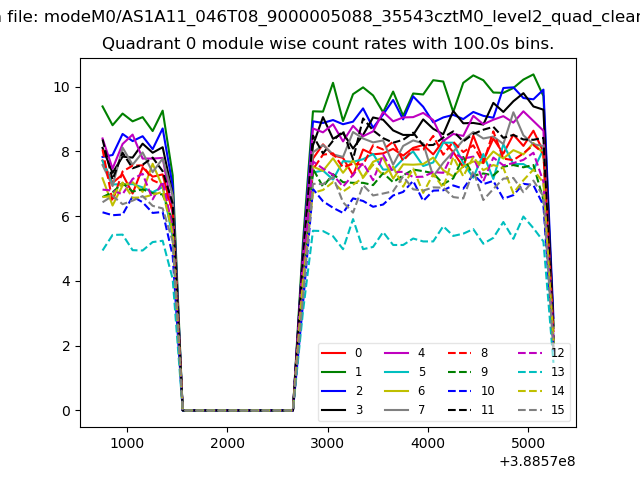 |
 |
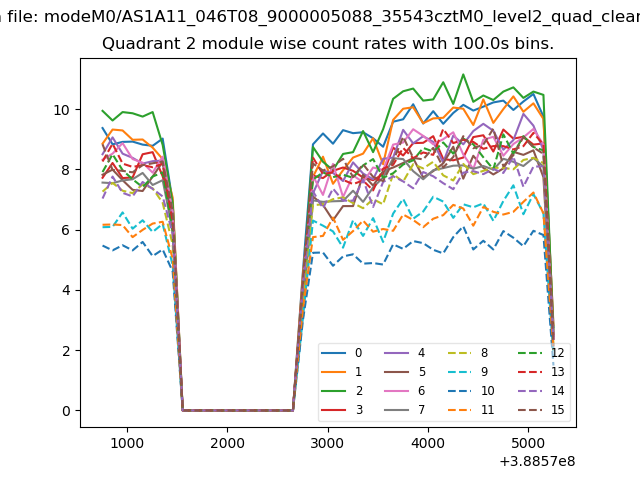
| Module-wise count rates for Quadrant B Data is divided into 100 sec bins |
 |
 |
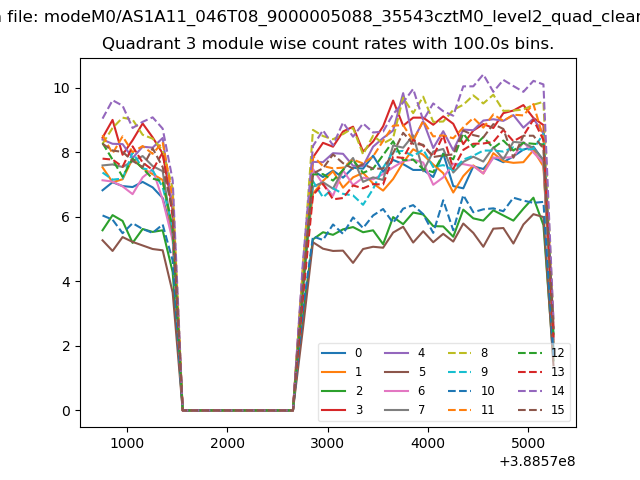
| Module-wise count rates for Quadrant C Data is divided into 100 sec bins |
 |
 |
| Module-wise count rates for Quadrant D Data is divided into 100 sec bins |
 |
 |
| Parameter | Plot |
|---|---|
| CZT HV Monitor | 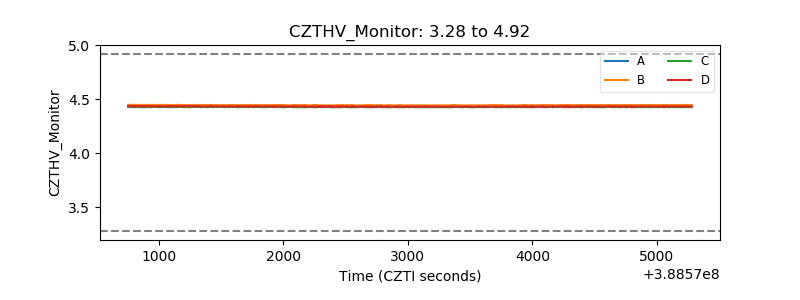 |
| D_VDD | 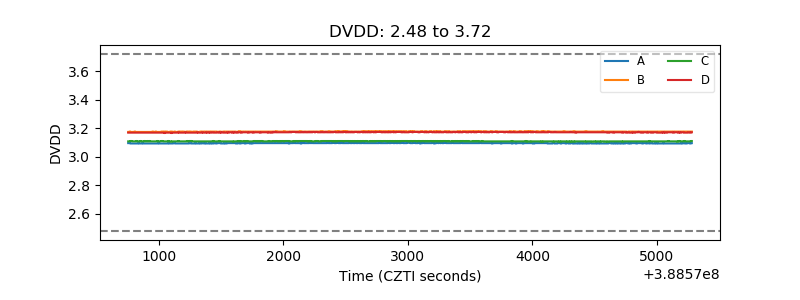 |
| Temperature 1 | 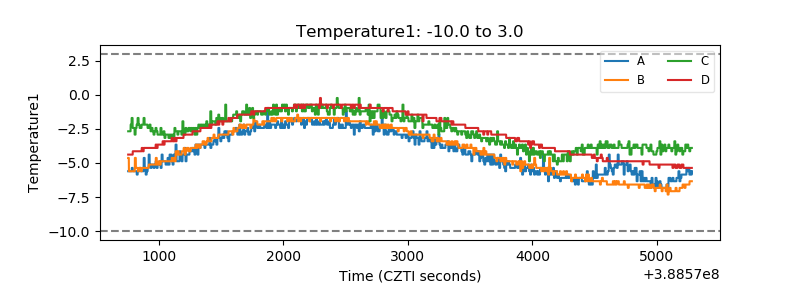 |
| Veto HV Monitor | 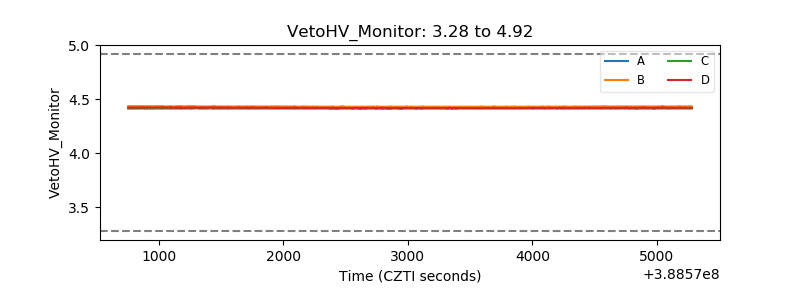 |
| Veto LLD | 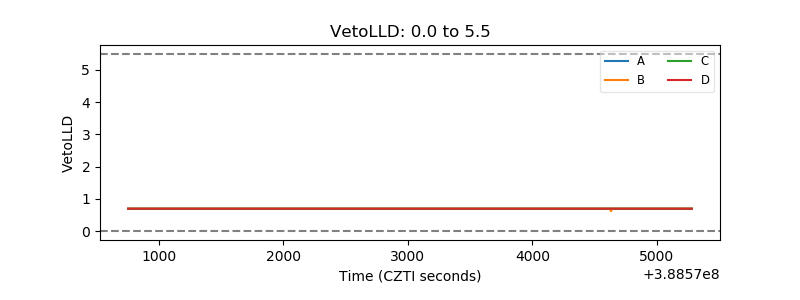 |
| Alpha Counter | 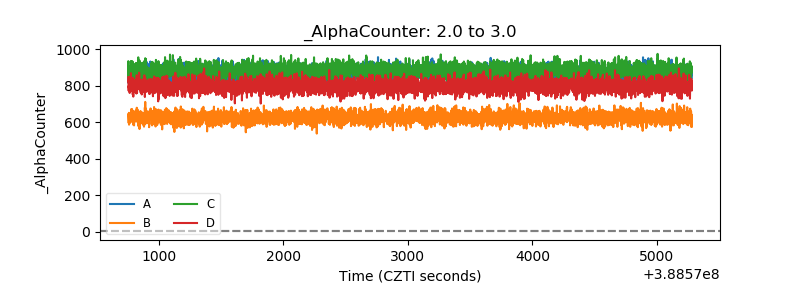 |
| _CPM_Rate | 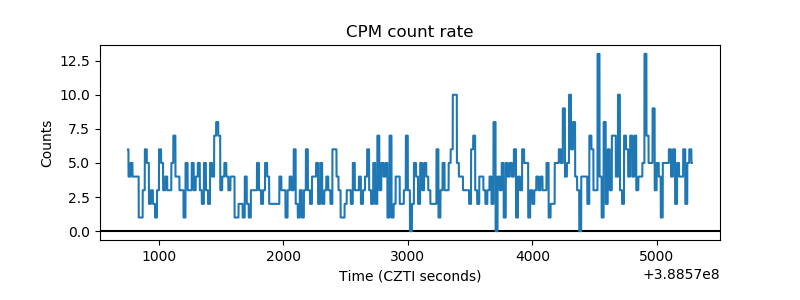 |
| CZT Counter | 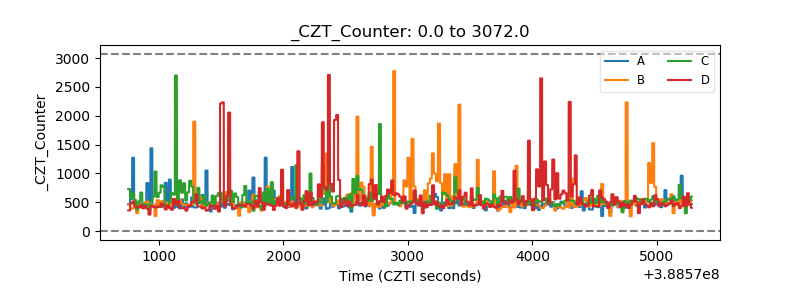 |
| +2.5 Volts monitor | 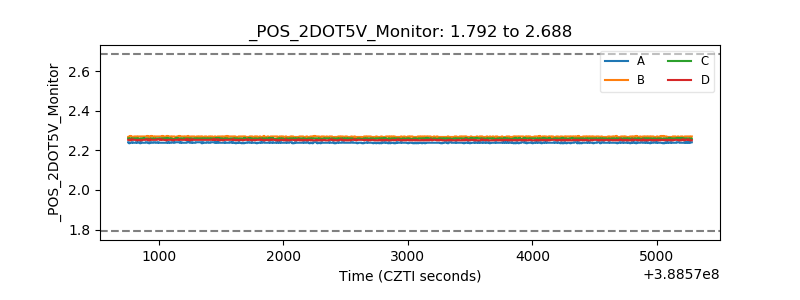 |
| +5 Volts monitor | 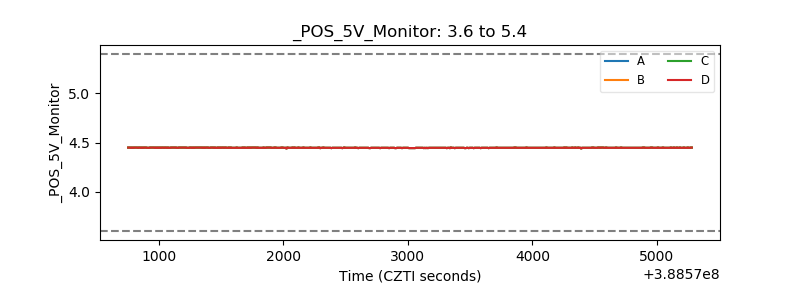 |
| _ROLL_ROT | 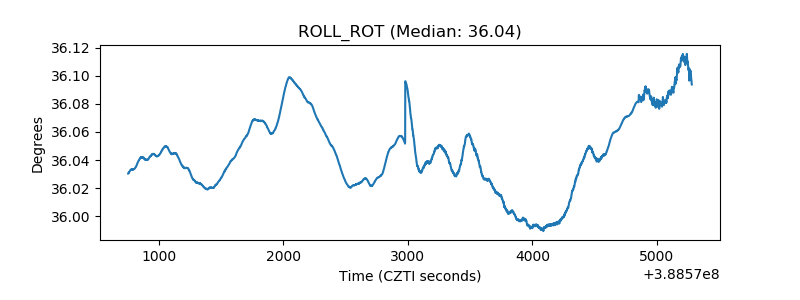 |
| _Roll_DEC | 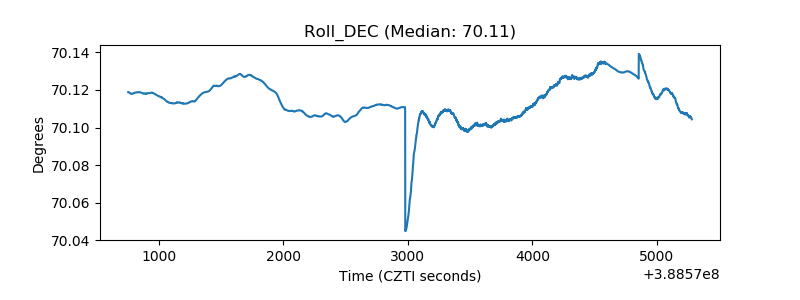 |
| _Roll_RA | 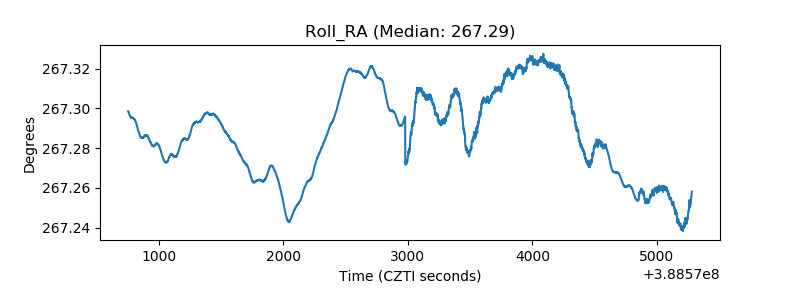 |
| Veto Counter | 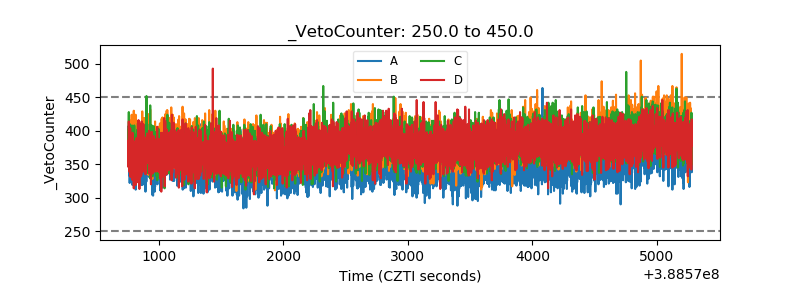 |