| Param | Original file | Final file |
|---|---|---|
| Filename | modeM0/AS1A11_046T08_9000005088_35542cztM0_level2.evt | modeM0/AS1A11_046T08_9000005088_35542cztM0_level2_quad_clean.evt |
| Size (bytes) | 610,272,000 | 87,350,400 |
| Size | 582.0 MB | 83.3 MB |
| Events in quadrant A | 6,882,639 | 507,998 |
| Events in quadrant B | 3,375,696 | 579,254 |
| Events in quadrant C | 3,409,663 | 588,677 |
| Events in quadrant D | 4,412,699 | 554,162 |
| Mode M0 | |||
|---|---|---|---|
| Quadrant | BADHDUFLAG | Total packets | Discarded packets |
| A | 0 | 24583 | 3 |
| B | 0 | 13930 | 2 |
| C | 0 | 13650 | 2 |
| D | 0 | 17222 | 2 |
| Mode SS | |||
|---|---|---|---|
| Quadrant | BADHDUFLAG | Total packets | Discarded packets |
| A | 0 | 118 | 0 |
| B | 0 | 118 | 0 |
| C | 0 | 118 | 0 |
| D | 0 | 118 | 0 |
| Mode M9 | |||
|---|---|---|---|
| Quadrant | BADHDUFLAG | Total packets | Discarded packets |
| A | 0 | 16 | 0 |
| B | 0 | 16 | 0 |
| C | 0 | 16 | 0 |
| D | 0 | 17 | 0 |
| Quadrant | Total seconds | Saturated seconds | Saturation percentage |
|---|---|---|---|
| A | 5938 | 1108 | 18.659481% |
| B | 5938 | 139 | 2.340856% |
| C | 5938 | 91 | 1.532503% |
| D | 5938 | 277 | 4.664870% |
Noise dominated data is calculated using 1-second bins in cleaned event files. If a bin has >2000 counts, and if more than 50% of those come from <1% of pixels, then it is considered to be noise-dominated and hence unusable.
| Quadrant | # 1 sec bins | Bins with >0 counts | Bins with >2000 counts | High rate bins dominated by noise | Noise dominated (total time) | Noise dominated (detector-on time) | Marked lightcurve |
|---|---|---|---|---|---|---|---|
| A | 7252 | 5939 | 927 | 927 | 12.78% | 15.61% | 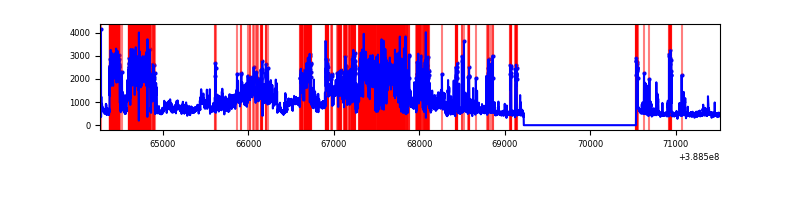 |
| B | 7252 | 5939 | 73 | 73 | 1.01% | 1.23% | 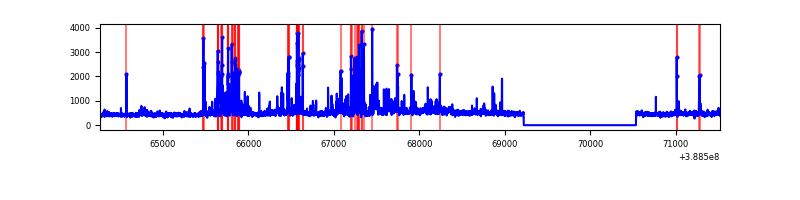 |
| C | 7252 | 5939 | 75 | 75 | 1.03% | 1.26% | 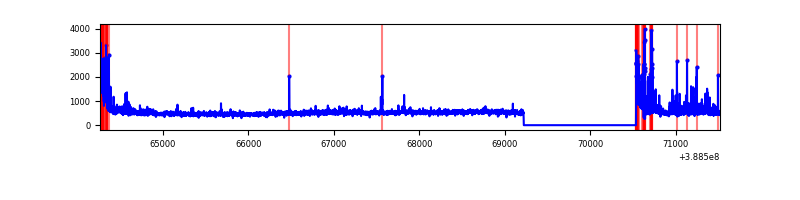 |
| D | 7252 | 5939 | 220 | 220 | 3.03% | 3.70% | 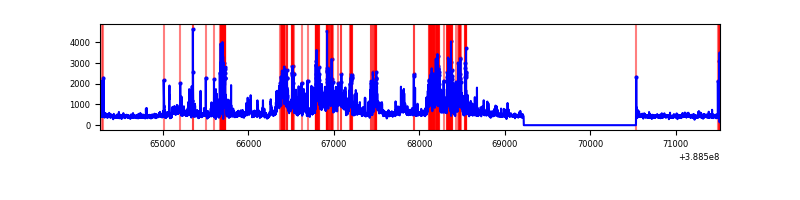 |
Top three noisy pixels from each quadrant. If the there are fewer than three noisy pixels in the level2.evt file, extra rows are filled as -1
| Pixel properties | Quadrant properties | ||||||
|---|---|---|---|---|---|---|---|
| Quadrant | DetID | PixID | Counts | Sigma | Mean | Median | Sigma |
| A | 15 | 169 | 4235412 | 33705.91 | 623 | 611 | 125.6 |
| A | 10 | 83 | 137668 | 1090.87 | 623 | 611 | 125.6 |
| A | 9 | 143 | 84402 | 666.91 | 623 | 611 | 125.6 |
| B | 5 | 236 | 490151 | 3869.03 | 661 | 643 | 126.5 |
| B | 5 | 172 | 139932 | 1100.93 | 661 | 643 | 126.5 |
| B | 0 | 190 | 37364 | 290.24 | 661 | 643 | 126.5 |
| C | 0 | 10 | 479006 | 3181.79 | 651 | 656 | 150.3 |
| C | 15 | 214 | 268312 | 1780.34 | 651 | 656 | 150.3 |
| C | 9 | 187 | 49425 | 324.39 | 651 | 656 | 150.3 |
| D | 12 | 235 | 1008180 | 6302.11 | 645 | 627 | 159.9 |
| D | 8 | 195 | 337951 | 2109.92 | 645 | 627 | 159.9 |
| D | 12 | 6 | 247439 | 1543.78 | 645 | 627 | 159.9 |
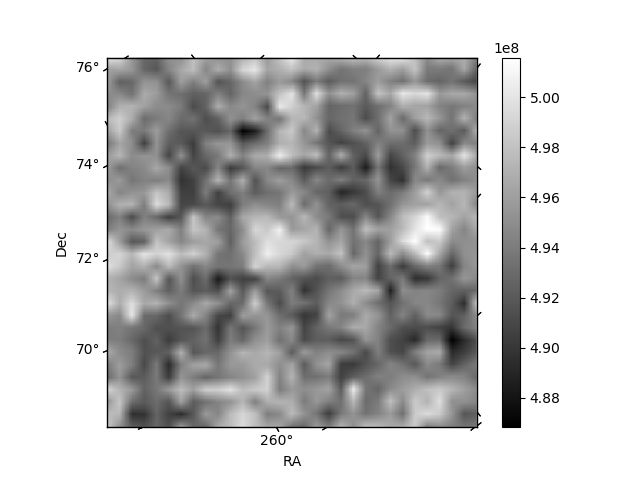
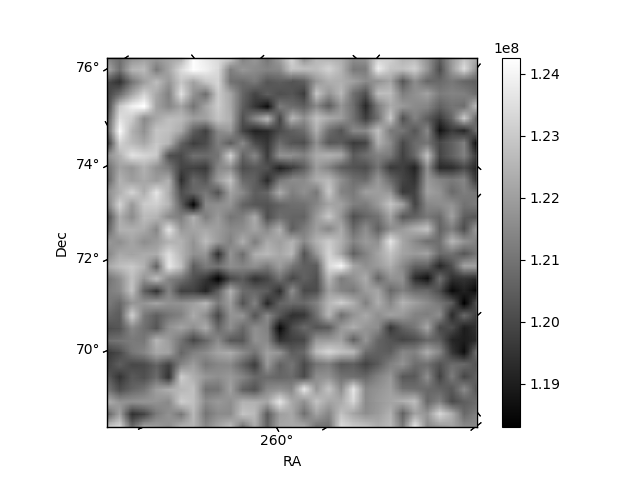
Histogram calculated using DETX and DETY for each event in the final _common_clean file
| Quadrant A | 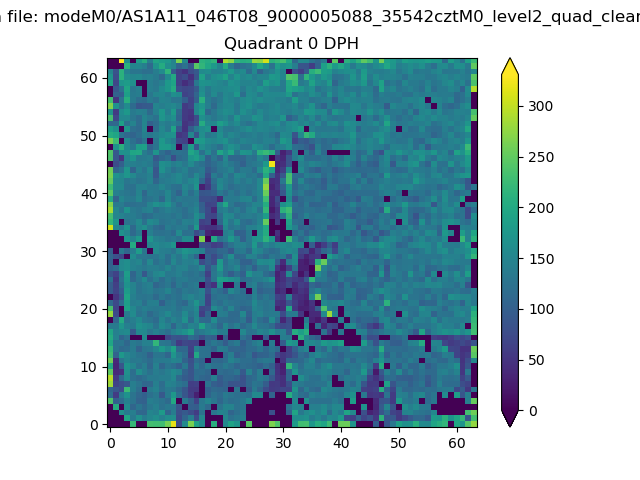 |
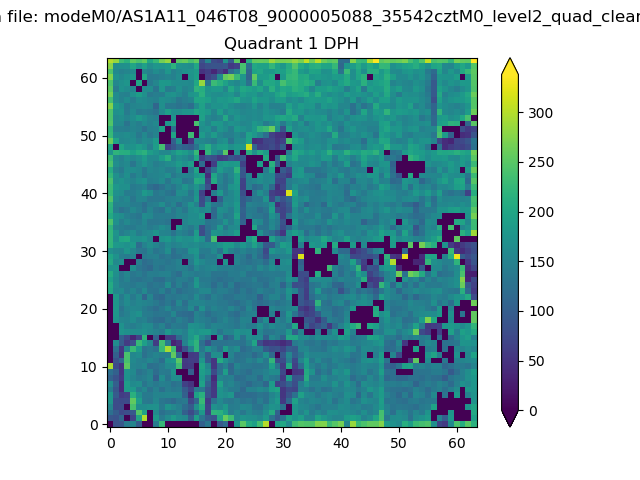 |
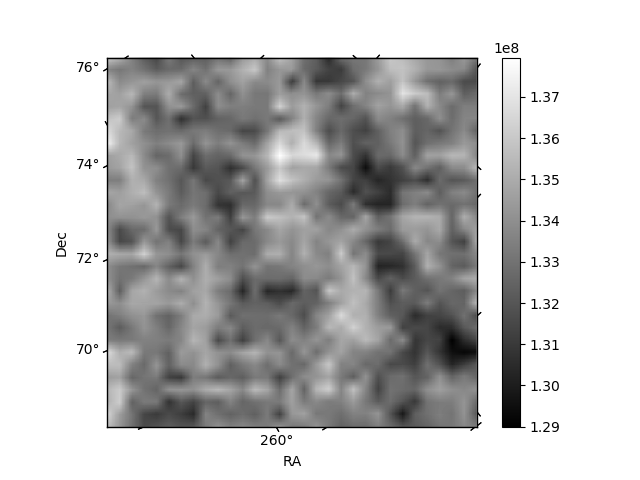
Quadrant B |
|---|---|---|---|
| Quadrant D | 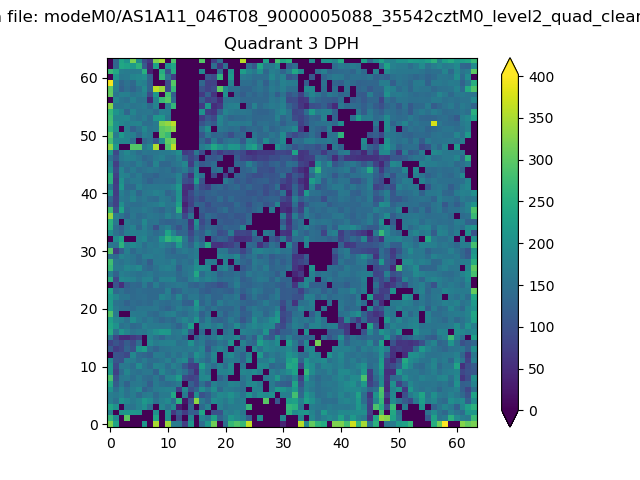 |
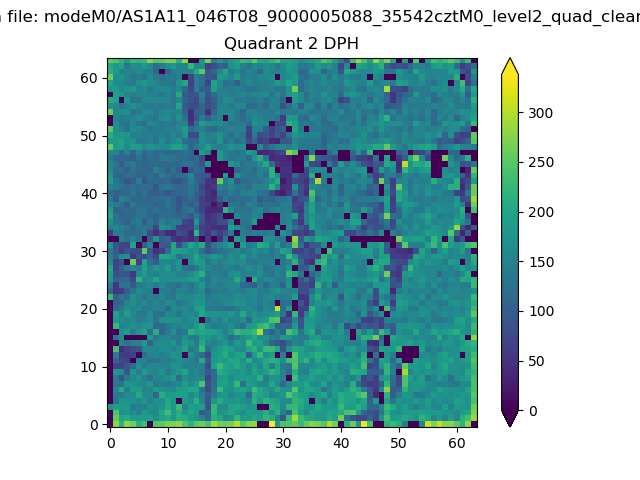 |
Quadrant C |
| Plot type | Count rate plots | Images |
|---|---|---|
| Comparison with Poisson distribution Blue bars denote a histogram of data divided into 1 sec bins. Red curve is a Poisson curve with rate = median count rate of data. |
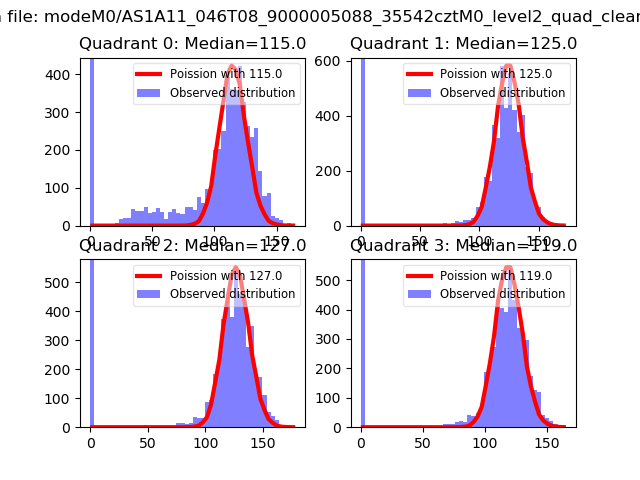 |
 |
| Quadrant-wise count rates Data is divided into 100 sec bins |
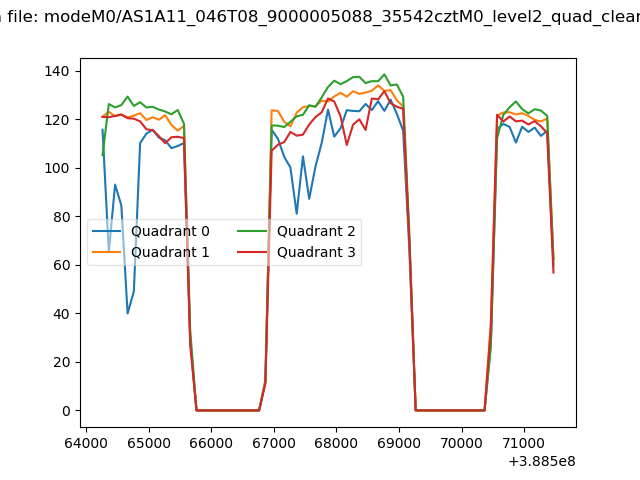 |
|
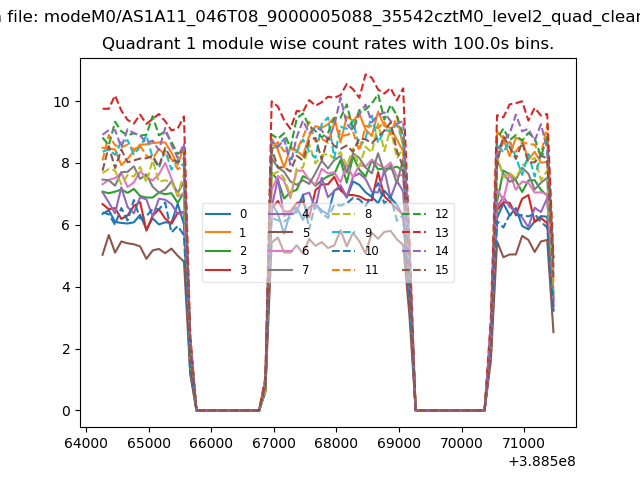
| Module-wise count rates for Quadrant A Data is divided into 100 sec bins |
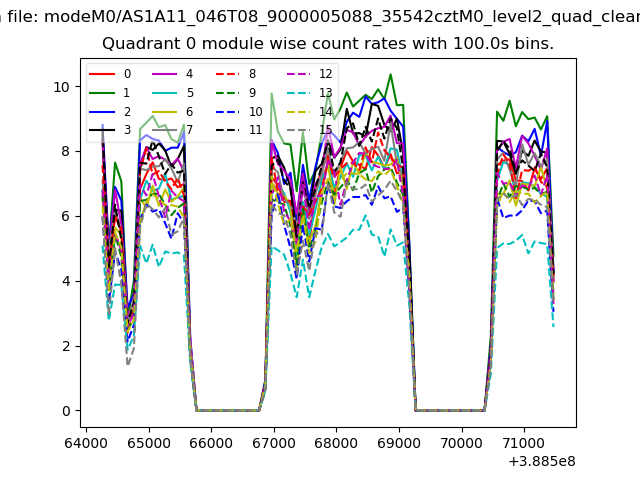 |
 |
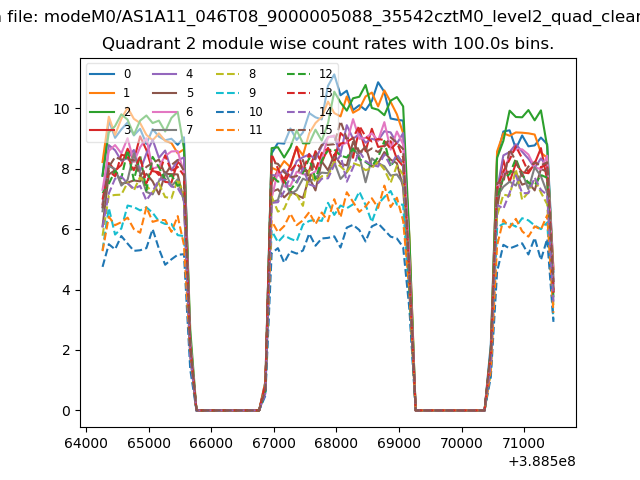
| Module-wise count rates for Quadrant B Data is divided into 100 sec bins |
 |
 |
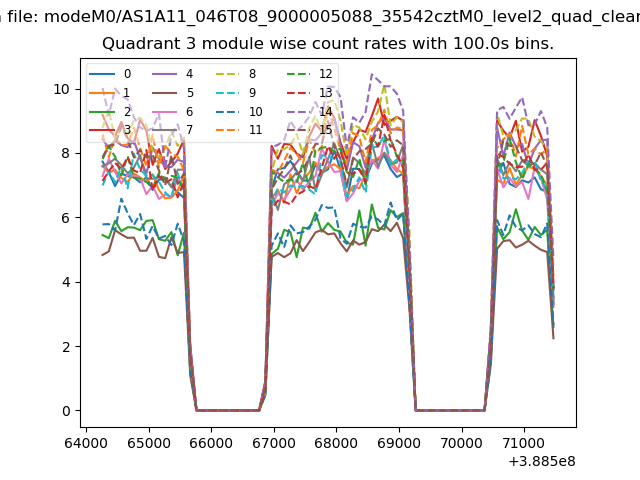
| Module-wise count rates for Quadrant C Data is divided into 100 sec bins |
 |
 |
| Module-wise count rates for Quadrant D Data is divided into 100 sec bins |
 |
 |
| Parameter | Plot |
|---|---|
| CZT HV Monitor | 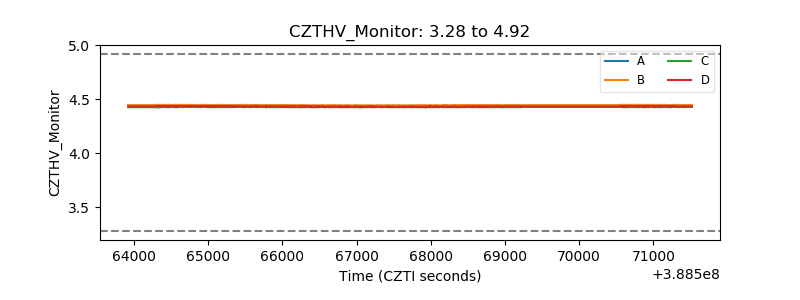 |
| D_VDD | 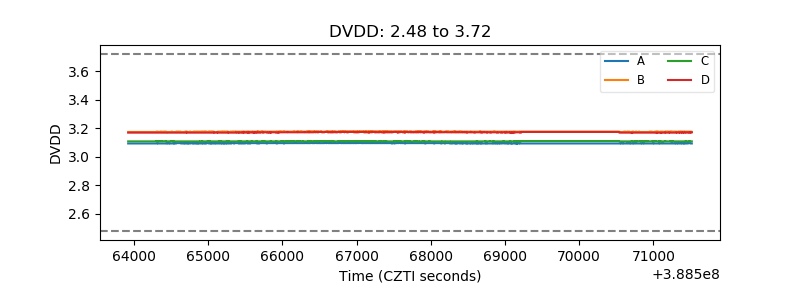 |
| Temperature 1 | 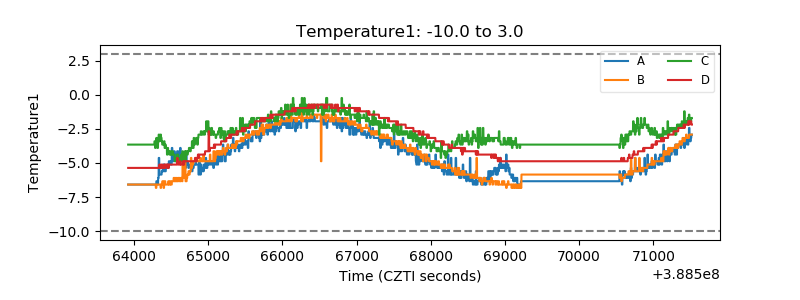 |
| Veto HV Monitor | 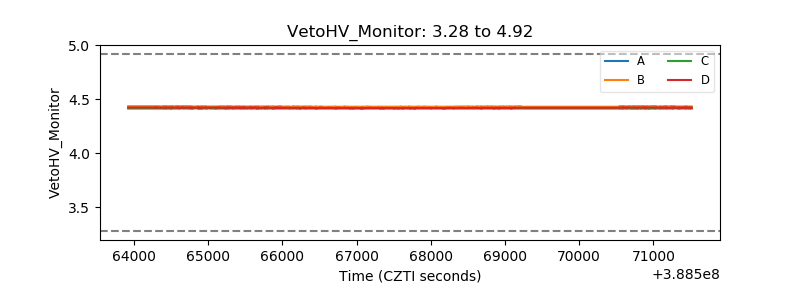 |
| Veto LLD | 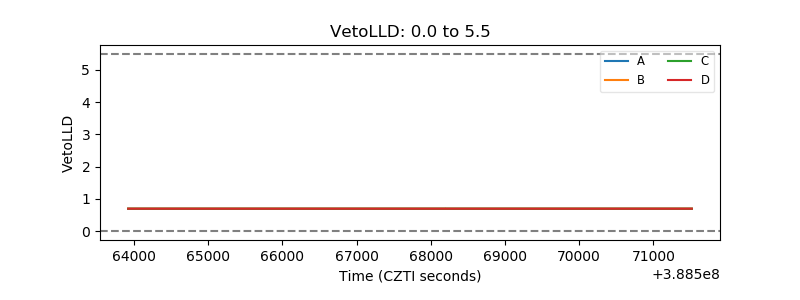 |
| Alpha Counter | 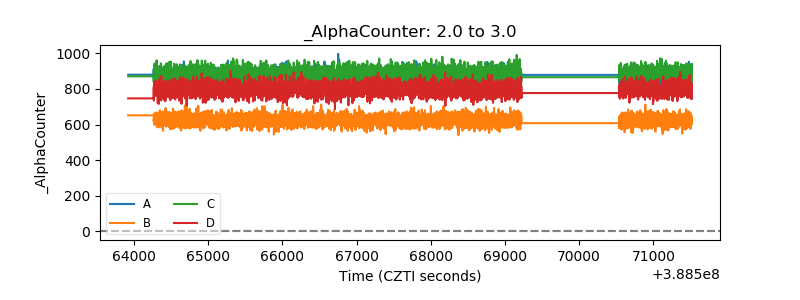 |
| _CPM_Rate | 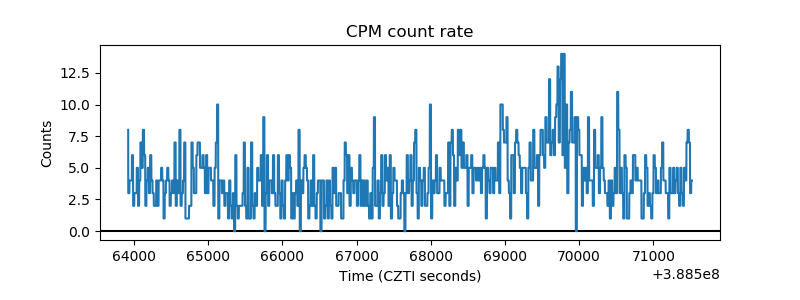 |
| CZT Counter | 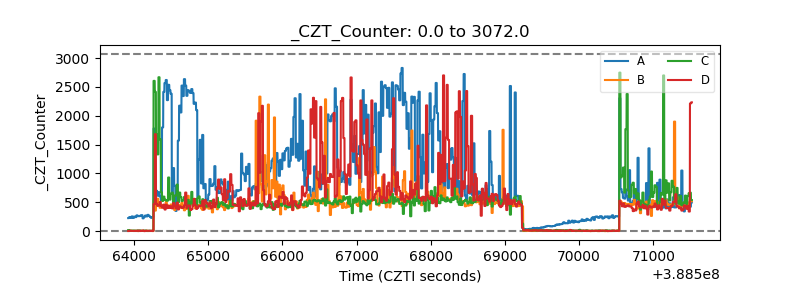 |
| +2.5 Volts monitor | 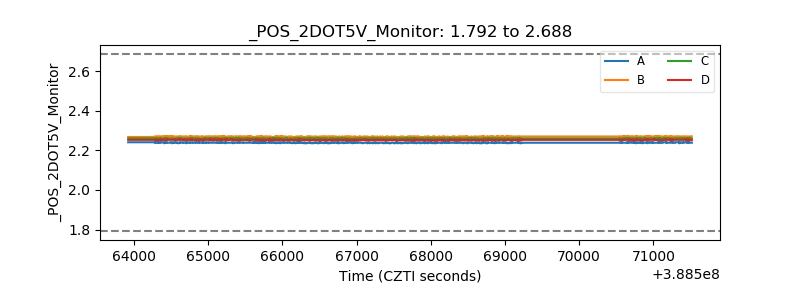 |
| +5 Volts monitor |  |
| _ROLL_ROT | 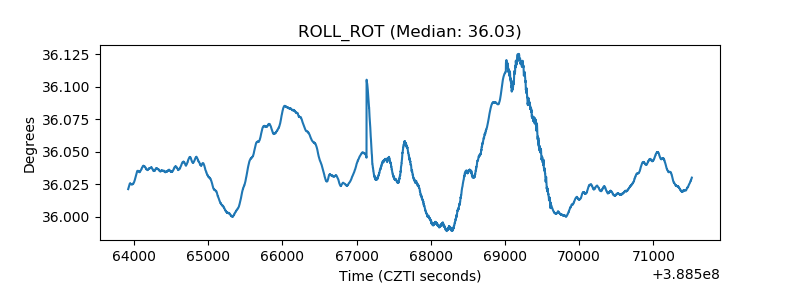 |
| _Roll_DEC | 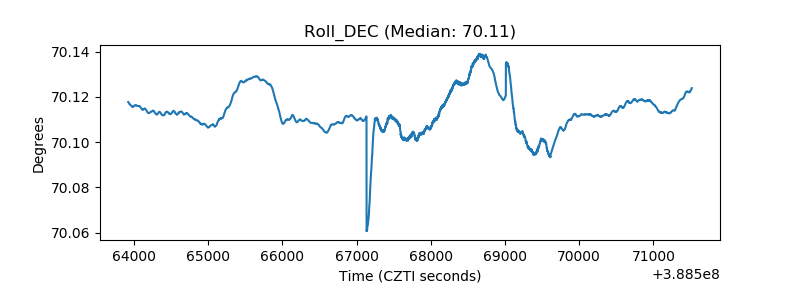 |
| _Roll_RA | 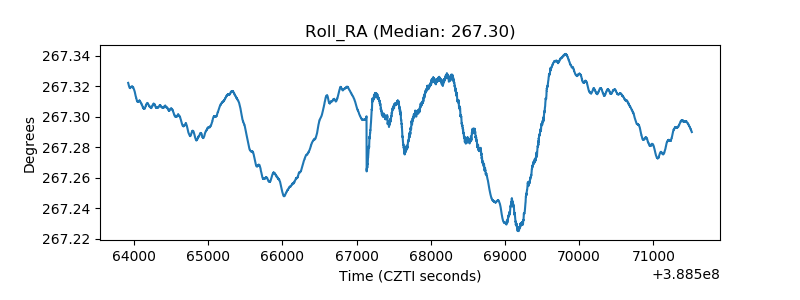 |
| Veto Counter | 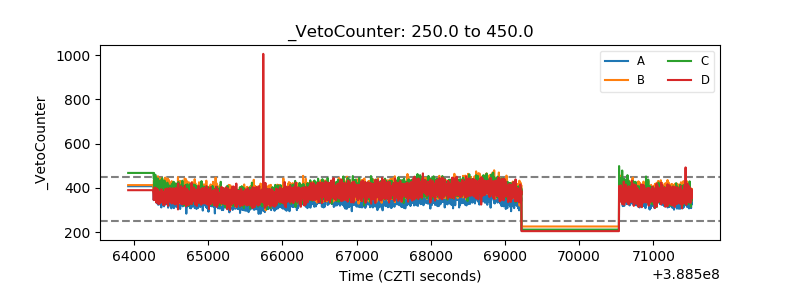 |