| Param | Original file | Final file |
|---|---|---|
| Filename | modeM0/AS1A11_046T08_9000005088_35541cztM0_level2.evt | modeM0/AS1A11_046T08_9000005088_35541cztM0_level2_quad_clean.evt |
| Size (bytes) | 533,643,840 | 82,321,920 |
| Size | 508.9 MB | 78.5 MB |
| Events in quadrant A | 4,244,176 | 502,127 |
| Events in quadrant B | 4,021,725 | 522,034 |
| Events in quadrant C | 3,092,653 | 557,150 |
| Events in quadrant D | 4,419,921 | 516,195 |
| Mode M0 | |||
|---|---|---|---|
| Quadrant | BADHDUFLAG | Total packets | Discarded packets |
| A | 0 | 16380 | 3 |
| B | 0 | 15875 | 2 |
| C | 0 | 12671 | 2 |
| D | 0 | 17080 | 2 |
| Mode SS | |||
|---|---|---|---|
| Quadrant | BADHDUFLAG | Total packets | Discarded packets |
| A | 0 | 116 | 0 |
| B | 0 | 116 | 0 |
| C | 0 | 116 | 0 |
| D | 0 | 116 | 0 |
| Mode M9 | |||
|---|---|---|---|
| Quadrant | BADHDUFLAG | Total packets | Discarded packets |
| A | 0 | 19 | 0 |
| B | 0 | 19 | 0 |
| C | 0 | 19 | 0 |
| D | 0 | 20 | 0 |
| Quadrant | Total seconds | Saturated seconds | Saturation percentage |
|---|---|---|---|
| A | 5643 | 570 | 10.101010% |
| B | 5643 | 591 | 10.473153% |
| C | 5643 | 58 | 1.027822% |
| D | 5643 | 275 | 4.873294% |
Noise dominated data is calculated using 1-second bins in cleaned event files. If a bin has >2000 counts, and if more than 50% of those come from <1% of pixels, then it is considered to be noise-dominated and hence unusable.
| Quadrant | # 1 sec bins | Bins with >0 counts | Bins with >2000 counts | High rate bins dominated by noise | Noise dominated (total time) | Noise dominated (detector-on time) | Marked lightcurve |
|---|---|---|---|---|---|---|---|
| A | 7136 | 5644 | 458 | 458 | 6.42% | 8.11% | 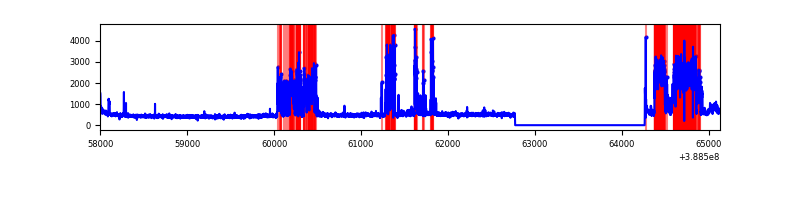 |
| B | 7136 | 5644 | 360 | 360 | 5.04% | 6.38% | 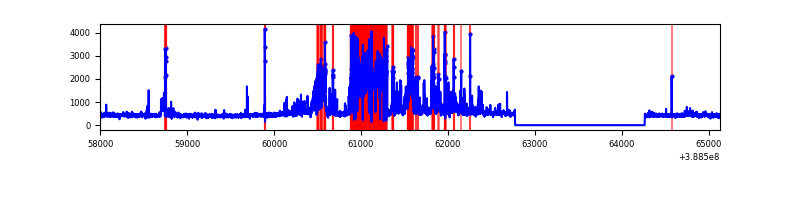 |
| C | 7136 | 5644 | 50 | 50 | 0.70% | 0.89% | 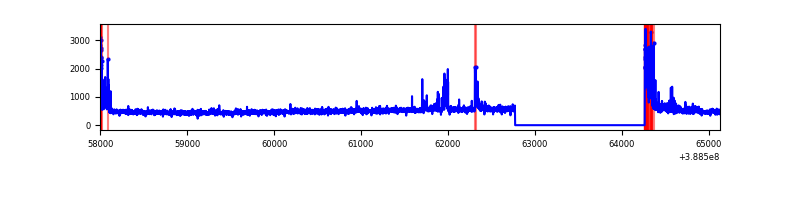 |
| D | 7136 | 5644 | 255 | 255 | 3.57% | 4.52% | 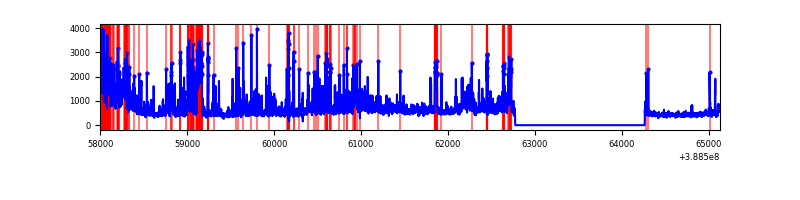 |
Top three noisy pixels from each quadrant. If the there are fewer than three noisy pixels in the level2.evt file, extra rows are filled as -1
| Pixel properties | Quadrant properties | ||||||
|---|---|---|---|---|---|---|---|
| Quadrant | DetID | PixID | Counts | Sigma | Mean | Median | Sigma |
| A | 15 | 169 | 1450664 | 12066.04 | 603 | 592 | 120.2 |
| A | 15 | 237 | 294048 | 2441.85 | 603 | 592 | 120.2 |
| A | 10 | 83 | 139117 | 1152.67 | 603 | 592 | 120.2 |
| B | 5 | 236 | 1288755 | 11362.09 | 590 | 575 | 113.4 |
| B | 5 | 172 | 270684 | 2382.43 | 590 | 575 | 113.4 |
| B | 0 | 245 | 28390 | 245.34 | 590 | 575 | 113.4 |
| C | 0 | 10 | 292109 | 2067.12 | 616 | 621 | 141.0 |
| C | 15 | 214 | 256891 | 1817.37 | 616 | 621 | 141.0 |
| C | 3 | 233 | 58275 | 408.86 | 616 | 621 | 141.0 |
| D | 12 | 235 | 1482123 | 10050.71 | 609 | 591 | 147.4 |
| D | 2 | 250 | 140674 | 950.32 | 609 | 591 | 147.4 |
| D | 8 | 195 | 128523 | 867.89 | 609 | 591 | 147.4 |
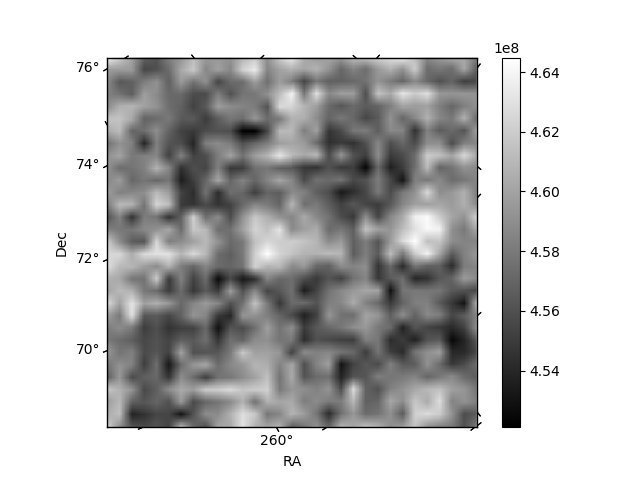
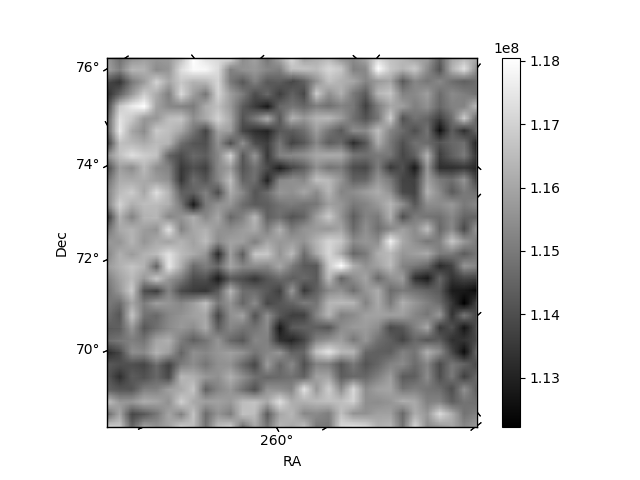
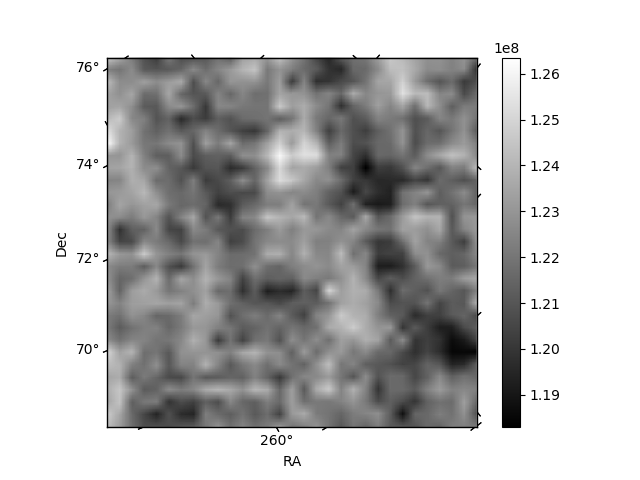
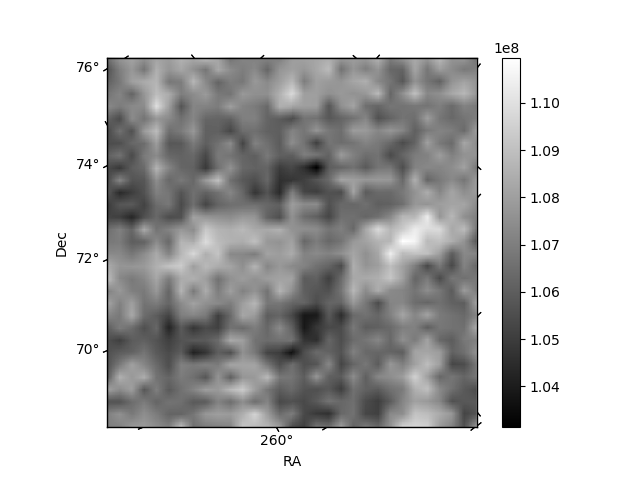
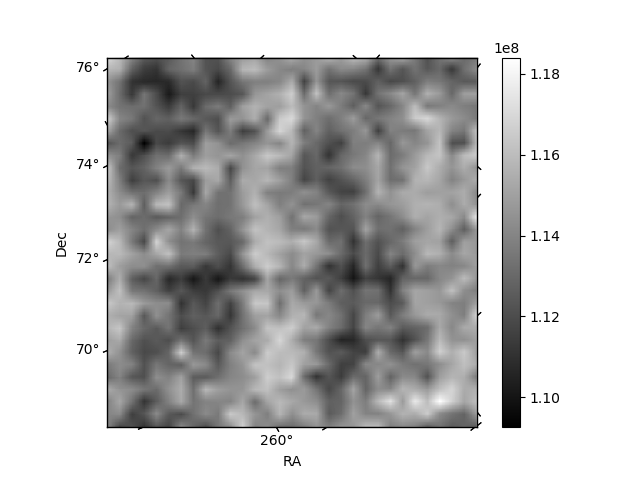
Histogram calculated using DETX and DETY for each event in the final _common_clean file
| Quadrant A | 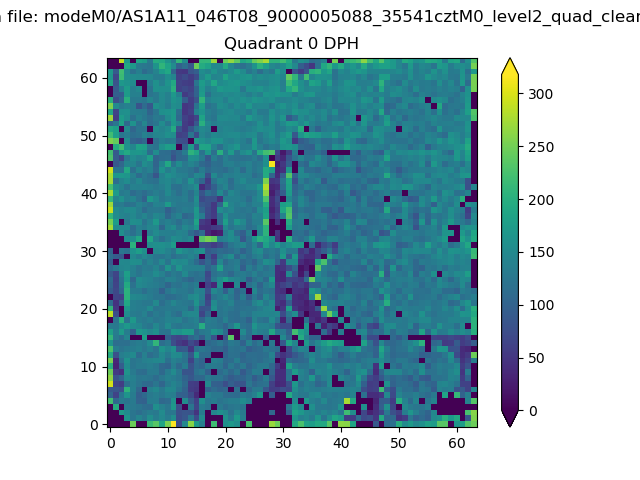 |
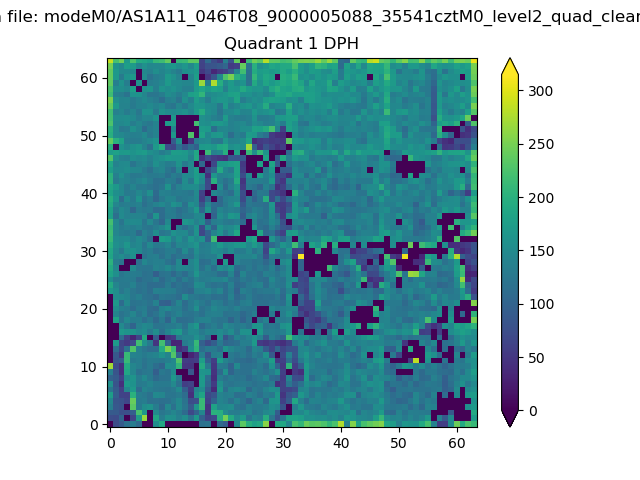 |
Quadrant B |
|---|---|---|---|
| Quadrant D | 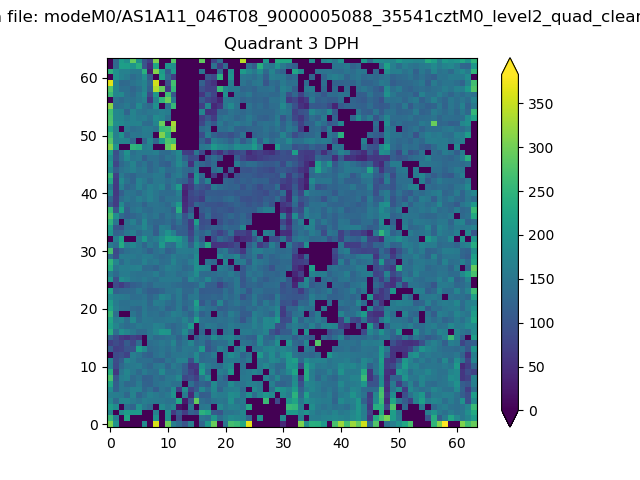 |
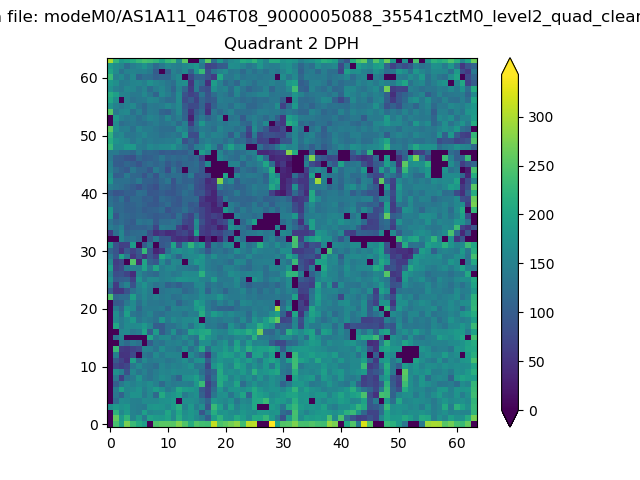 |
Quadrant C |
| Plot type | Count rate plots | Images |
|---|---|---|
| Comparison with Poisson distribution Blue bars denote a histogram of data divided into 1 sec bins. Red curve is a Poisson curve with rate = median count rate of data. |
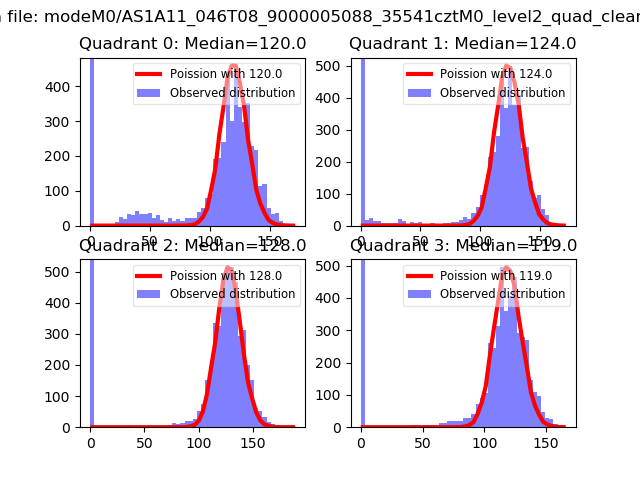 |
 |
| Quadrant-wise count rates Data is divided into 100 sec bins |
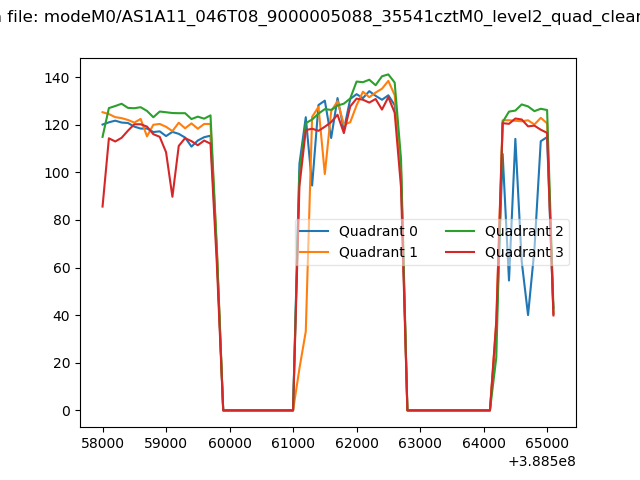 |
|
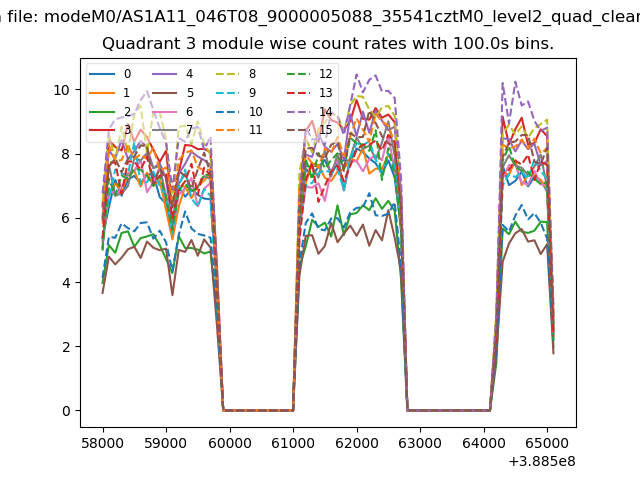
| Module-wise count rates for Quadrant A Data is divided into 100 sec bins |
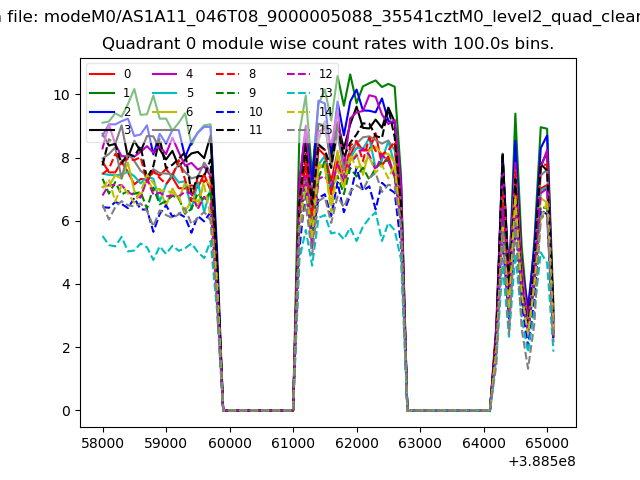 |
 |
| Module-wise count rates for Quadrant B Data is divided into 100 sec bins |
 |
 |
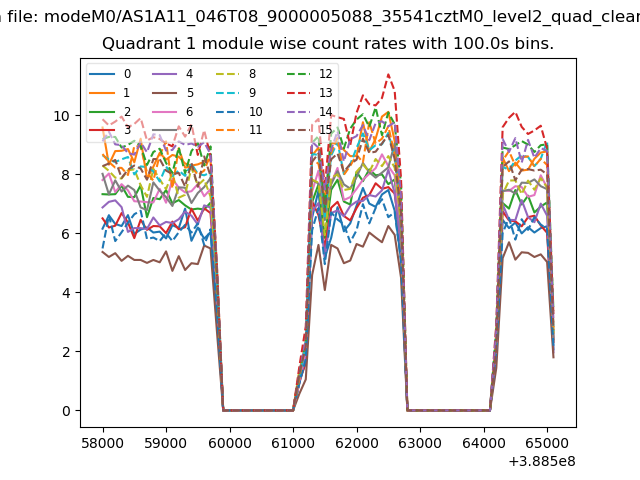
| Module-wise count rates for Quadrant C Data is divided into 100 sec bins |
 |
 |
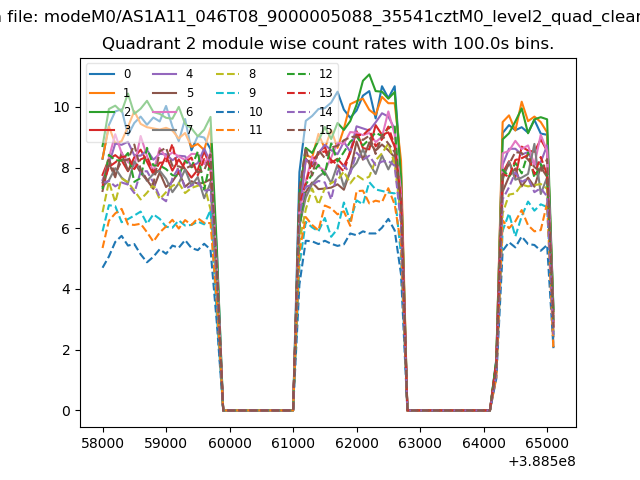
| Module-wise count rates for Quadrant D Data is divided into 100 sec bins |
 |
 |
| Parameter | Plot |
|---|---|
| CZT HV Monitor | 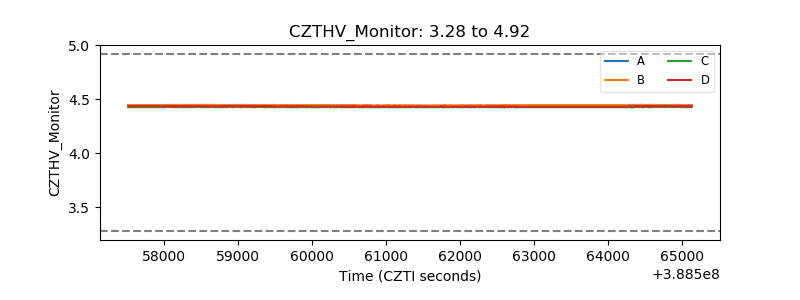 |
| D_VDD | 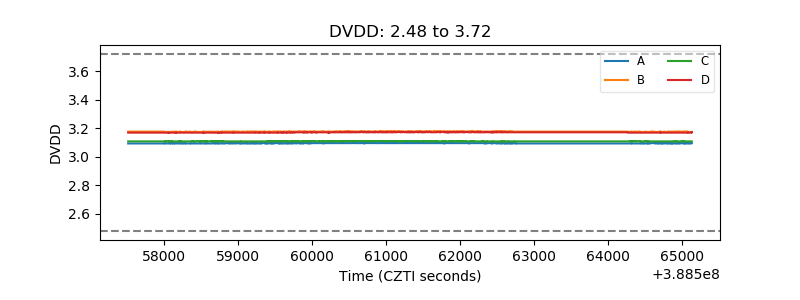 |
| Temperature 1 | 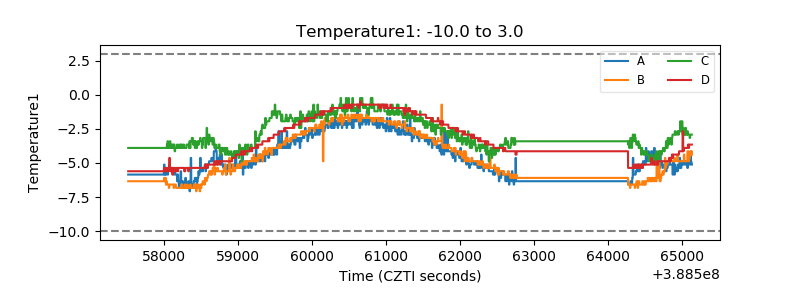 |
| Veto HV Monitor |  |
| Veto LLD | 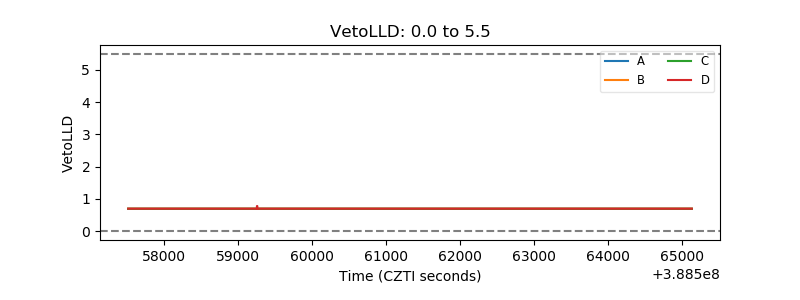 |
| Alpha Counter | 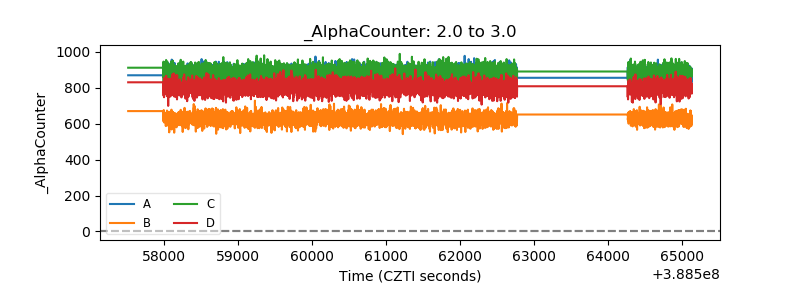 |
| _CPM_Rate | 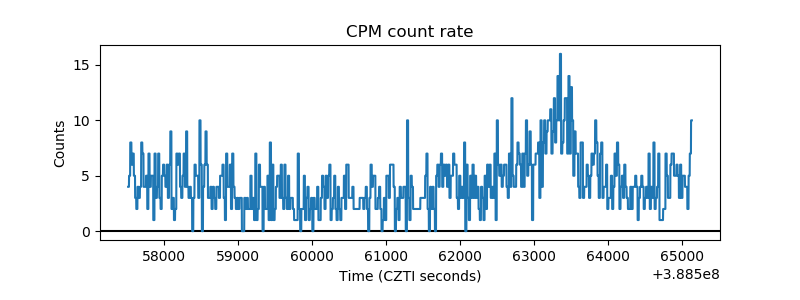 |
| CZT Counter | 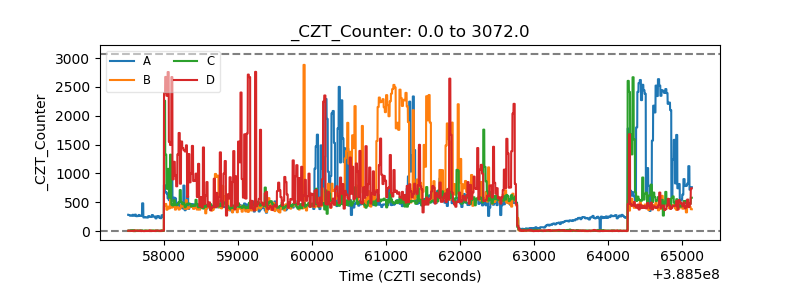 |
| +2.5 Volts monitor | 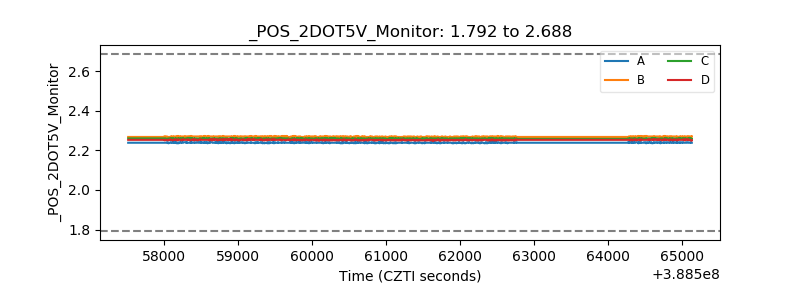 |
| +5 Volts monitor | 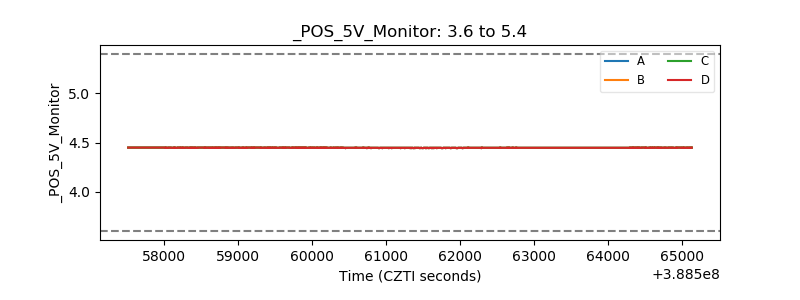 |
| _ROLL_ROT | 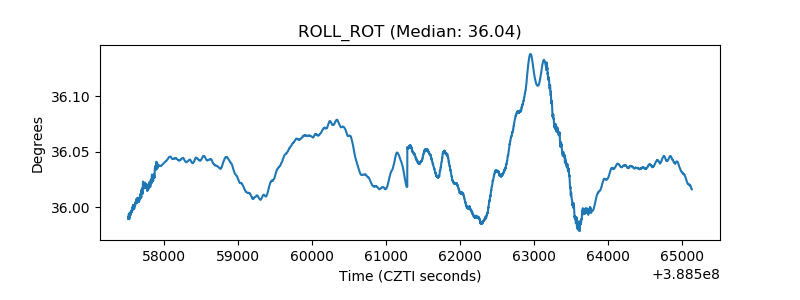 |
| _Roll_DEC | 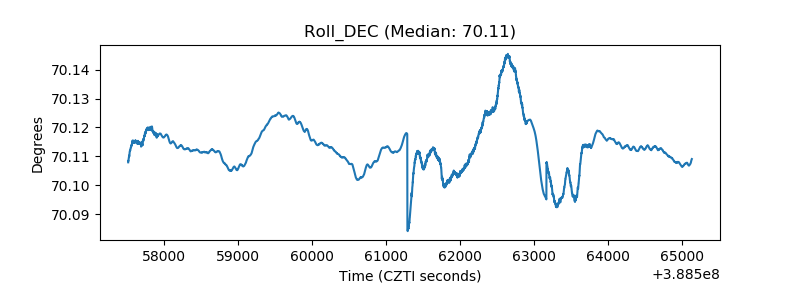 |
| _Roll_RA | 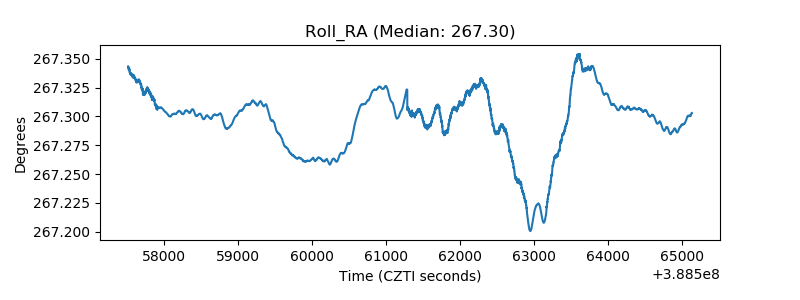 |
| Veto Counter | 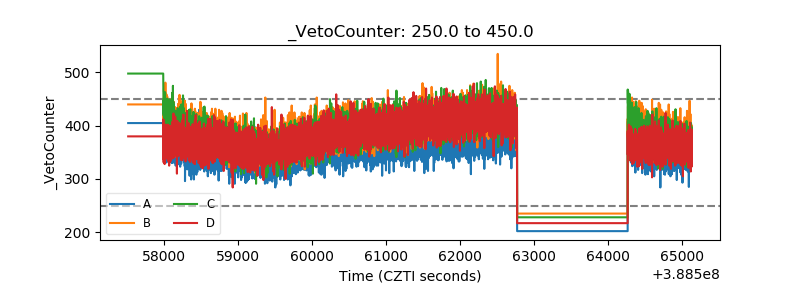 |