| Param | Original file | Final file |
|---|---|---|
| Filename | modeM0/AS1A11_046T08_9000005088_35540cztM0_level2.evt | modeM0/AS1A11_046T08_9000005088_35540cztM0_level2_quad_clean.evt |
| Size (bytes) | 580,357,440 | 79,171,200 |
| Size | 553.5 MB | 75.5 MB |
| Events in quadrant A | 2,921,151 | 516,307 |
| Events in quadrant B | 3,278,719 | 526,809 |
| Events in quadrant C | 2,879,358 | 536,679 |
| Events in quadrant D | 8,128,001 | 435,634 |
| Mode M0 | |||
|---|---|---|---|
| Quadrant | BADHDUFLAG | Total packets | Discarded packets |
| A | 0 | 12315 | 3 |
| B | 0 | 13631 | 2 |
| C | 0 | 11852 | 2 |
| D | 0 | 27955 | 2 |
| Mode SS | |||
|---|---|---|---|
| Quadrant | BADHDUFLAG | Total packets | Discarded packets |
| A | 0 | 110 | 0 |
| B | 0 | 110 | 0 |
| C | 0 | 110 | 0 |
| D | 0 | 110 | 0 |
| Mode M9 | |||
|---|---|---|---|
| Quadrant | BADHDUFLAG | Total packets | Discarded packets |
| A | 0 | 26 | 0 |
| B | 0 | 26 | 0 |
| C | 0 | 26 | 0 |
| D | 0 | 27 | 0 |
| Quadrant | Total seconds | Saturated seconds | Saturation percentage |
|---|---|---|---|
| A | 5453 | 202 | 3.704383% |
| B | 5453 | 157 | 2.879149% |
| C | 5453 | 73 | 1.338713% |
| D | 5453 | 1557 | 28.553090% |
Noise dominated data is calculated using 1-second bins in cleaned event files. If a bin has >2000 counts, and if more than 50% of those come from <1% of pixels, then it is considered to be noise-dominated and hence unusable.
| Quadrant | # 1 sec bins | Bins with >0 counts | Bins with >2000 counts | High rate bins dominated by noise | Noise dominated (total time) | Noise dominated (detector-on time) | Marked lightcurve |
|---|---|---|---|---|---|---|---|
| A | 7276 | 5454 | 74 | 74 | 1.02% | 1.36% | 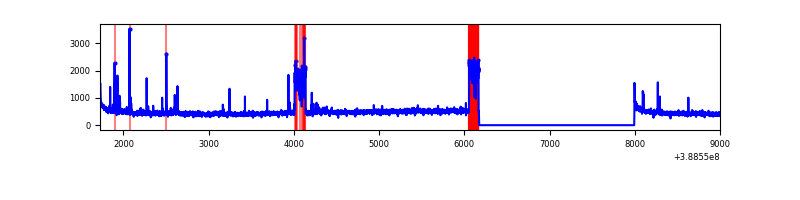 |
| B | 7276 | 5454 | 85 | 85 | 1.17% | 1.56% | 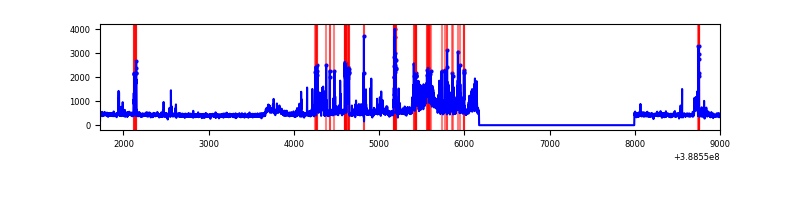 |
| C | 7276 | 5454 | 58 | 58 | 0.80% | 1.06% | 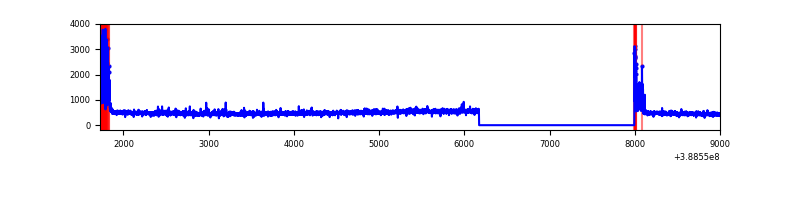 |
| D | 7276 | 5453 | 1440 | 1440 | 19.79% | 26.41% | 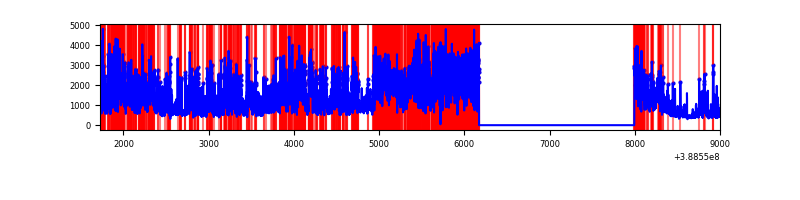 |
Top three noisy pixels from each quadrant. If the there are fewer than three noisy pixels in the level2.evt file, extra rows are filled as -1
| Pixel properties | Quadrant properties | ||||||
|---|---|---|---|---|---|---|---|
| Quadrant | DetID | PixID | Counts | Sigma | Mean | Median | Sigma |
| A | 15 | 169 | 444040 | 3665.22 | 600 | 590 | 121.0 |
| A | 10 | 83 | 140652 | 1157.64 | 600 | 590 | 121.0 |
| A | 13 | 6 | 8708 | 67.1 | 600 | 590 | 121.0 |
| B | 5 | 236 | 693803 | 6078.42 | 602 | 587 | 114.0 |
| B | 5 | 172 | 66901 | 581.47 | 602 | 587 | 114.0 |
| B | 4 | 232 | 62894 | 546.33 | 602 | 587 | 114.0 |
| C | 0 | 10 | 284989 | 2113.36 | 590 | 594 | 134.6 |
| C | 15 | 214 | 247830 | 1837.23 | 590 | 594 | 134.6 |
| C | 9 | 187 | 25190 | 182.77 | 590 | 594 | 134.6 |
| D | 12 | 235 | 5592366 | 44222.83 | 522 | 507 | 126.4 |
| D | 8 | 195 | 175145 | 1381.11 | 522 | 507 | 126.4 |
| D | 2 | 250 | 128761 | 1014.29 | 522 | 507 | 126.4 |
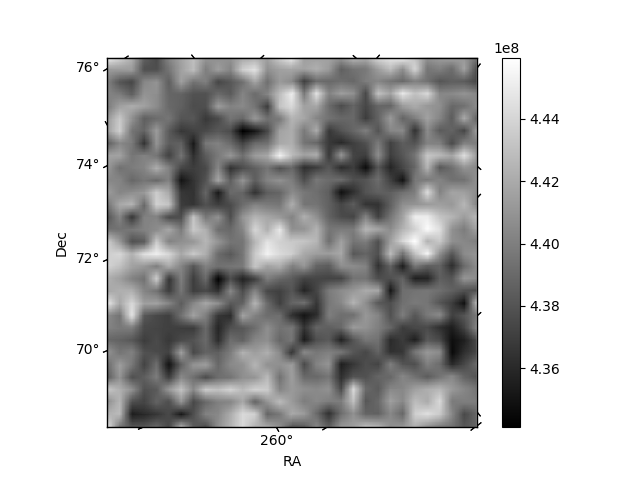
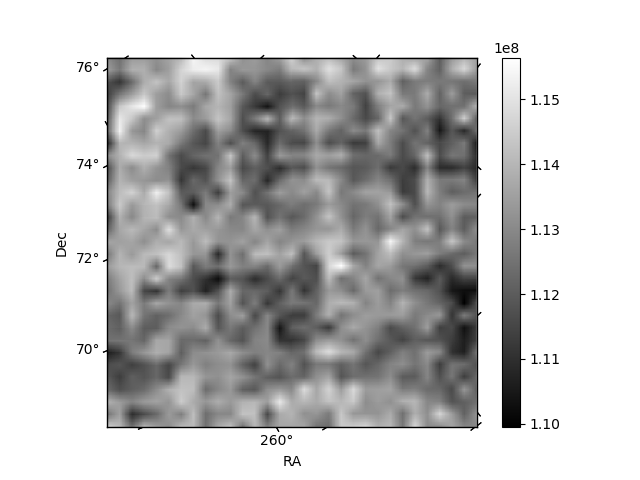
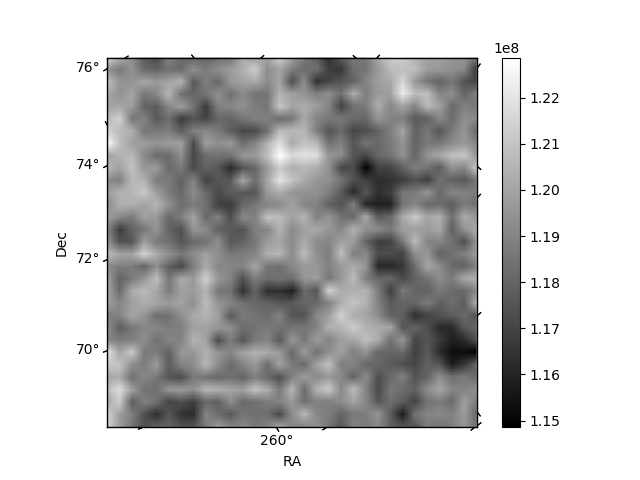
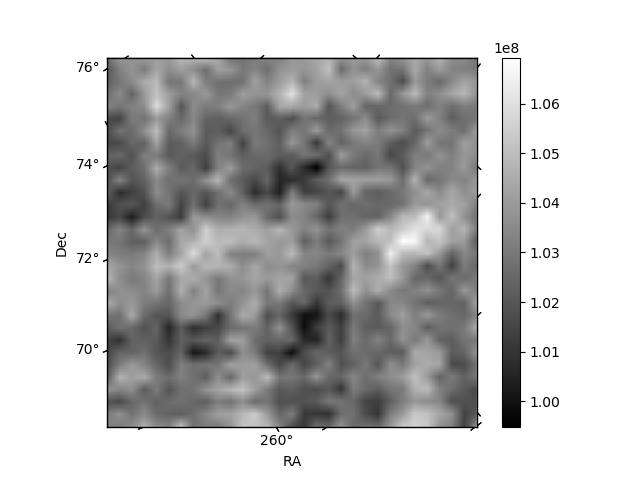
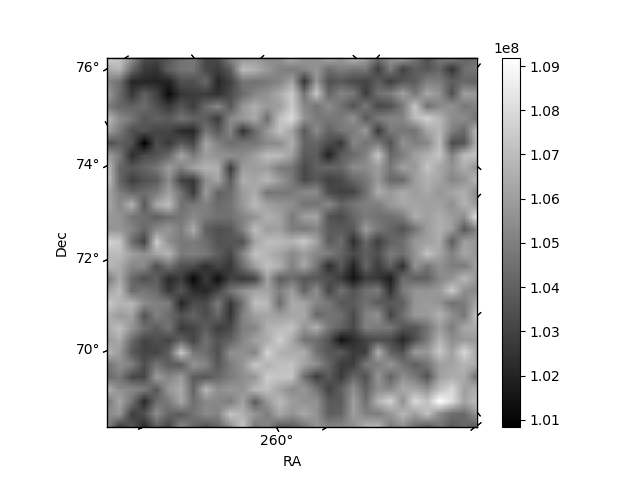
Histogram calculated using DETX and DETY for each event in the final _common_clean file
| Quadrant A | 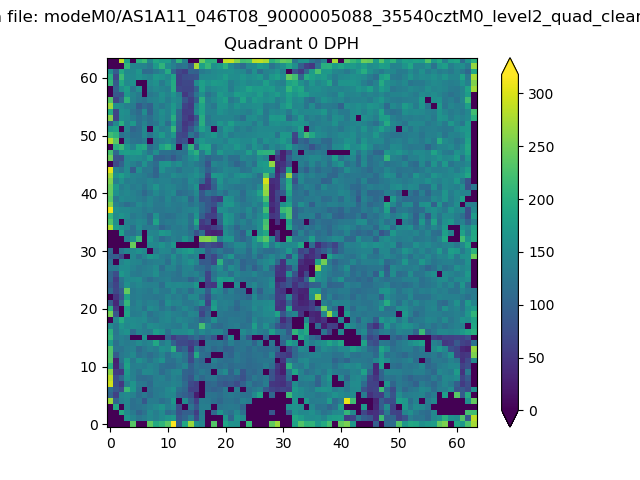 |
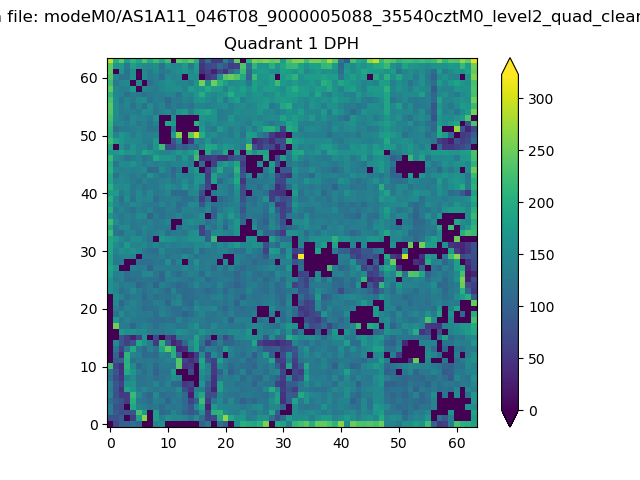 |
Quadrant B |
|---|---|---|---|
| Quadrant D | 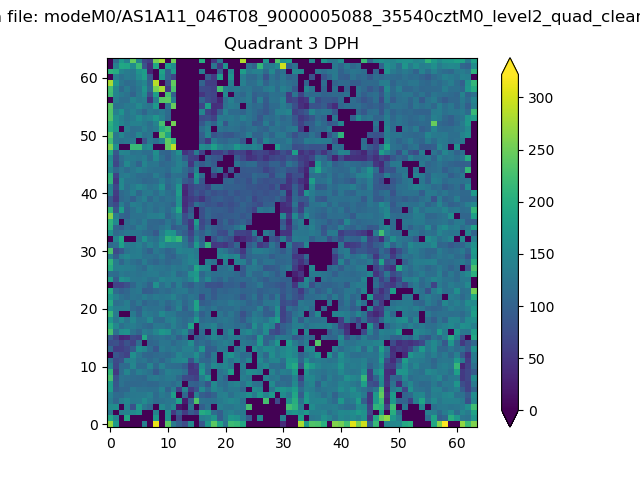 |
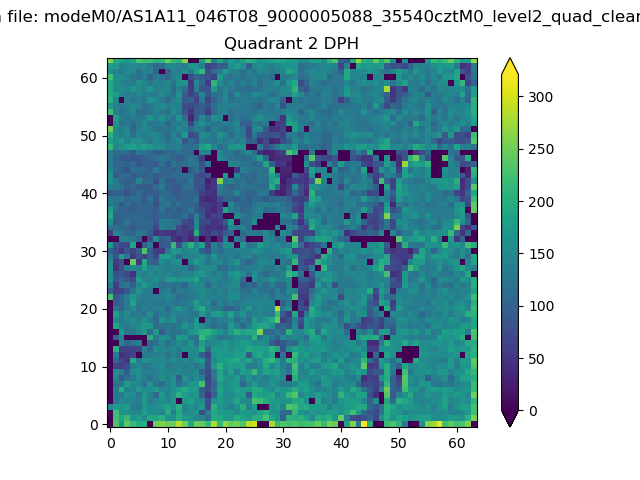 |
Quadrant C |
| Plot type | Count rate plots | Images |
|---|---|---|
| Comparison with Poisson distribution Blue bars denote a histogram of data divided into 1 sec bins. Red curve is a Poisson curve with rate = median count rate of data. |
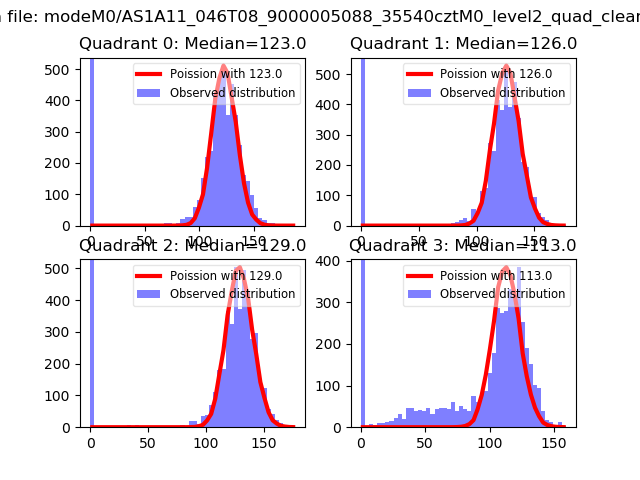 |
 |
| Quadrant-wise count rates Data is divided into 100 sec bins |
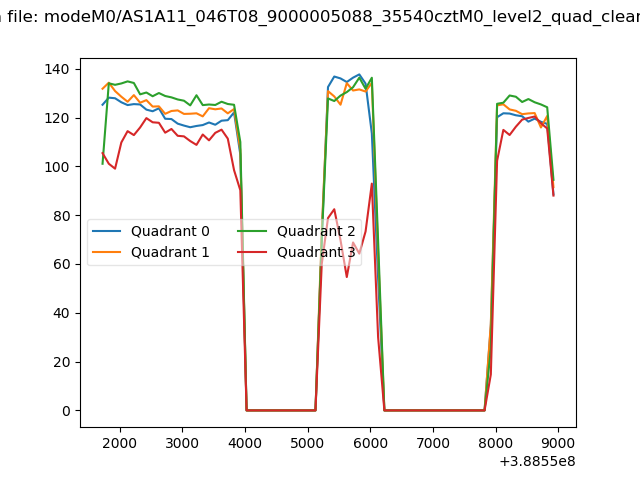 |
|
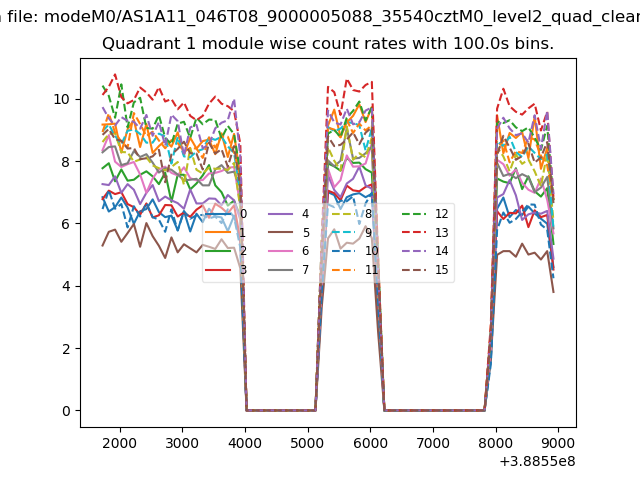
| Module-wise count rates for Quadrant A Data is divided into 100 sec bins |
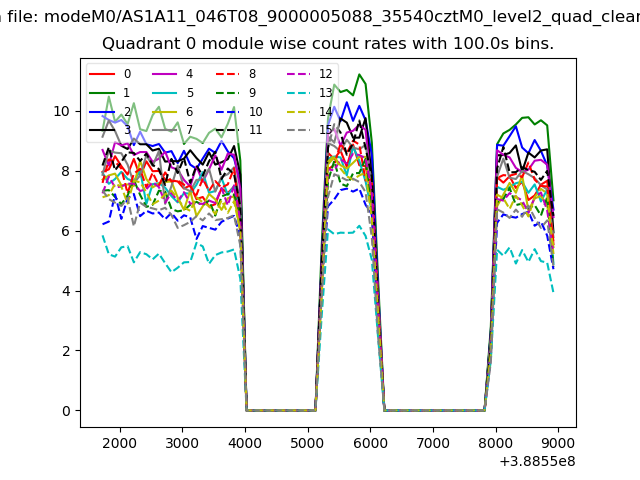 |
 |
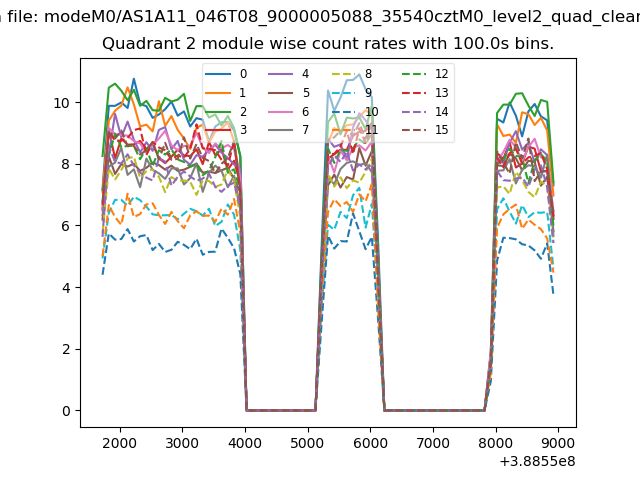
| Module-wise count rates for Quadrant B Data is divided into 100 sec bins |
 |
 |
| Module-wise count rates for Quadrant C Data is divided into 100 sec bins |
 |
 |
| Module-wise count rates for Quadrant D Data is divided into 100 sec bins |
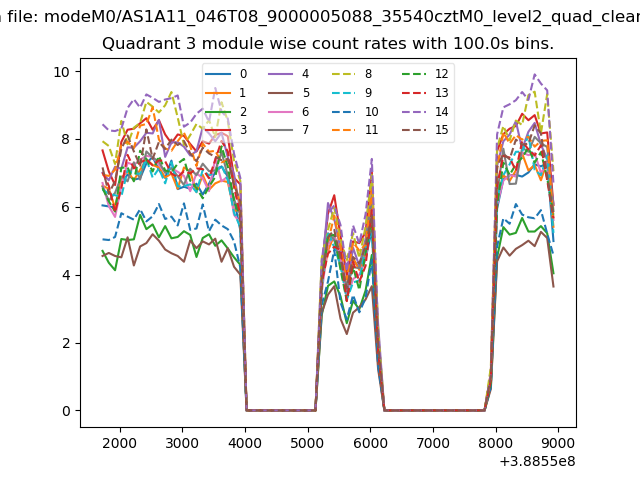 |
 |
| Parameter | Plot |
|---|---|
| CZT HV Monitor | 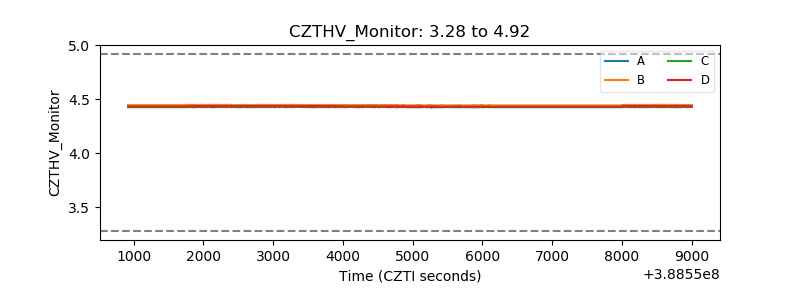 |
| D_VDD | 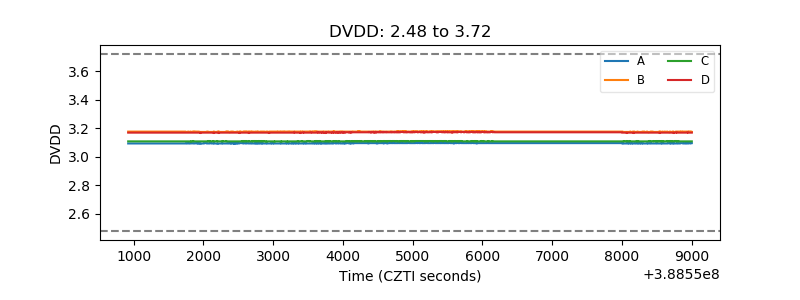 |
| Temperature 1 | 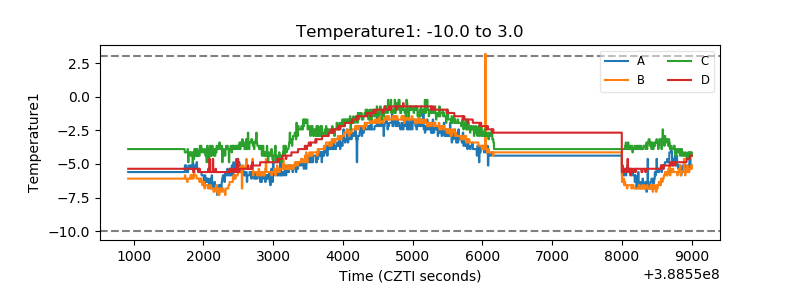 |
| Veto HV Monitor | 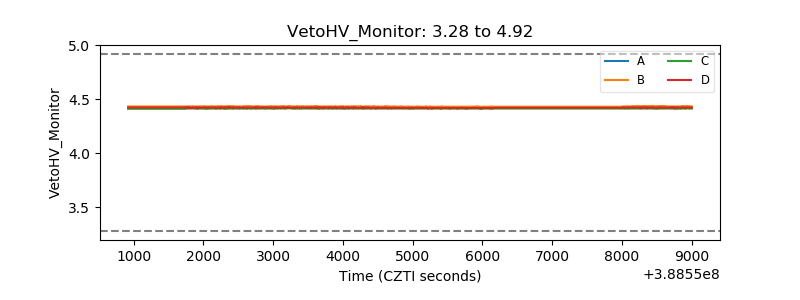 |
| Veto LLD | 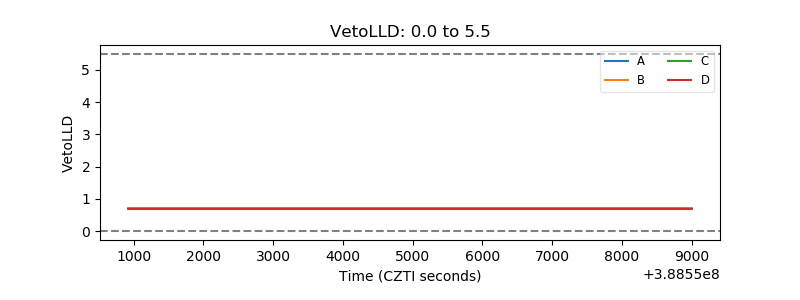 |
| Alpha Counter | 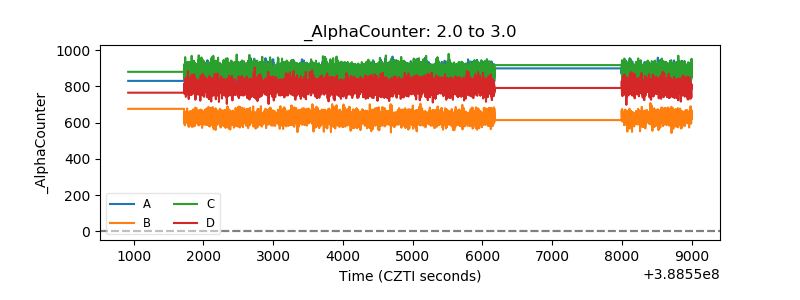 |
| _CPM_Rate | 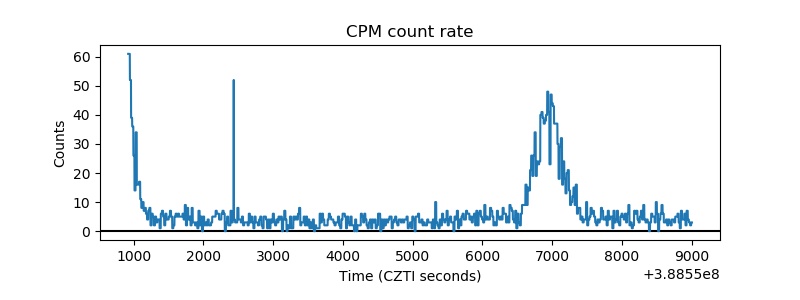 |
| CZT Counter | 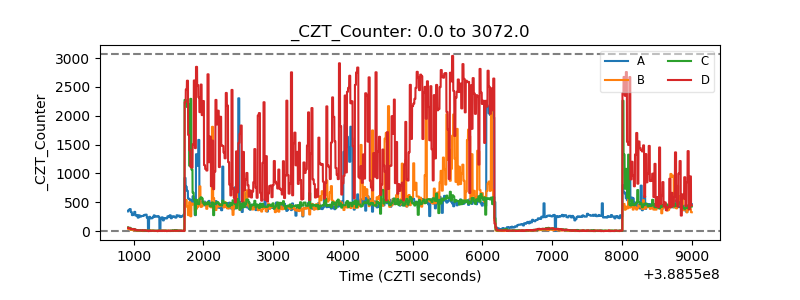 |
| +2.5 Volts monitor | 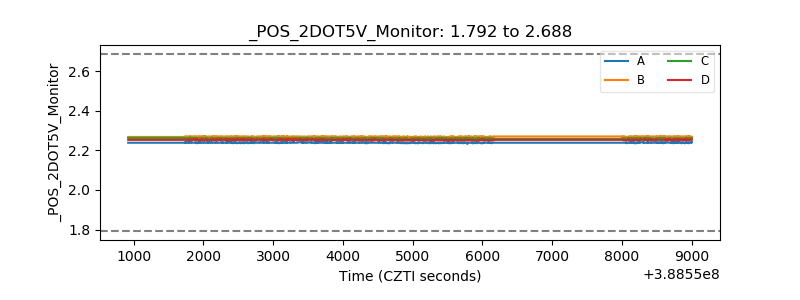 |
| +5 Volts monitor | 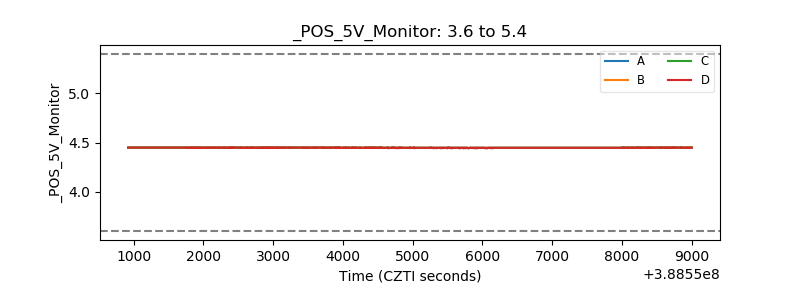 |
| _ROLL_ROT | 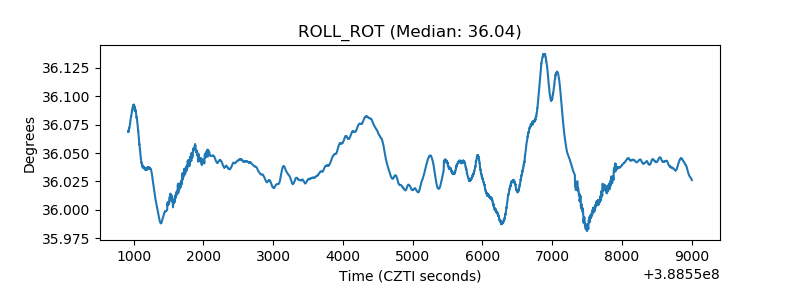 |
| _Roll_DEC | 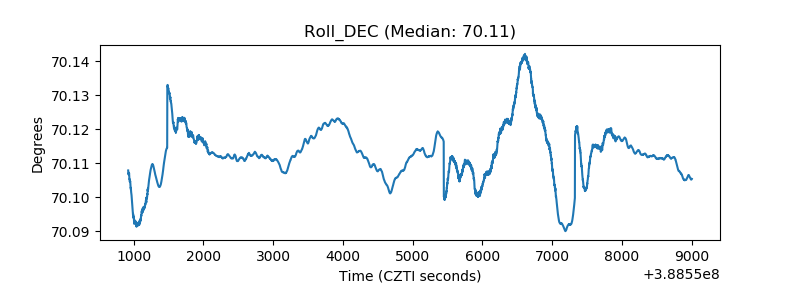 |
| _Roll_RA | 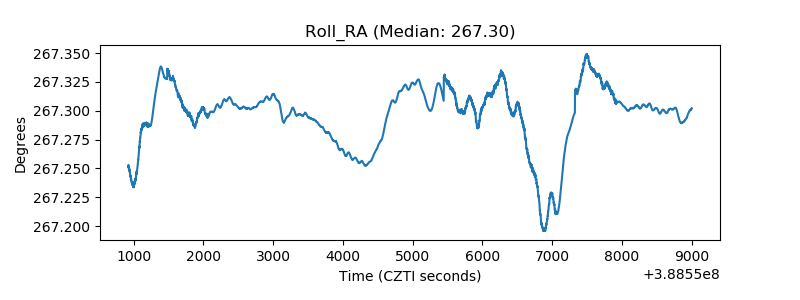 |
| Veto Counter | 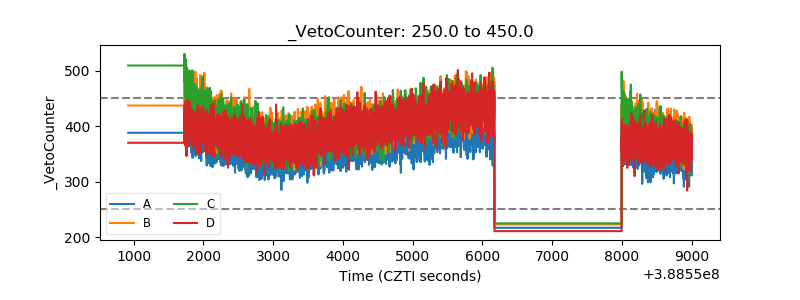 |