| Param | Original file | Final file |
|---|---|---|
| Filename | modeM0/AS1A11_097T09_9000005086_35538cztM0_level2.evt | modeM0/AS1A11_097T09_9000005086_35538cztM0_level2_quad_clean.evt |
| Size (bytes) | 394,977,600 | 61,513,920 |
| Size | 376.7 MB | 58.7 MB |
| Events in quadrant A | 2,488,179 | 389,731 |
| Events in quadrant B | 2,588,389 | 400,566 |
| Events in quadrant C | 2,945,545 | 380,674 |
| Events in quadrant D | 3,610,204 | 351,240 |
| Mode SS | |||
|---|---|---|---|
| Quadrant | BADHDUFLAG | Total packets | Discarded packets |
| A | 0 | 100 | 0 |
| B | 0 | 100 | 0 |
| C | 0 | 100 | 0 |
| D | 0 | 100 | 0 |
| Mode M0 | |||
|---|---|---|---|
| Quadrant | BADHDUFLAG | Total packets | Discarded packets |
| A | 0 | 10254 | 2 |
| B | 0 | 10636 | 2 |
| C | 0 | 11498 | 2 |
| D | 0 | 13894 | 2 |
| Mode M9 | |||
|---|---|---|---|
| Quadrant | BADHDUFLAG | Total packets | Discarded packets |
| A | 0 | 34 | 0 |
| B | 0 | 34 | 0 |
| C | 0 | 34 | 0 |
| D | 0 | 35 | 0 |
| Quadrant | Total seconds | Saturated seconds | Saturation percentage |
|---|---|---|---|
| A | 4846 | 14 | 0.288898% |
| B | 4846 | 26 | 0.536525% |
| C | 4846 | 94 | 1.939744% |
| D | 4846 | 160 | 3.301692% |
Noise dominated data is calculated using 1-second bins in cleaned event files. If a bin has >2000 counts, and if more than 50% of those come from <1% of pixels, then it is considered to be noise-dominated and hence unusable.
| Quadrant | # 1 sec bins | Bins with >0 counts | Bins with >2000 counts | High rate bins dominated by noise | Noise dominated (total time) | Noise dominated (detector-on time) | Marked lightcurve |
|---|---|---|---|---|---|---|---|
| A | 6970 | 4847 | 4 | 4 | 0.06% | 0.08% | 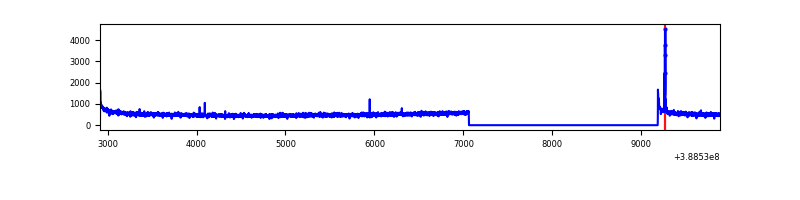 |
| B | 6970 | 4847 | 17 | 17 | 0.24% | 0.35% | 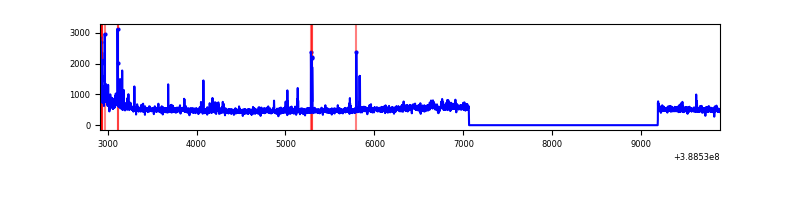 |
| C | 6970 | 4847 | 77 | 77 | 1.10% | 1.59% | 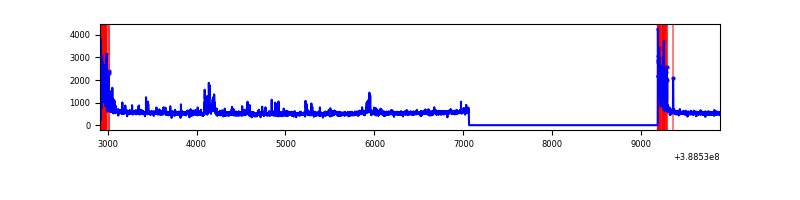 |
| D | 6970 | 4847 | 170 | 170 | 2.44% | 3.51% | 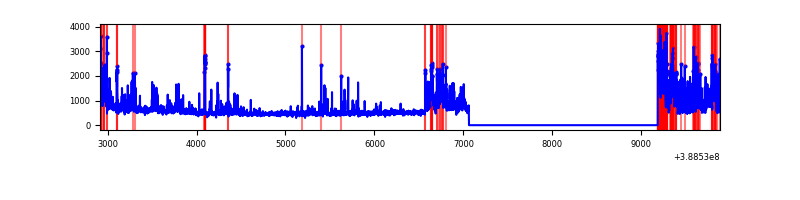 |
Top three noisy pixels from each quadrant. If the there are fewer than three noisy pixels in the level2.evt file, extra rows are filled as -1
| Pixel properties | Quadrant properties | ||||||
|---|---|---|---|---|---|---|---|
| Quadrant | DetID | PixID | Counts | Sigma | Mean | Median | Sigma |
| A | 10 | 83 | 125466 | 1039.8 | 599 | 589 | 120.1 |
| A | 9 | 143 | 22771 | 184.7 | 599 | 589 | 120.1 |
| A | 15 | 169 | 22477 | 182.25 | 599 | 589 | 120.1 |
| B | 5 | 255 | 72692 | 635.62 | 600 | 585 | 113.4 |
| B | 5 | 236 | 66766 | 583.38 | 600 | 585 | 113.4 |
| B | 5 | 172 | 47579 | 414.25 | 600 | 585 | 113.4 |
| C | 0 | 10 | 337315 | 2491.27 | 581 | 587 | 135.2 |
| C | 15 | 214 | 216654 | 1598.57 | 581 | 587 | 135.2 |
| C | 0 | 207 | 81772 | 600.65 | 581 | 587 | 135.2 |
| D | 12 | 235 | 960875 | 6873.54 | 570 | 554 | 139.7 |
| D | 8 | 195 | 203161 | 1450.17 | 570 | 554 | 139.7 |
| D | 2 | 250 | 123244 | 878.16 | 570 | 554 | 139.7 |
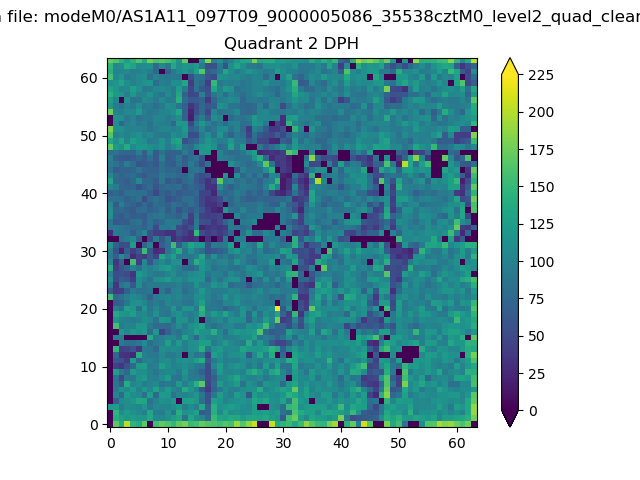
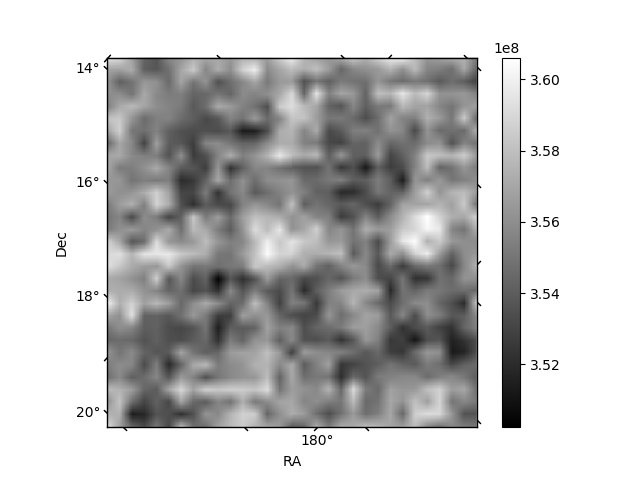
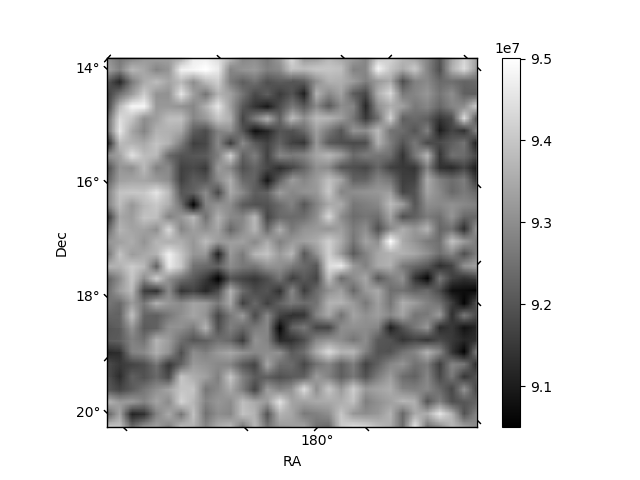
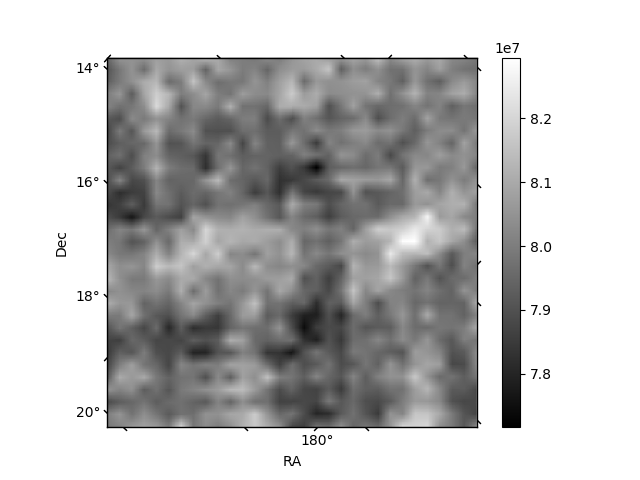
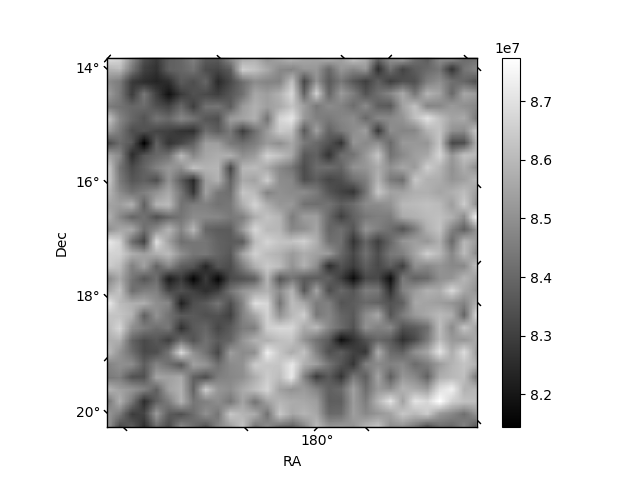
Histogram calculated using DETX and DETY for each event in the final _common_clean file
| Quadrant A | 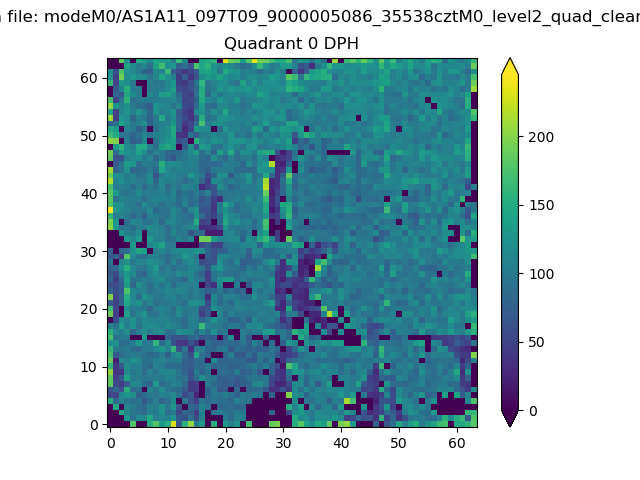 |
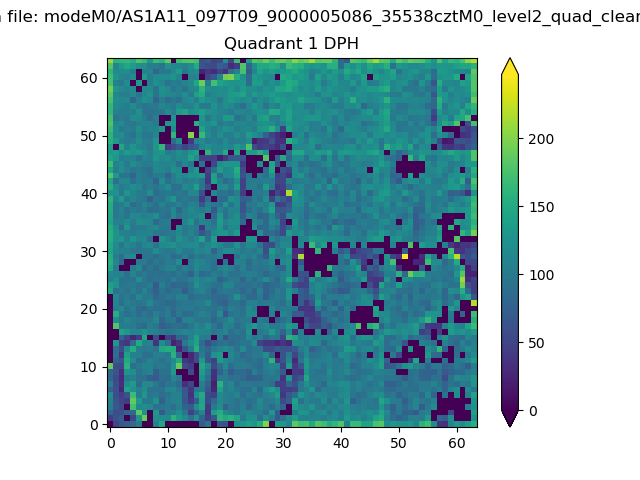 |
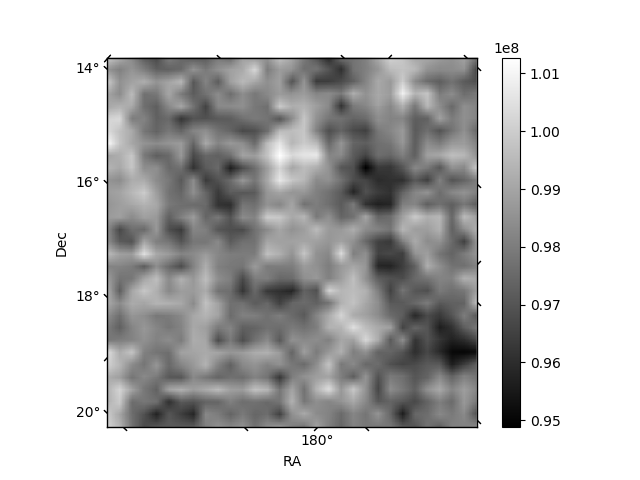
Quadrant B |
|---|---|---|---|
| Quadrant D | 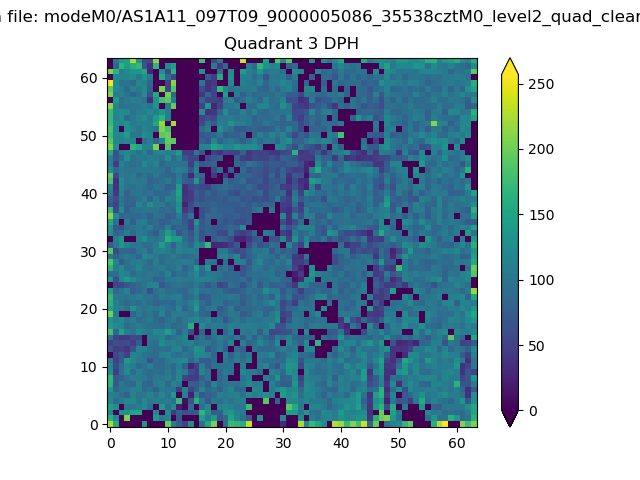 |
 |
Quadrant C |
| Plot type | Count rate plots | Images |
|---|---|---|
| Comparison with Poisson distribution Blue bars denote a histogram of data divided into 1 sec bins. Red curve is a Poisson curve with rate = median count rate of data. |
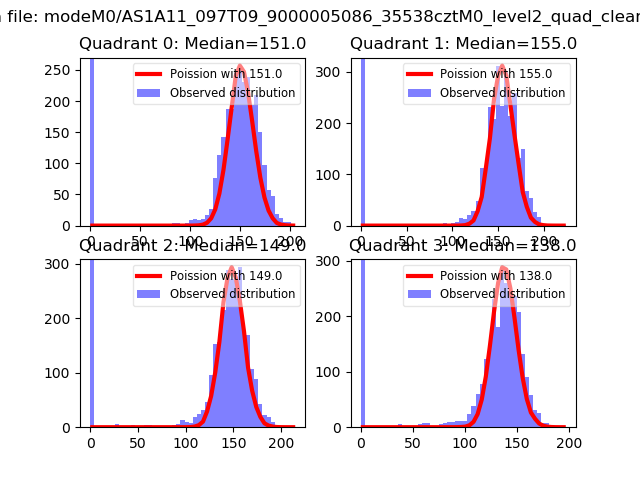 |
 |
| Quadrant-wise count rates Data is divided into 100 sec bins |
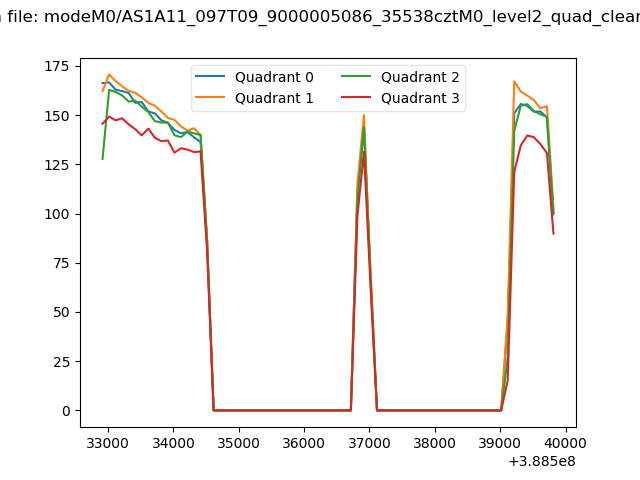 |
|
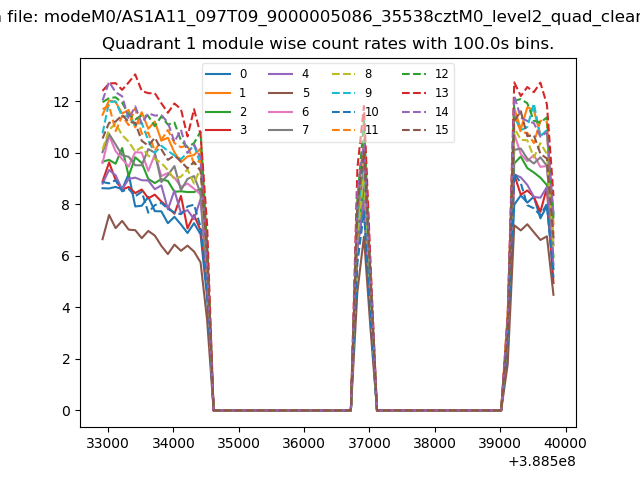
| Module-wise count rates for Quadrant A Data is divided into 100 sec bins |
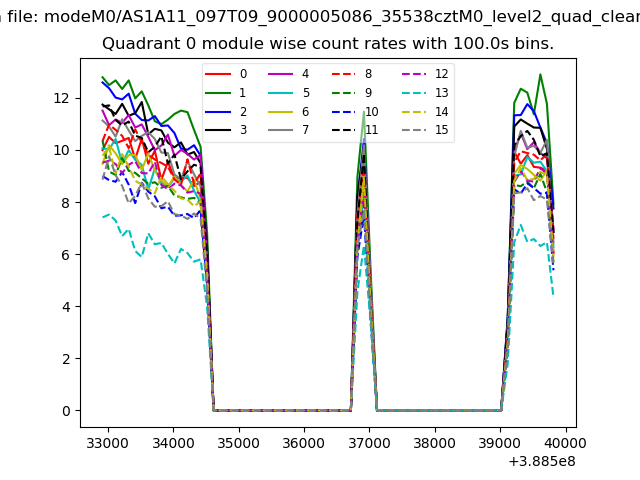 |
 |
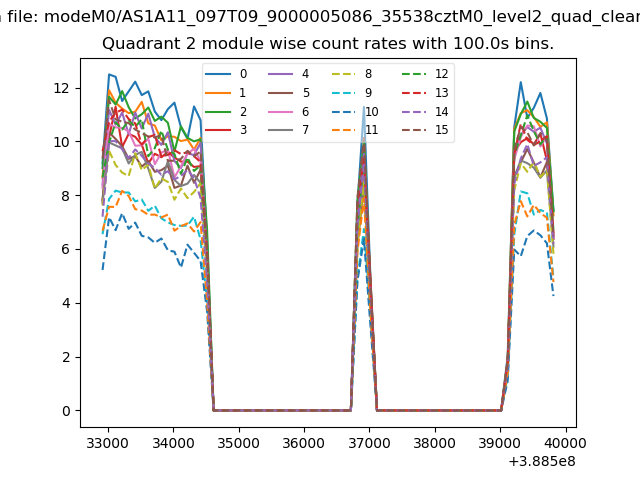
| Module-wise count rates for Quadrant B Data is divided into 100 sec bins |
 |
 |
| Module-wise count rates for Quadrant C Data is divided into 100 sec bins |
 |
 |
| Module-wise count rates for Quadrant D Data is divided into 100 sec bins |
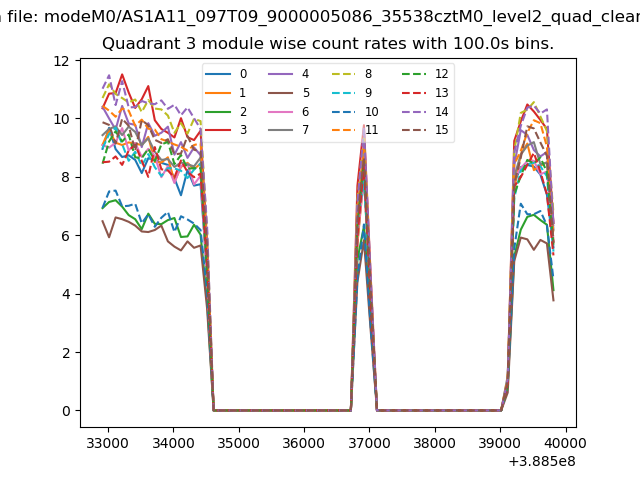 |
 |
| Parameter | Plot |
|---|---|
| CZT HV Monitor | 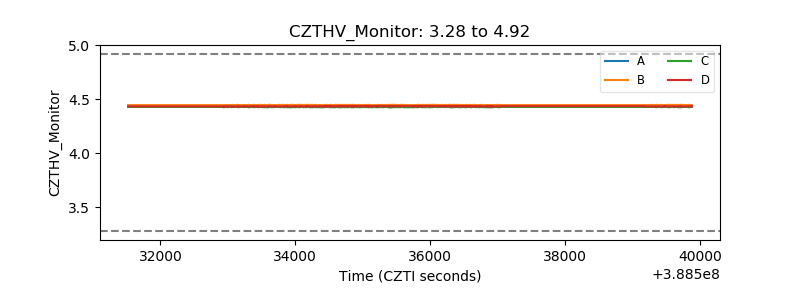 |
| D_VDD | 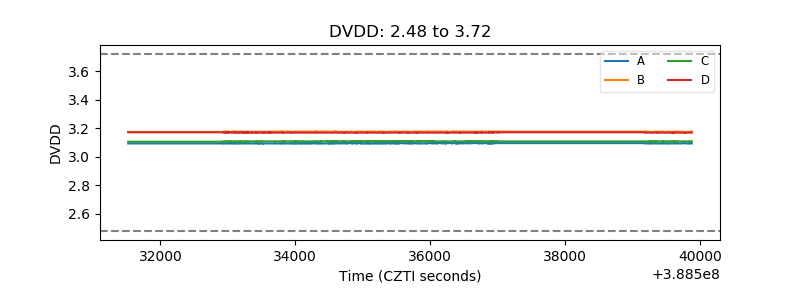 |
| Temperature 1 | 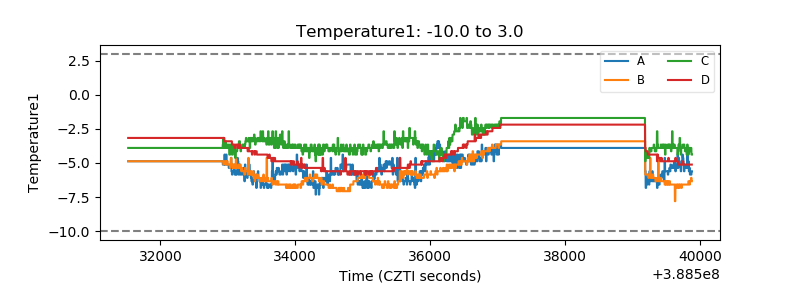 |
| Veto HV Monitor | 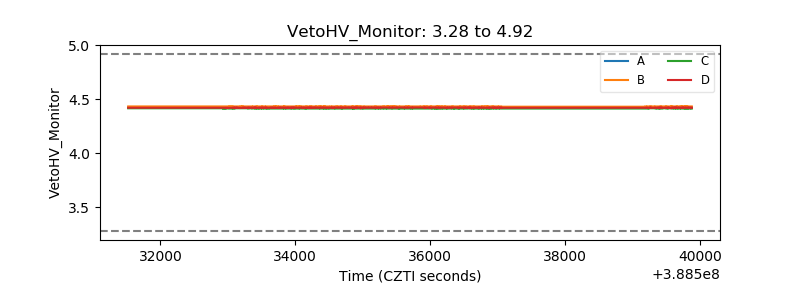 |
| Veto LLD | 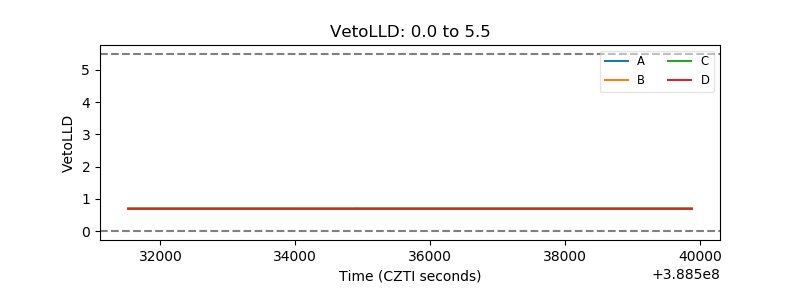 |
| Alpha Counter | 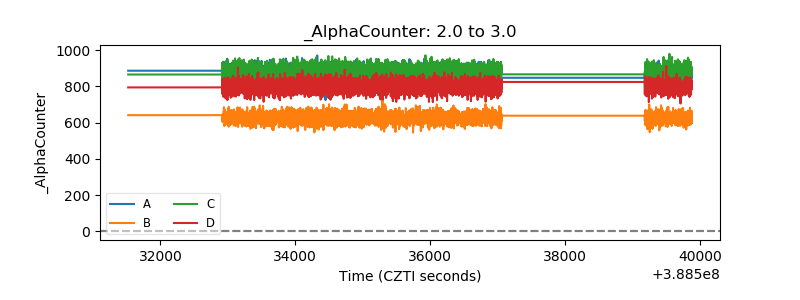 |
| _CPM_Rate | 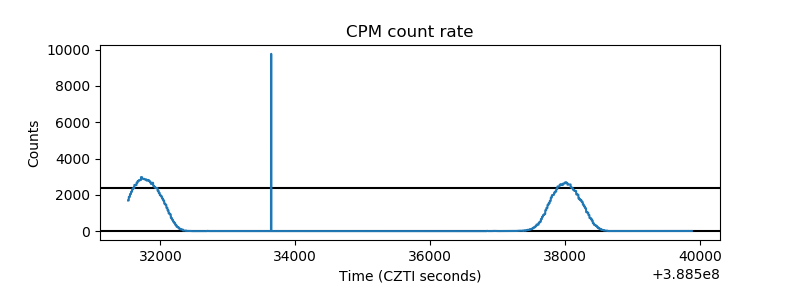 |
| CZT Counter | 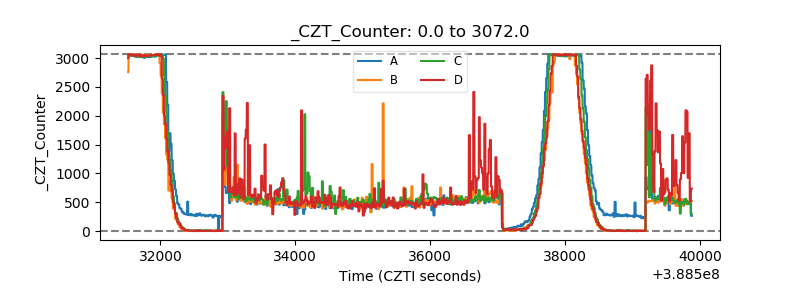 |
| +2.5 Volts monitor |  |
| +5 Volts monitor | 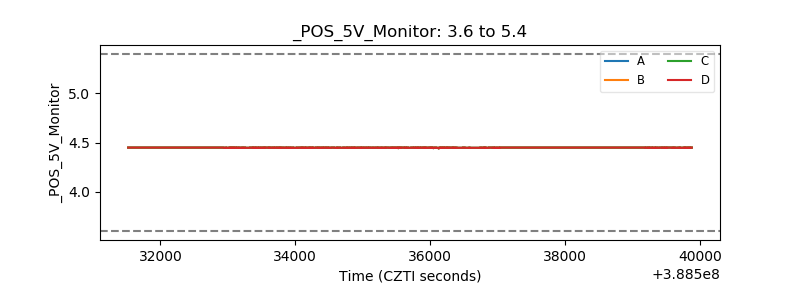 |
| _ROLL_ROT | 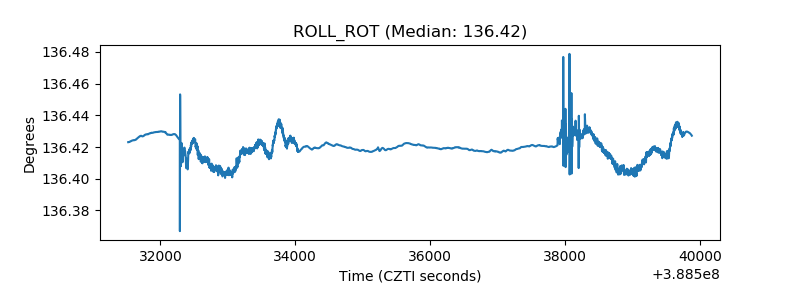 |
| _Roll_DEC | 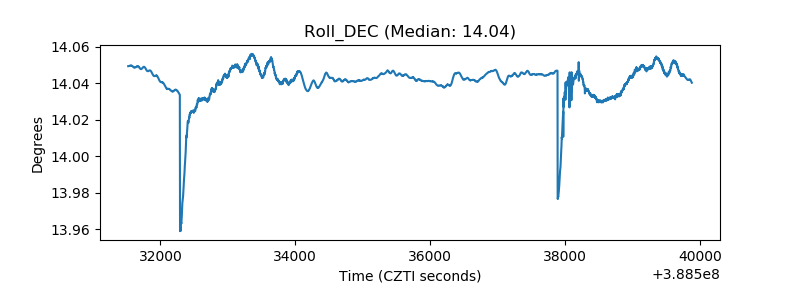 |
| _Roll_RA | 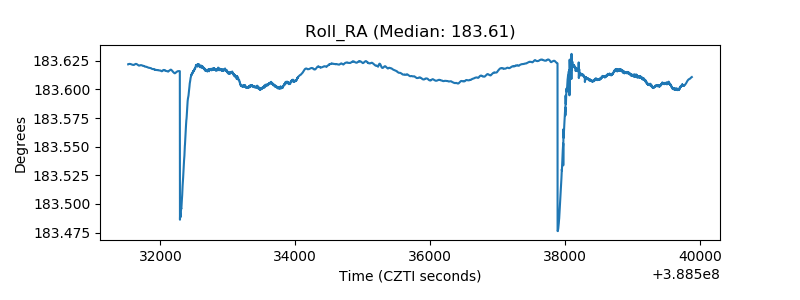 |
| Veto Counter | 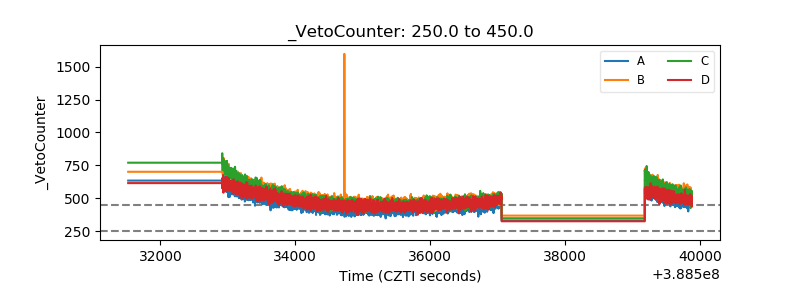 |