| Param | Original file | Final file |
|---|---|---|
| Filename | modeM0/AS1A11_097T09_9000005086_35535cztM0_level2.evt | modeM0/AS1A11_097T09_9000005086_35535cztM0_level2_quad_clean.evt |
| Size (bytes) | 453,104,640 | 73,200,960 |
| Size | 432.1 MB | 69.8 MB |
| Events in quadrant A | 2,804,883 | 469,406 |
| Events in quadrant B | 3,316,513 | 471,466 |
| Events in quadrant C | 3,638,350 | 458,897 |
| Events in quadrant D | 3,594,341 | 436,999 |
| Mode SS | |||
|---|---|---|---|
| Quadrant | BADHDUFLAG | Total packets | Discarded packets |
| A | 0 | 112 | 0 |
| B | 0 | 112 | 0 |
| C | 0 | 112 | 0 |
| D | 0 | 112 | 0 |
| Mode M0 | |||
|---|---|---|---|
| Quadrant | BADHDUFLAG | Total packets | Discarded packets |
| A | 0 | 11597 | 3 |
| B | 0 | 13185 | 2 |
| C | 0 | 14173 | 2 |
| D | 0 | 14204 | 2 |
| Mode M9 | |||
|---|---|---|---|
| Quadrant | BADHDUFLAG | Total packets | Discarded packets |
| A | 0 | 37 | 0 |
| B | 0 | 37 | 0 |
| C | 0 | 37 | 0 |
| D | 0 | 37 | 0 |
| Quadrant | Total seconds | Saturated seconds | Saturation percentage |
|---|---|---|---|
| A | 5424 | 10 | 0.184366% |
| B | 5424 | 168 | 3.097345% |
| C | 5424 | 174 | 3.207965% |
| D | 5424 | 155 | 2.857670% |
Noise dominated data is calculated using 1-second bins in cleaned event files. If a bin has >2000 counts, and if more than 50% of those come from <1% of pixels, then it is considered to be noise-dominated and hence unusable.
| Quadrant | # 1 sec bins | Bins with >0 counts | Bins with >2000 counts | High rate bins dominated by noise | Noise dominated (total time) | Noise dominated (detector-on time) | Marked lightcurve |
|---|---|---|---|---|---|---|---|
| A | 9100 | 5426 | 2 | 2 | 0.02% | 0.04% | 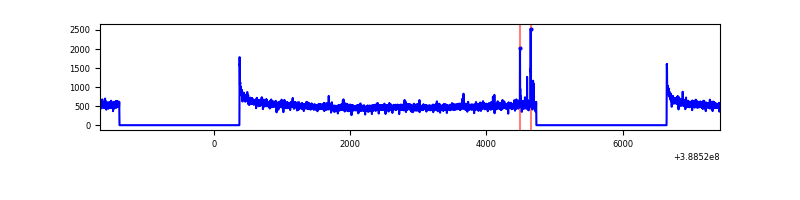 |
| B | 9100 | 5426 | 162 | 162 | 1.78% | 2.99% | 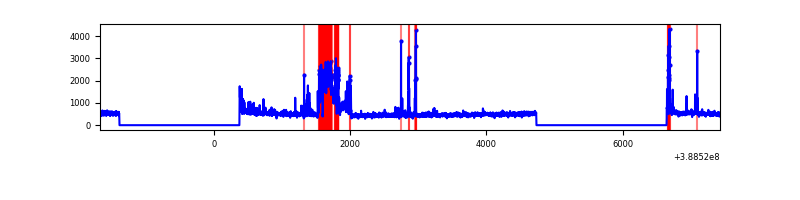 |
| C | 9100 | 5426 | 141 | 141 | 1.55% | 2.60% | 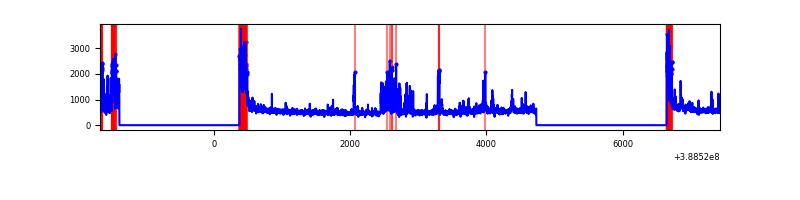 |
| D | 9100 | 5426 | 133 | 133 | 1.46% | 2.45% | 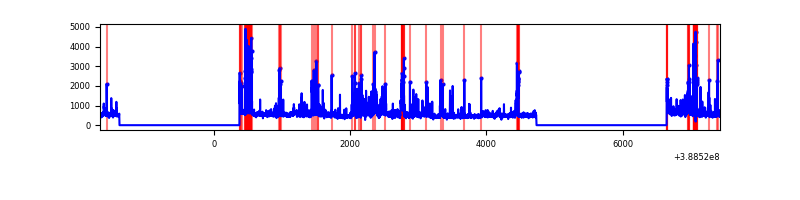 |
Top three noisy pixels from each quadrant. If the there are fewer than three noisy pixels in the level2.evt file, extra rows are filled as -1
| Pixel properties | Quadrant properties | ||||||
|---|---|---|---|---|---|---|---|
| Quadrant | DetID | PixID | Counts | Sigma | Mean | Median | Sigma |
| A | 10 | 83 | 135422 | 1020.66 | 657 | 646 | 132.0 |
| A | 15 | 169 | 110508 | 831.99 | 657 | 646 | 132.0 |
| A | 9 | 143 | 19213 | 140.61 | 657 | 646 | 132.0 |
| B | 5 | 236 | 600458 | 4867.09 | 649 | 631 | 123.2 |
| B | 5 | 172 | 107026 | 863.31 | 649 | 631 | 123.2 |
| B | 5 | 255 | 41465 | 331.33 | 649 | 631 | 123.2 |
| C | 0 | 10 | 389821 | 2659.97 | 636 | 641 | 146.3 |
| C | 15 | 159 | 353780 | 2413.64 | 636 | 641 | 146.3 |
| C | 15 | 214 | 228415 | 1556.79 | 636 | 641 | 146.3 |
| D | 12 | 235 | 309775 | 2008.37 | 632 | 615 | 153.9 |
| D | 13 | 249 | 242306 | 1570.08 | 632 | 615 | 153.9 |
| D | 8 | 195 | 201998 | 1308.23 | 632 | 615 | 153.9 |
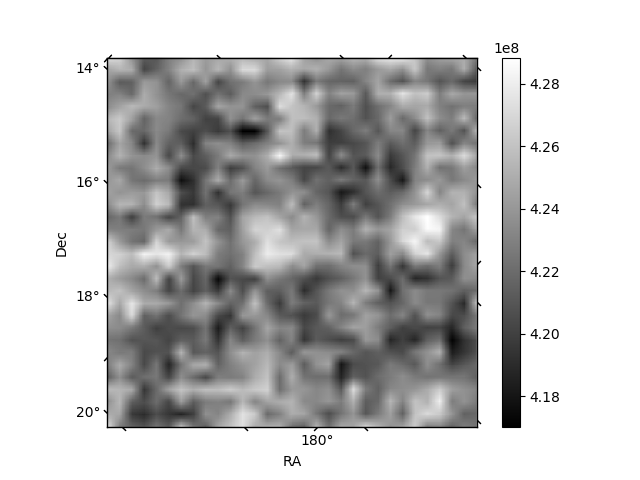
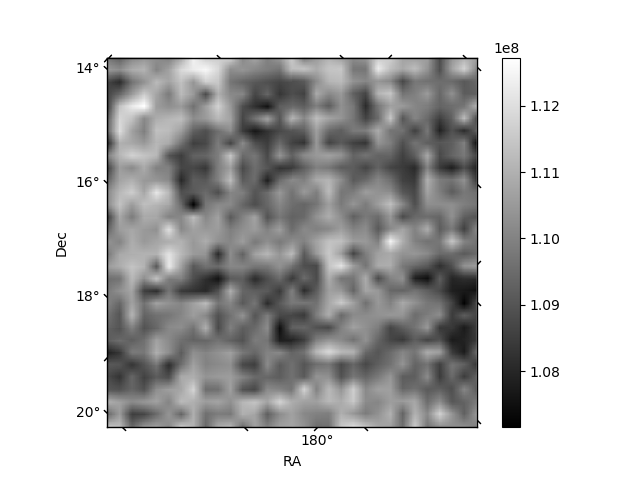
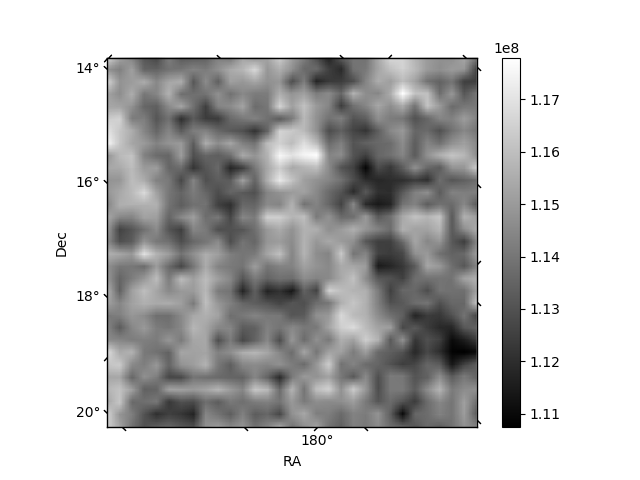
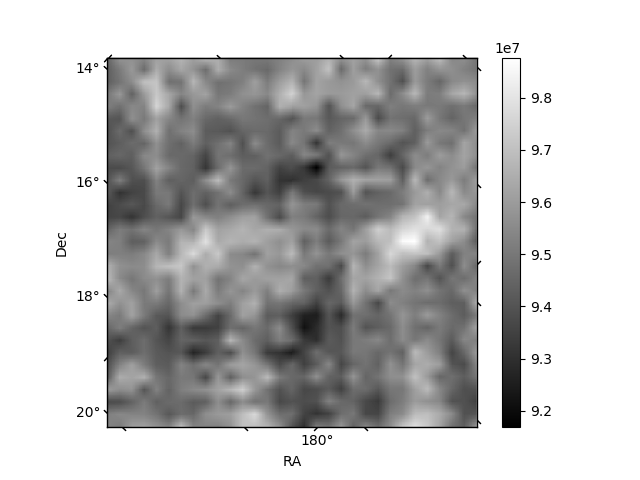
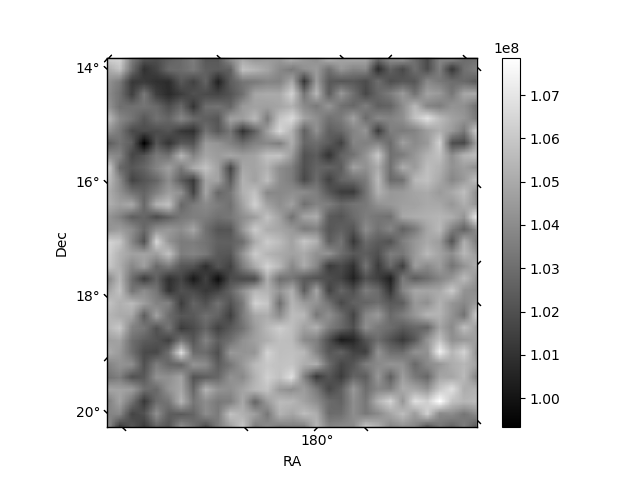
Histogram calculated using DETX and DETY for each event in the final _common_clean file
| Quadrant A | 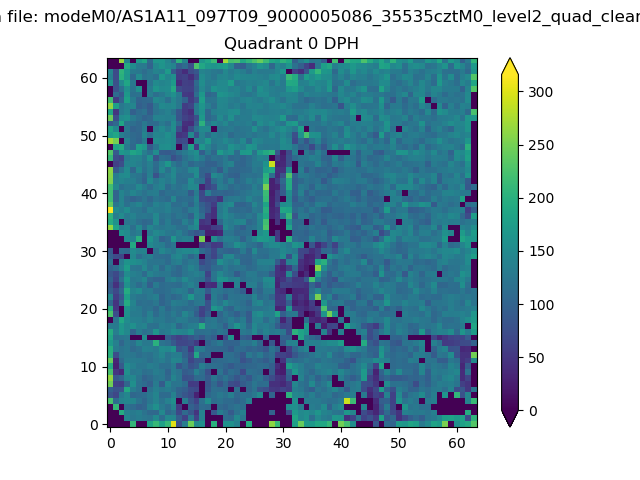 |
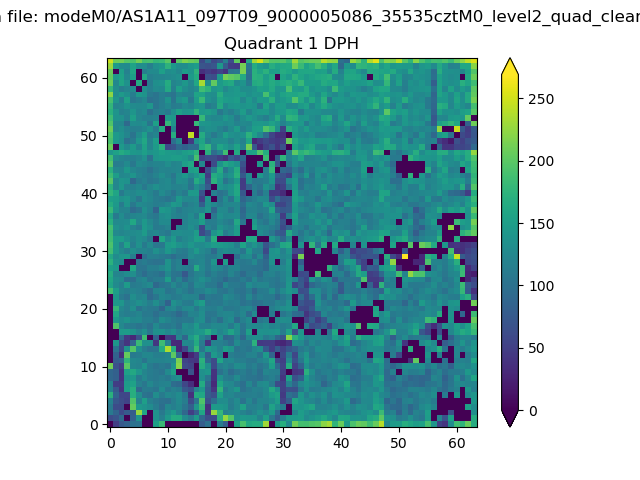 |
Quadrant B |
|---|---|---|---|
| Quadrant D | 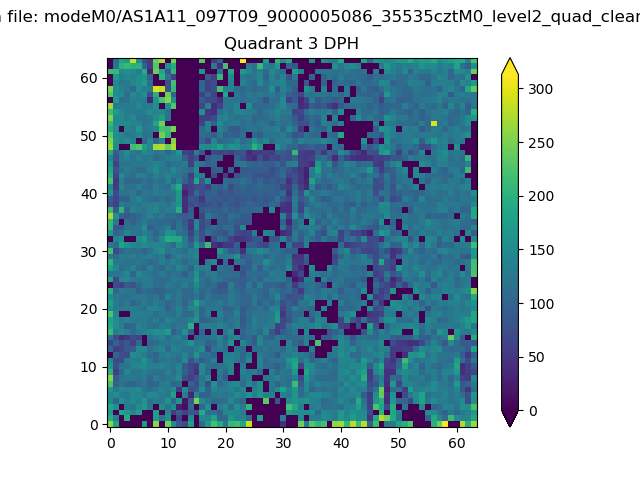 |
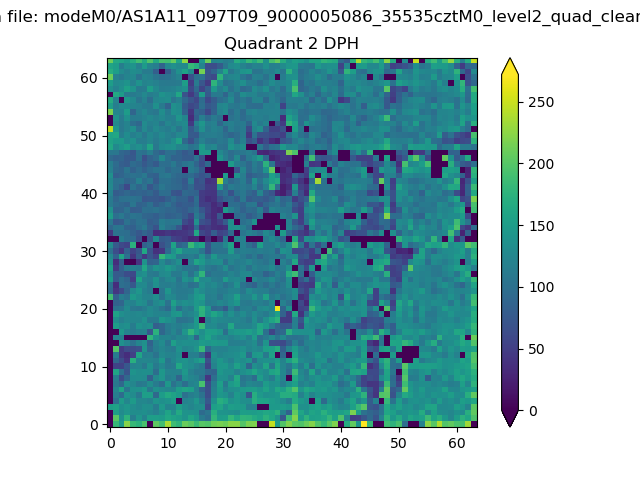 |
Quadrant C |
| Plot type | Count rate plots | Images |
|---|---|---|
| Comparison with Poisson distribution Blue bars denote a histogram of data divided into 1 sec bins. Red curve is a Poisson curve with rate = median count rate of data. |
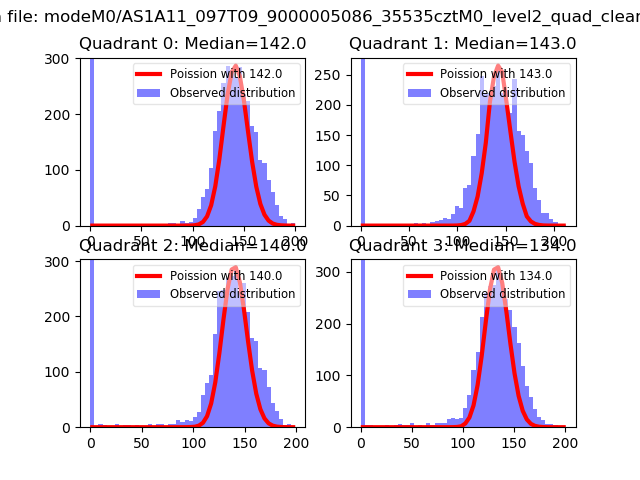 |
 |
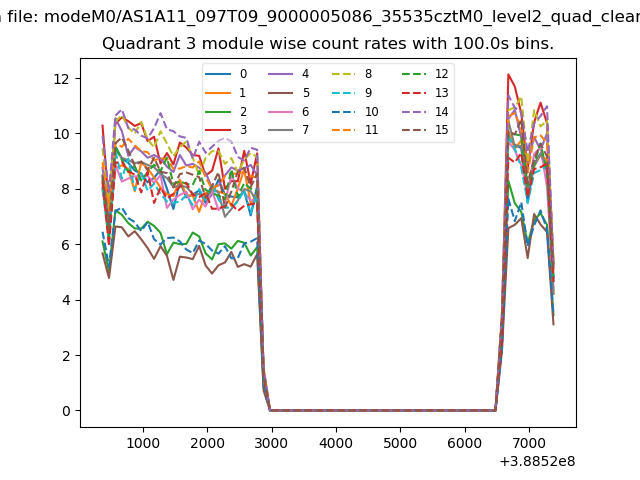
| Quadrant-wise count rates Data is divided into 100 sec bins |
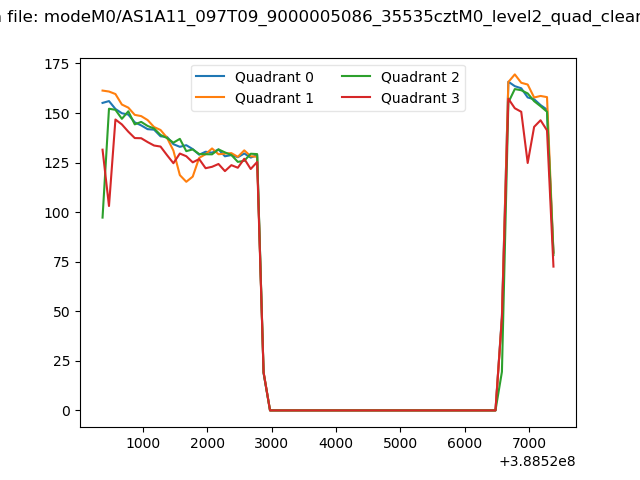 |
|
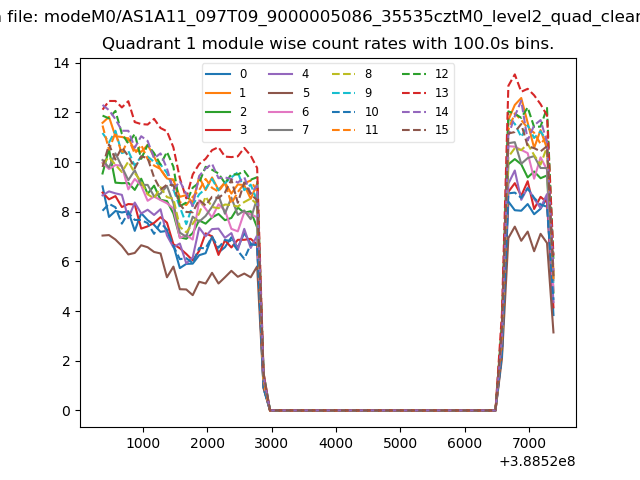
| Module-wise count rates for Quadrant A Data is divided into 100 sec bins |
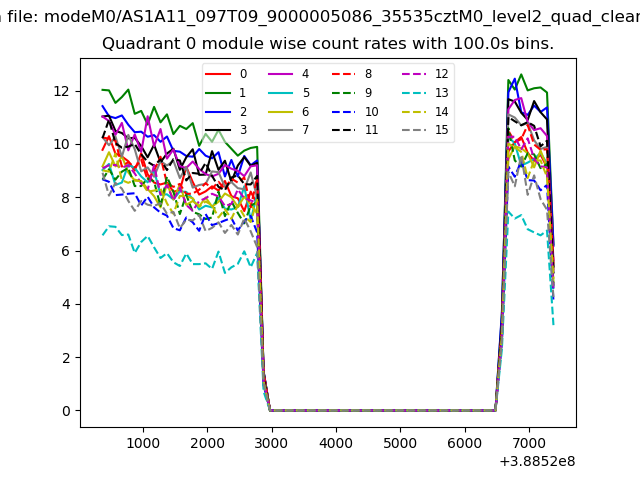 |
 |
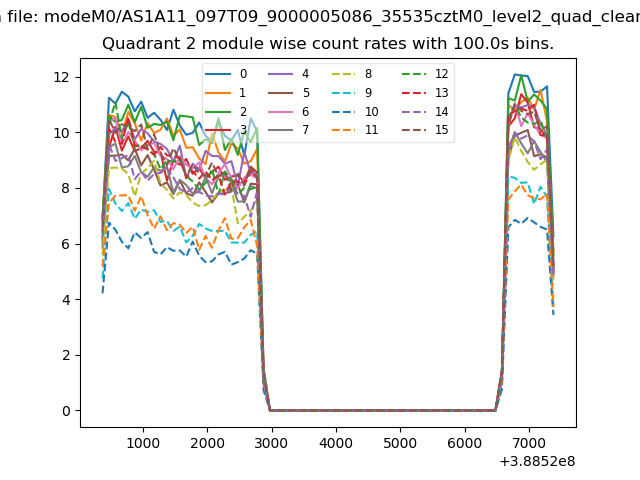
| Module-wise count rates for Quadrant B Data is divided into 100 sec bins |
 |
 |
| Module-wise count rates for Quadrant C Data is divided into 100 sec bins |
 |
 |
| Module-wise count rates for Quadrant D Data is divided into 100 sec bins |
 |
 |
| Parameter | Plot |
|---|---|
| CZT HV Monitor | 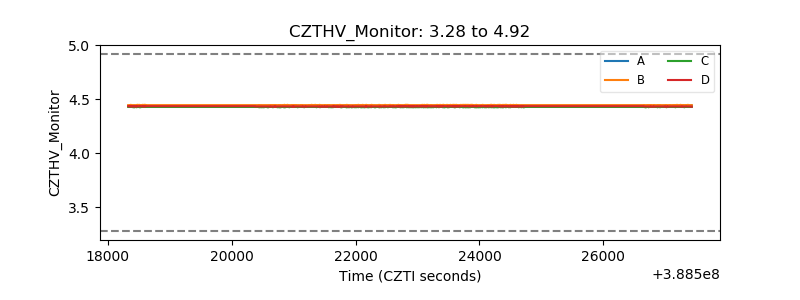 |
| D_VDD | 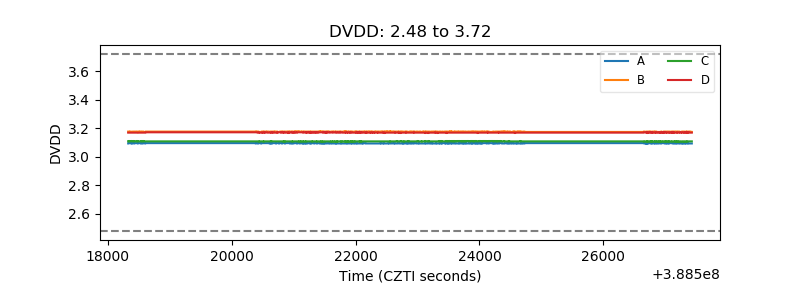 |
| Temperature 1 | 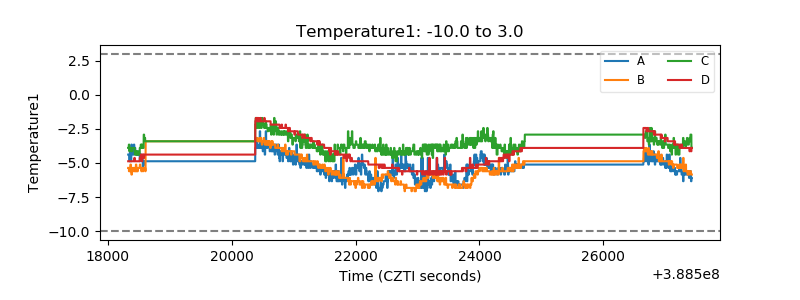 |
| Veto HV Monitor | 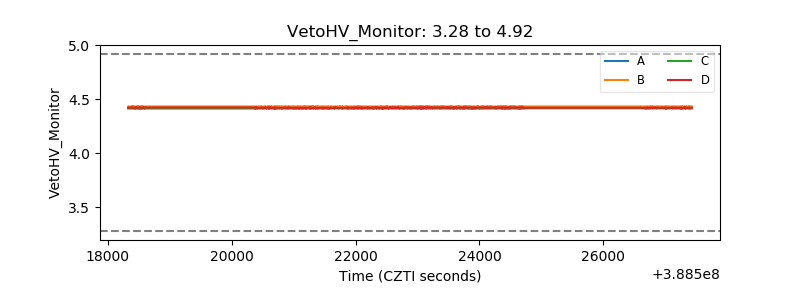 |
| Veto LLD | 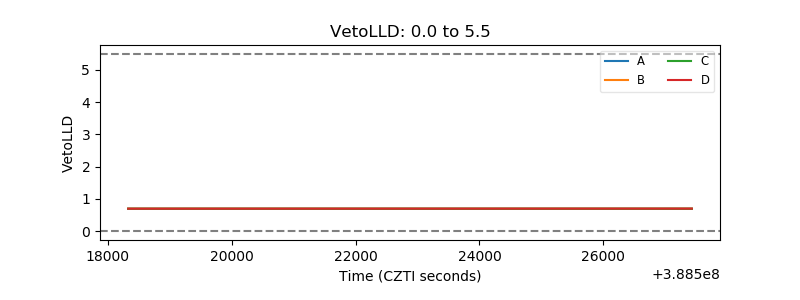 |
| Alpha Counter | 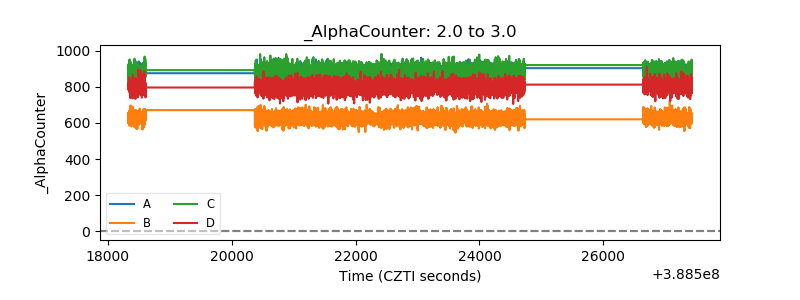 |
| _CPM_Rate | 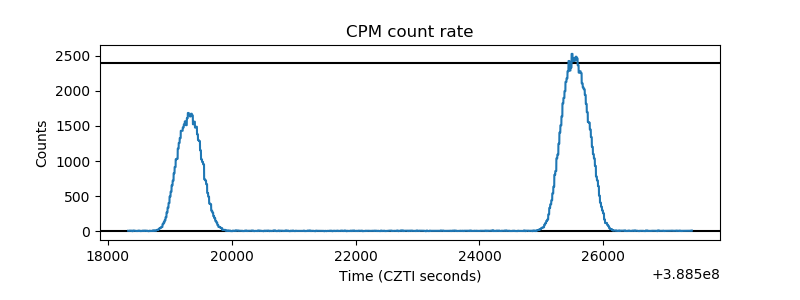 |
| CZT Counter | 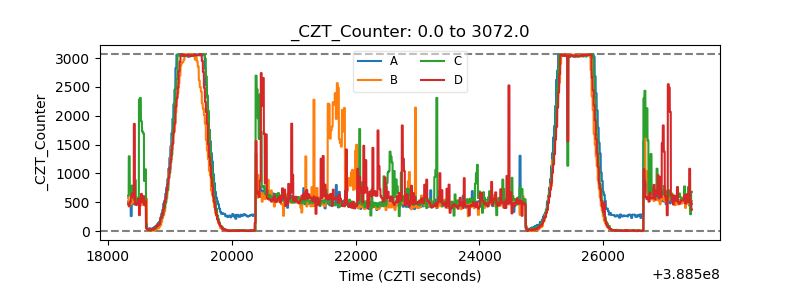 |
| +2.5 Volts monitor | 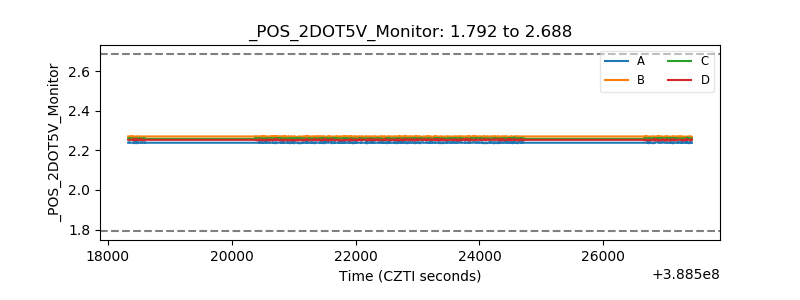 |
| +5 Volts monitor | 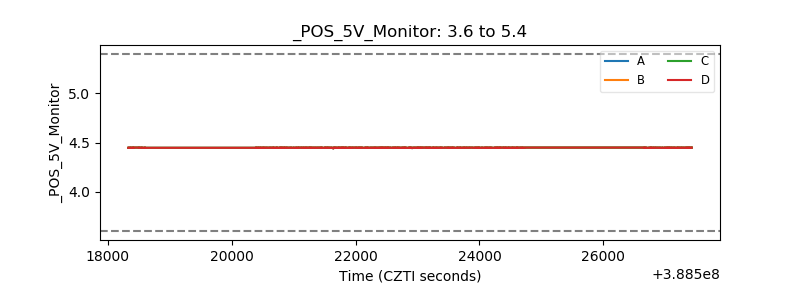 |
| _ROLL_ROT | 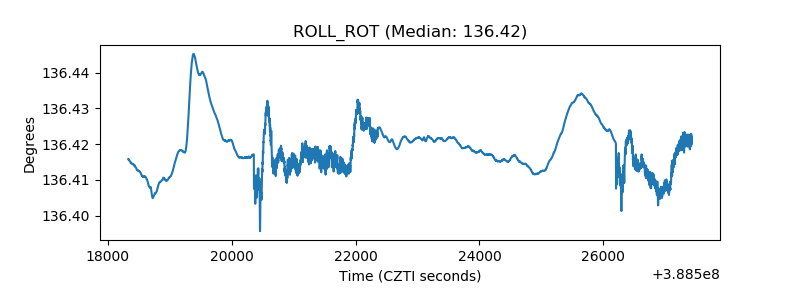 |
| _Roll_DEC | 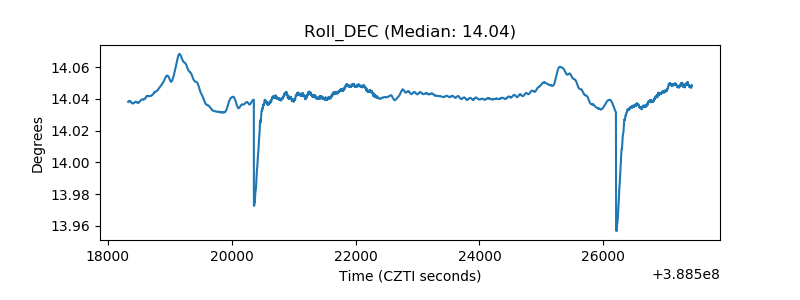 |
| _Roll_RA | 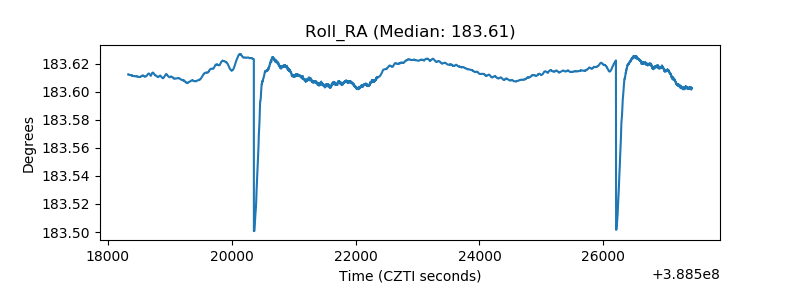 |
| Veto Counter | 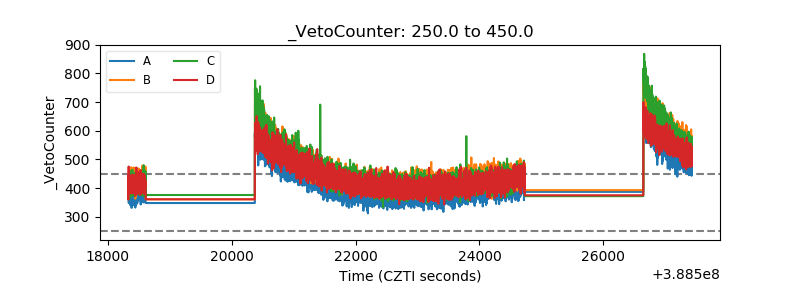 |