| Param | Original file | Final file |
|---|---|---|
| Filename | modeM0/AS1A11_097T09_9000005086_35534cztM0_level2.evt | modeM0/AS1A11_097T09_9000005086_35534cztM0_level2_quad_clean.evt |
| Size (bytes) | 448,289,280 | 78,108,480 |
| Size | 427.5 MB | 74.5 MB |
| Events in quadrant A | 2,702,724 | 506,524 |
| Events in quadrant B | 2,747,729 | 512,057 |
| Events in quadrant C | 4,406,951 | 494,380 |
| Events in quadrant D | 3,355,211 | 477,175 |
| Mode SS | |||
|---|---|---|---|
| Quadrant | BADHDUFLAG | Total packets | Discarded packets |
| A | 0 | 110 | 0 |
| B | 0 | 110 | 0 |
| C | 0 | 110 | 0 |
| D | 0 | 110 | 0 |
| Mode M0 | |||
|---|---|---|---|
| Quadrant | BADHDUFLAG | Total packets | Discarded packets |
| A | 0 | 11406 | 3 |
| B | 0 | 11730 | 2 |
| C | 0 | 16532 | 2 |
| D | 0 | 13497 | 2 |
| Mode M9 | |||
|---|---|---|---|
| Quadrant | BADHDUFLAG | Total packets | Discarded packets |
| A | 0 | 30 | 0 |
| B | 0 | 30 | 0 |
| C | 0 | 30 | 0 |
| D | 0 | 31 | 0 |
| Quadrant | Total seconds | Saturated seconds | Saturation percentage |
|---|---|---|---|
| A | 5355 | 6 | 0.112045% |
| B | 5355 | 36 | 0.672269% |
| C | 5355 | 430 | 8.029879% |
| D | 5355 | 117 | 2.184874% |
Noise dominated data is calculated using 1-second bins in cleaned event files. If a bin has >2000 counts, and if more than 50% of those come from <1% of pixels, then it is considered to be noise-dominated and hence unusable.
| Quadrant | # 1 sec bins | Bins with >0 counts | Bins with >2000 counts | High rate bins dominated by noise | Noise dominated (total time) | Noise dominated (detector-on time) | Marked lightcurve |
|---|---|---|---|---|---|---|---|
| A | 7118 | 5356 | 0 | 0 | 0.00% | 0.00% | 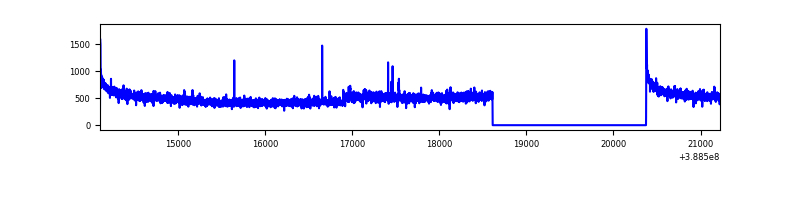 |
| B | 7118 | 5356 | 16 | 16 | 0.22% | 0.30% | 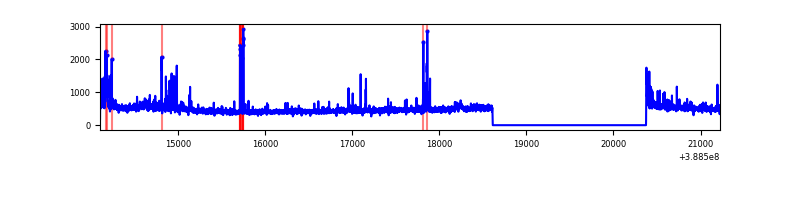 |
| C | 7118 | 5356 | 419 | 419 | 5.89% | 7.82% | 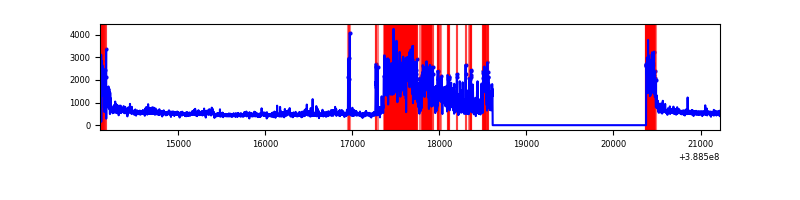 |
| D | 7118 | 5356 | 86 | 86 | 1.21% | 1.61% | 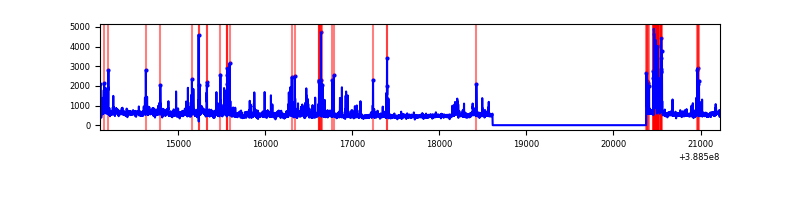 |
Top three noisy pixels from each quadrant. If the there are fewer than three noisy pixels in the level2.evt file, extra rows are filled as -1
| Pixel properties | Quadrant properties | ||||||
|---|---|---|---|---|---|---|---|
| Quadrant | DetID | PixID | Counts | Sigma | Mean | Median | Sigma |
| A | 10 | 83 | 134303 | 1040.88 | 633 | 623 | 128.4 |
| A | 15 | 169 | 119164 | 923.0 | 633 | 623 | 128.4 |
| A | 13 | 254 | 7259 | 51.67 | 633 | 623 | 128.4 |
| B | 5 | 236 | 174598 | 1452.39 | 626 | 609 | 119.8 |
| B | 5 | 255 | 35920 | 294.76 | 626 | 609 | 119.8 |
| B | 5 | 207 | 31416 | 257.16 | 626 | 609 | 119.8 |
| C | 15 | 159 | 1314752 | 9300.79 | 606 | 610 | 141.3 |
| C | 0 | 10 | 375198 | 2651.13 | 606 | 610 | 141.3 |
| C | 15 | 214 | 221908 | 1566.23 | 606 | 610 | 141.3 |
| D | 8 | 195 | 246663 | 1638.19 | 614 | 597 | 150.2 |
| D | 12 | 235 | 222567 | 1477.77 | 614 | 597 | 150.2 |
| D | 13 | 249 | 221322 | 1469.48 | 614 | 597 | 150.2 |
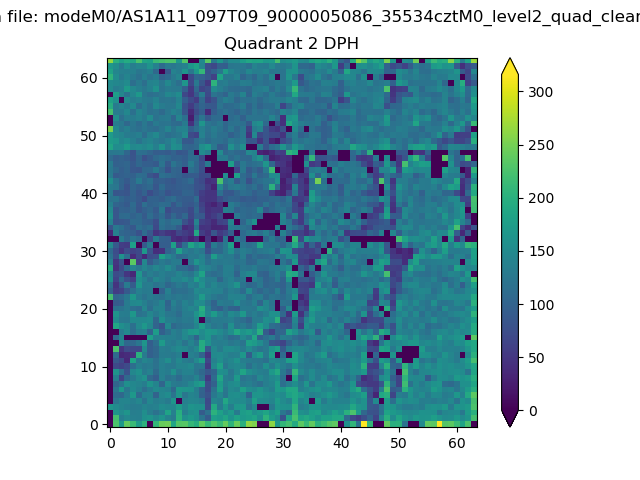
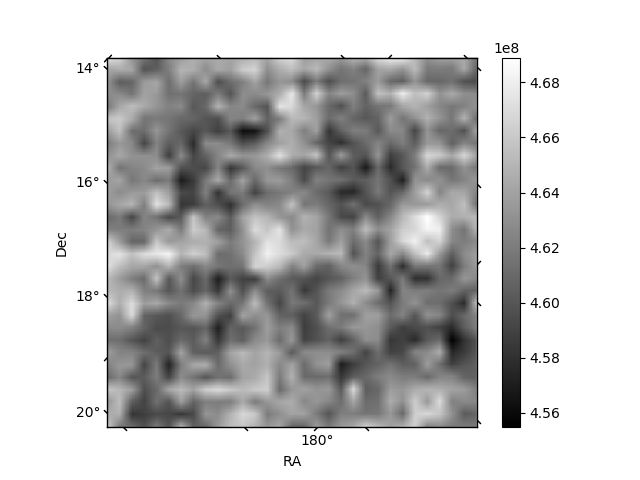
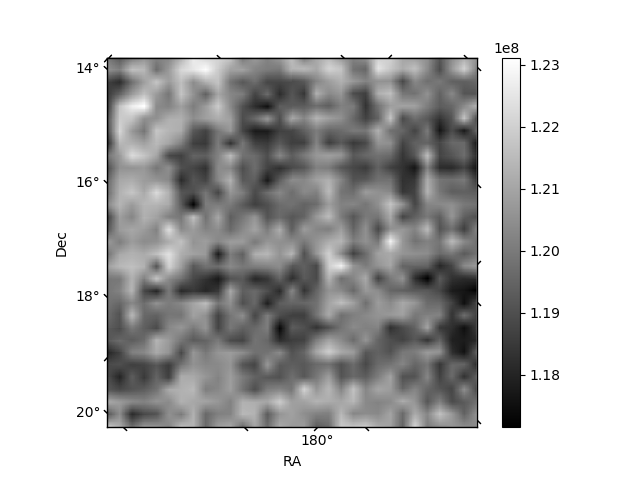
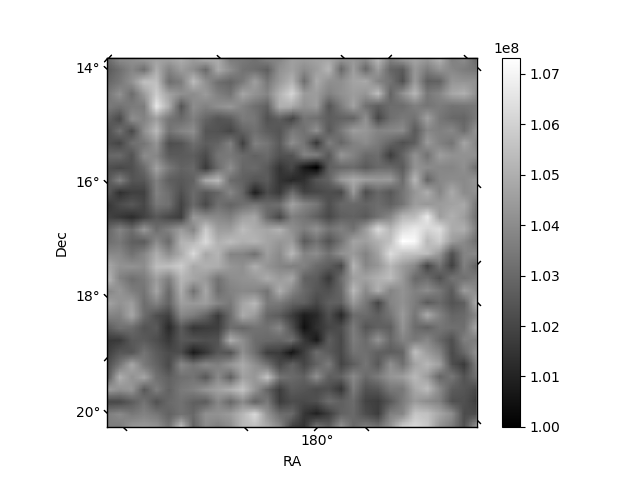
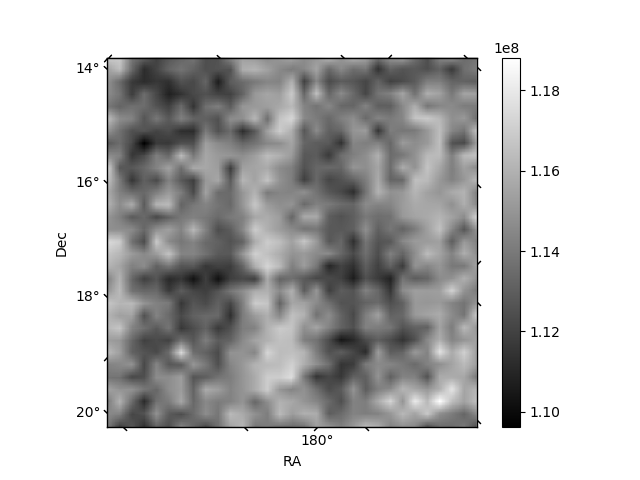
Histogram calculated using DETX and DETY for each event in the final _common_clean file
| Quadrant A | 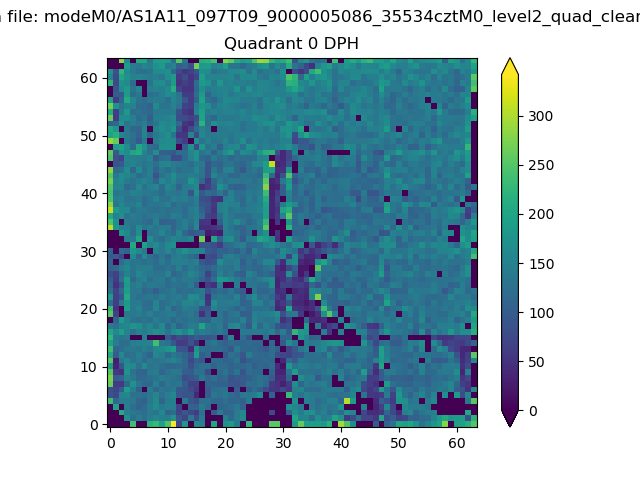 |
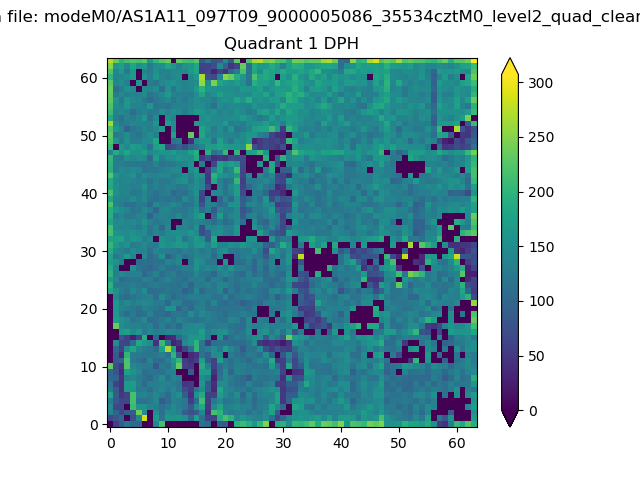 |
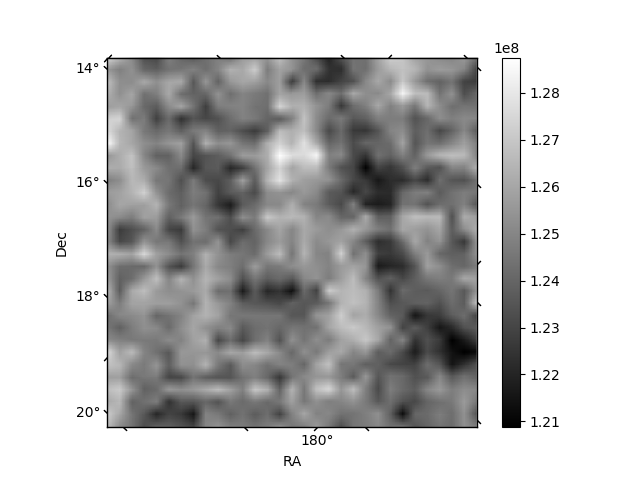
Quadrant B |
|---|---|---|---|
| Quadrant D | 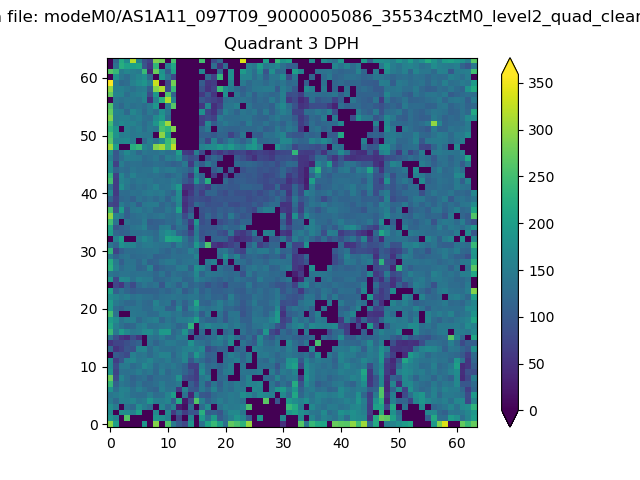 |
 |
Quadrant C |
| Plot type | Count rate plots | Images |
|---|---|---|
| Comparison with Poisson distribution Blue bars denote a histogram of data divided into 1 sec bins. Red curve is a Poisson curve with rate = median count rate of data. |
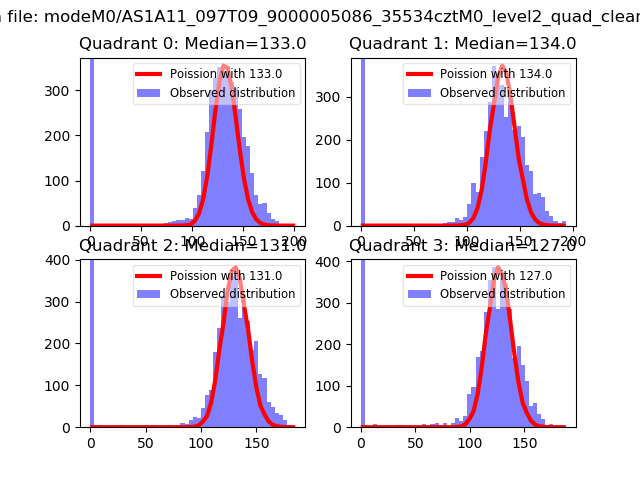 |
 |
| Quadrant-wise count rates Data is divided into 100 sec bins |
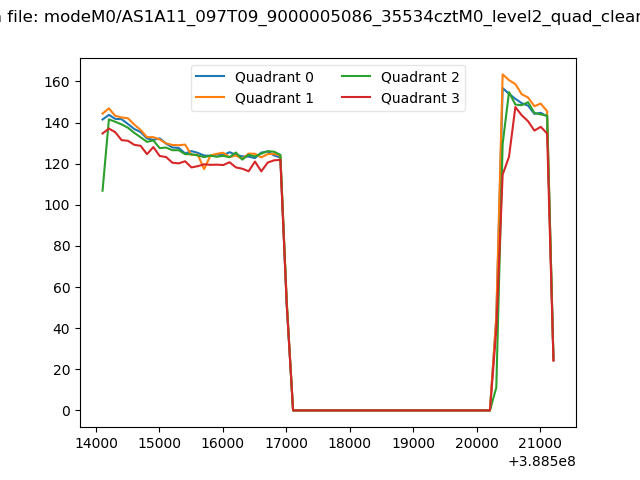 |
|
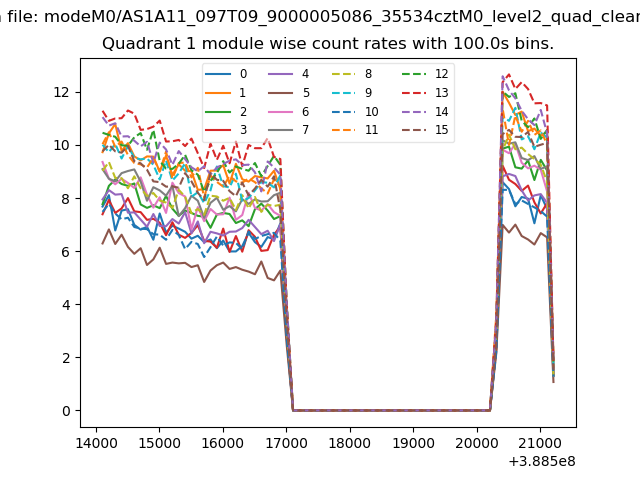
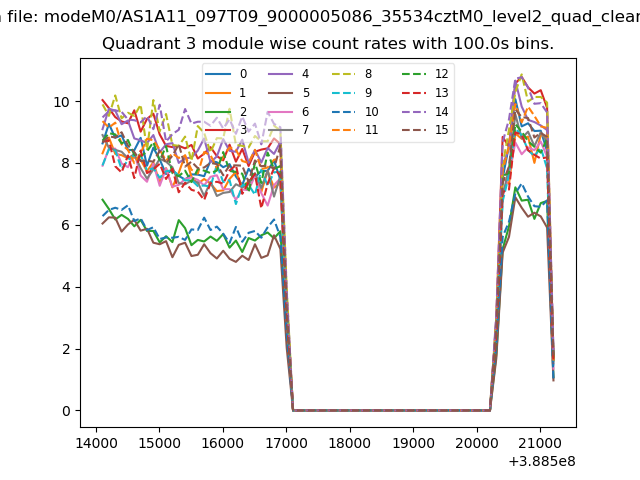
| Module-wise count rates for Quadrant A Data is divided into 100 sec bins |
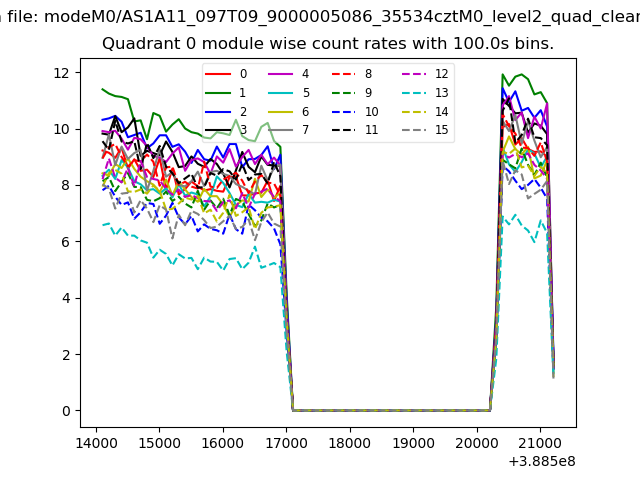 |
 |
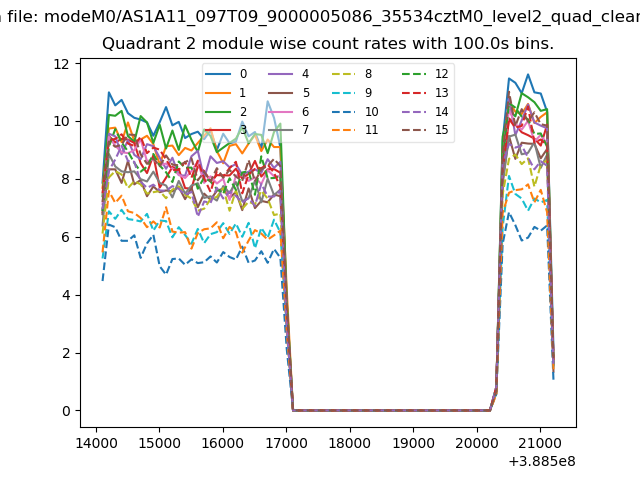
| Module-wise count rates for Quadrant B Data is divided into 100 sec bins |
 |
 |
| Module-wise count rates for Quadrant C Data is divided into 100 sec bins |
 |
 |
| Module-wise count rates for Quadrant D Data is divided into 100 sec bins |
 |
 |
| Parameter | Plot |
|---|---|
| CZT HV Monitor | 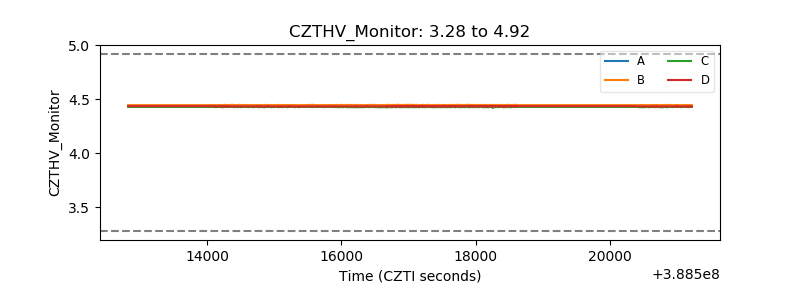 |
| D_VDD | 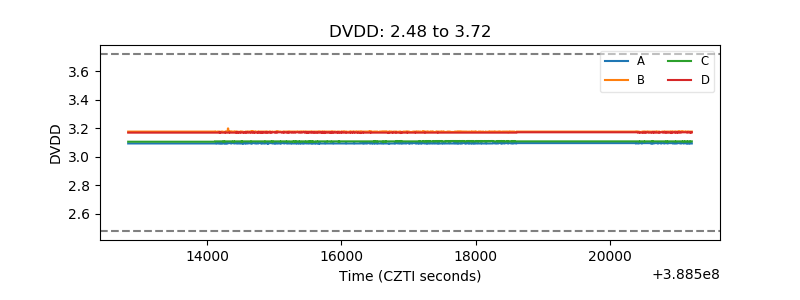 |
| Temperature 1 | 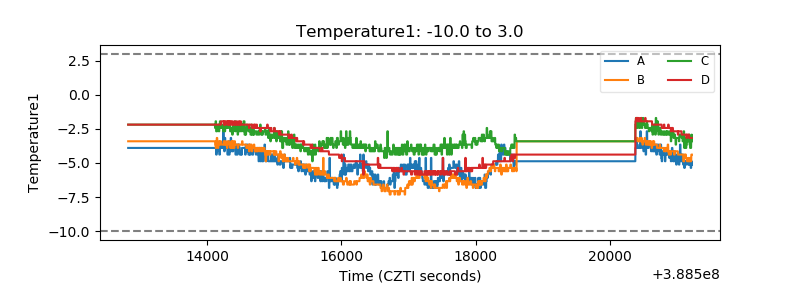 |
| Veto HV Monitor | 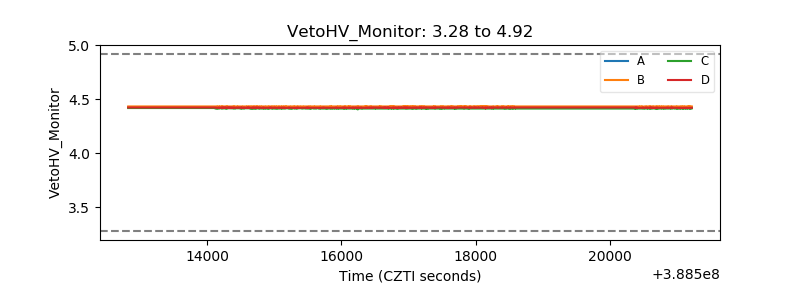 |
| Veto LLD | 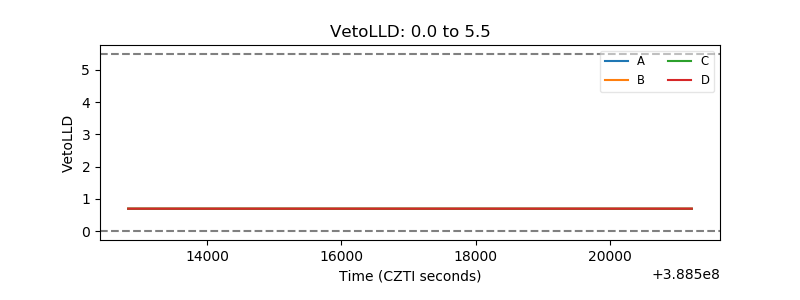 |
| Alpha Counter | 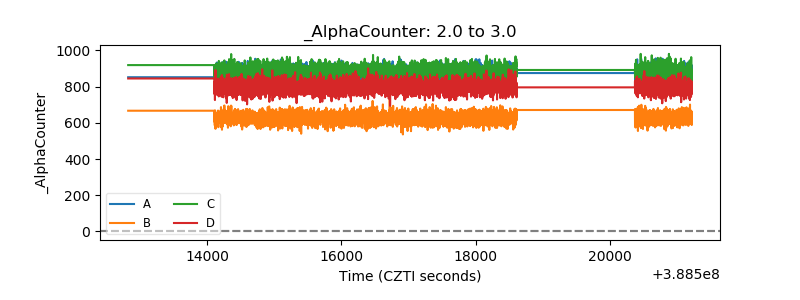 |
| _CPM_Rate | 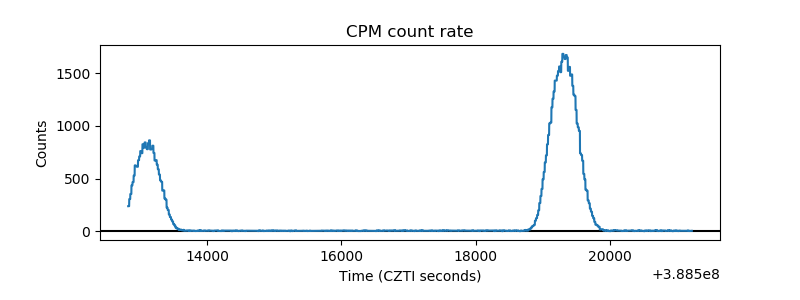 |
| CZT Counter | 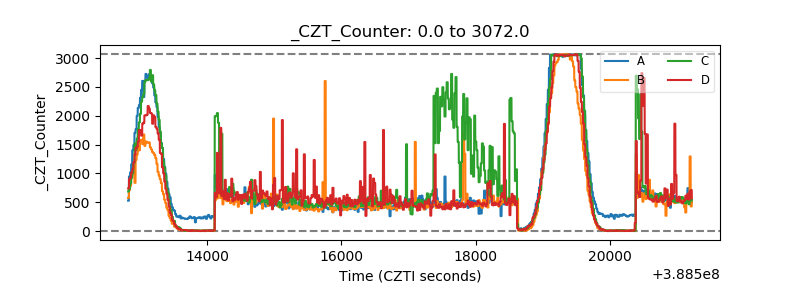 |
| +2.5 Volts monitor | 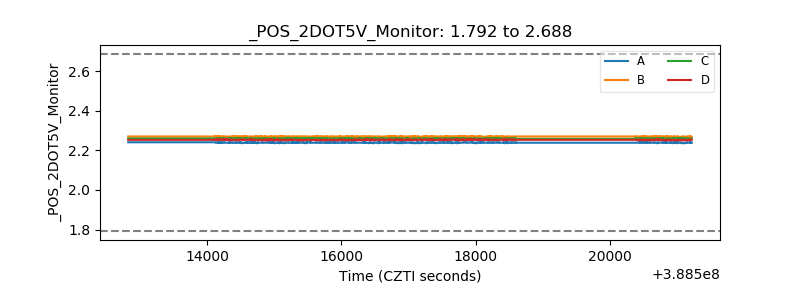 |
| +5 Volts monitor | 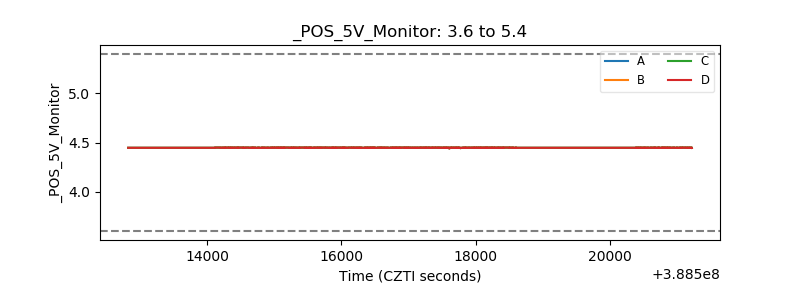 |
| _ROLL_ROT | 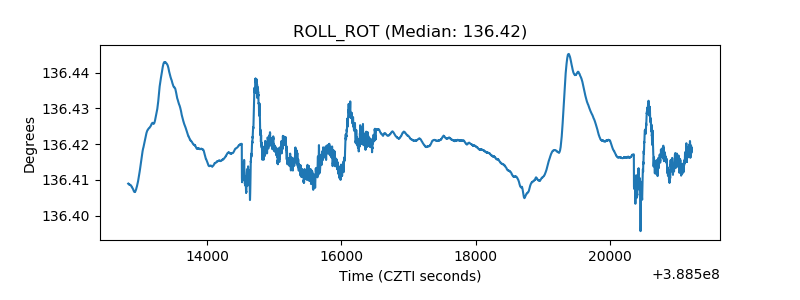 |
| _Roll_DEC | 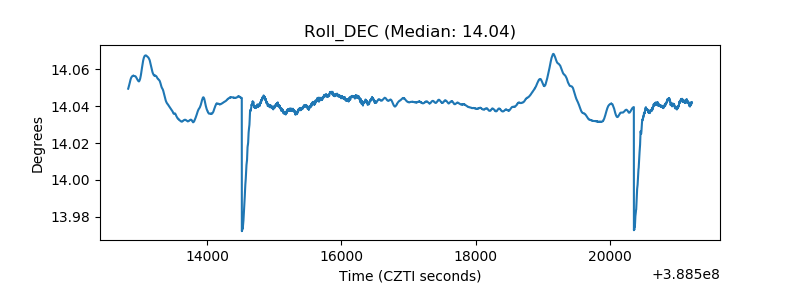 |
| _Roll_RA | 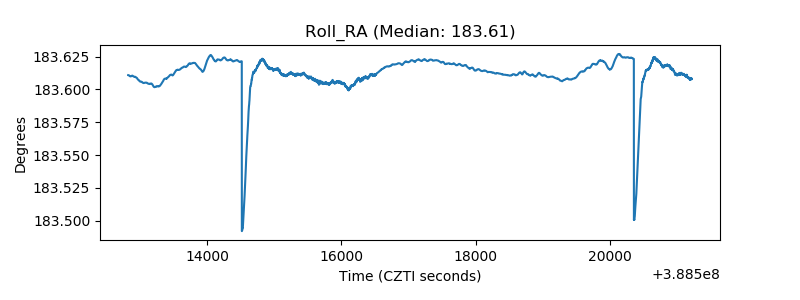 |
| Veto Counter | 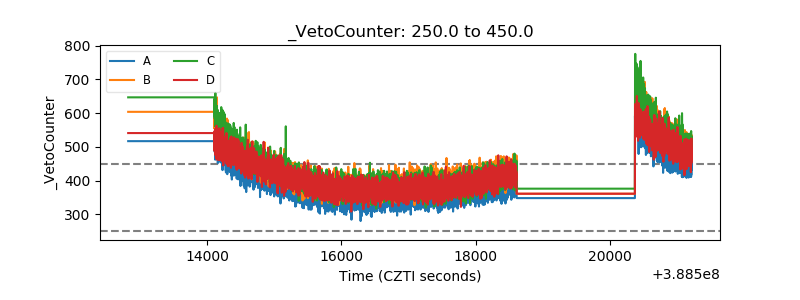 |