| Param | Original file | Final file |
|---|---|---|
| Filename | modeM0/AS1A11_097T09_9000005086_35530cztM0_level2.evt | modeM0/AS1A11_097T09_9000005086_35530cztM0_level2_quad_clean.evt |
| Size (bytes) | 213,791,040 | 39,064,320 |
| Size | 203.9 MB | 37.3 MB |
| Events in quadrant A | 1,447,009 | 245,275 |
| Events in quadrant B | 1,452,540 | 248,168 |
| Events in quadrant C | 1,743,350 | 240,312 |
| Events in quadrant D | 1,620,905 | 229,816 |
| Mode SS | |||
|---|---|---|---|
| Quadrant | BADHDUFLAG | Total packets | Discarded packets |
| A | 0 | 60 | 0 |
| B | 0 | 60 | 0 |
| C | 0 | 60 | 0 |
| D | 0 | 60 | 0 |
| Mode M0 | |||
|---|---|---|---|
| Quadrant | BADHDUFLAG | Total packets | Discarded packets |
| A | 0 | 6273 | 2 |
| B | 0 | 6344 | 1 |
| C | 0 | 6969 | 1 |
| D | 0 | 6793 | 1 |
| Mode M9 | |||
|---|---|---|---|
| Quadrant | BADHDUFLAG | Total packets | Discarded packets |
| A | 0 | 11 | 0 |
| B | 0 | 11 | 0 |
| C | 0 | 11 | 0 |
| D | 0 | 12 | 0 |
| Quadrant | Total seconds | Saturated seconds | Saturation percentage |
|---|---|---|---|
| A | 3080 | 5 | 0.162338% |
| B | 3080 | 5 | 0.162338% |
| C | 3080 | 39 | 1.266234% |
| D | 3080 | 26 | 0.844156% |
Noise dominated data is calculated using 1-second bins in cleaned event files. If a bin has >2000 counts, and if more than 50% of those come from <1% of pixels, then it is considered to be noise-dominated and hence unusable.
| Quadrant | # 1 sec bins | Bins with >0 counts | Bins with >2000 counts | High rate bins dominated by noise | Noise dominated (total time) | Noise dominated (detector-on time) | Marked lightcurve |
|---|---|---|---|---|---|---|---|
| A | 3080 | 3080 | 0 | 0 | 0.00% | 0.00% | 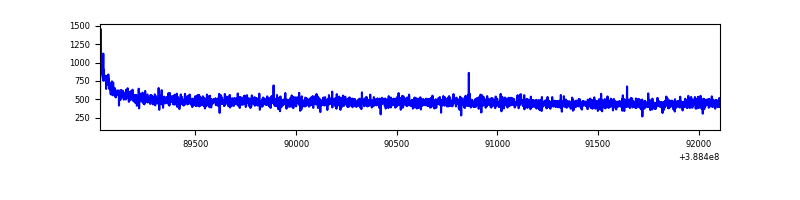 |
| B | 3080 | 3080 | 2 | 2 | 0.06% | 0.06% | 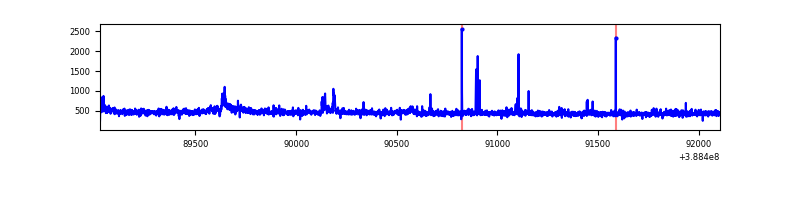 |
| C | 3080 | 3080 | 27 | 27 | 0.88% | 0.88% | 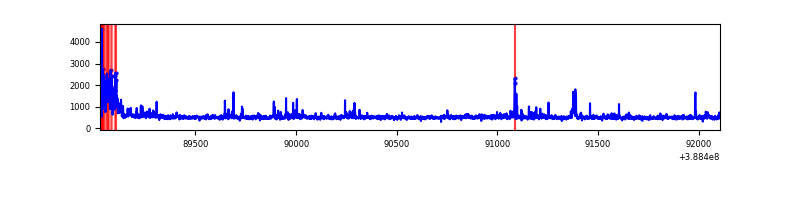 |
| D | 3080 | 3080 | 17 | 17 | 0.55% | 0.55% | 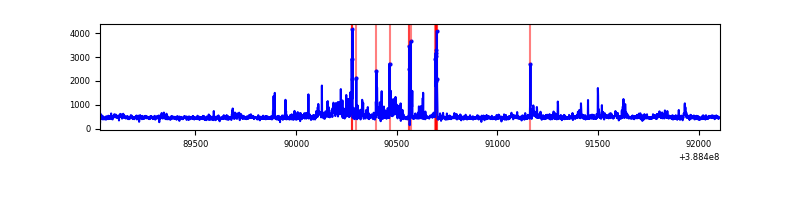 |
Top three noisy pixels from each quadrant. If the there are fewer than three noisy pixels in the level2.evt file, extra rows are filled as -1
| Pixel properties | Quadrant properties | ||||||
|---|---|---|---|---|---|---|---|
| Quadrant | DetID | PixID | Counts | Sigma | Mean | Median | Sigma |
| A | 10 | 83 | 70561 | 952.07 | 355 | 347 | 73.7 |
| A | 3 | 137 | 3901 | 48.19 | 355 | 347 | 73.7 |
| A | 13 | 254 | 3736 | 45.95 | 355 | 347 | 73.7 |
| B | 5 | 236 | 38094 | 549.3 | 348 | 340 | 68.7 |
| B | 3 | 112 | 21611 | 309.48 | 348 | 340 | 68.7 |
| B | 12 | 111 | 8662 | 121.08 | 348 | 340 | 68.7 |
| C | 0 | 10 | 166847 | 2032.66 | 342 | 344 | 81.9 |
| C | 15 | 214 | 128664 | 1566.52 | 342 | 344 | 81.9 |
| C | 0 | 207 | 73199 | 889.41 | 342 | 344 | 81.9 |
| D | 2 | 250 | 88618 | 1047.1 | 344 | 335 | 84.3 |
| D | 8 | 195 | 60619 | 715.01 | 344 | 335 | 84.3 |
| D | 12 | 235 | 55536 | 654.73 | 344 | 335 | 84.3 |
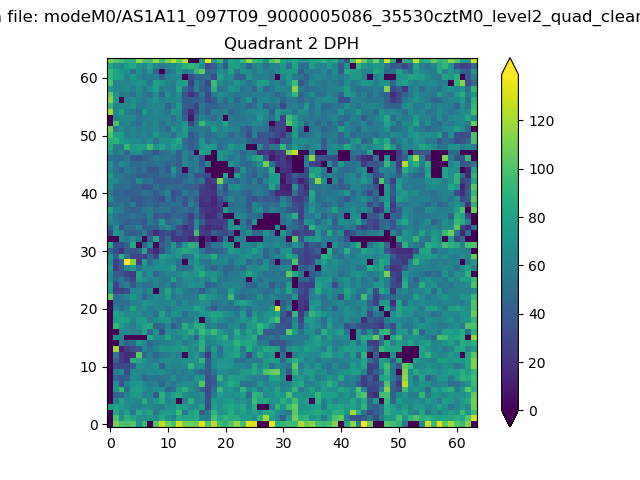
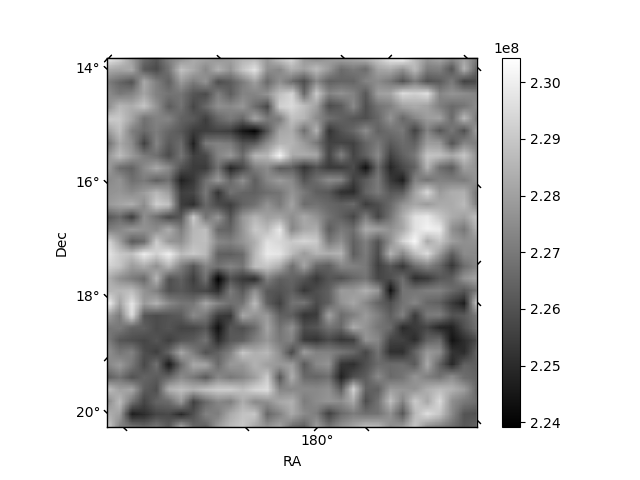
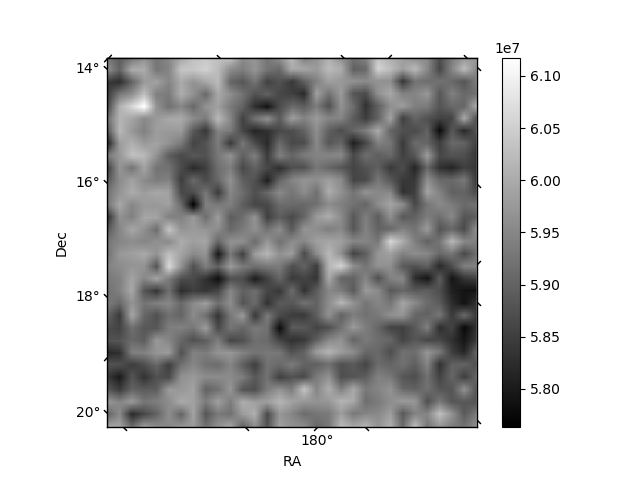
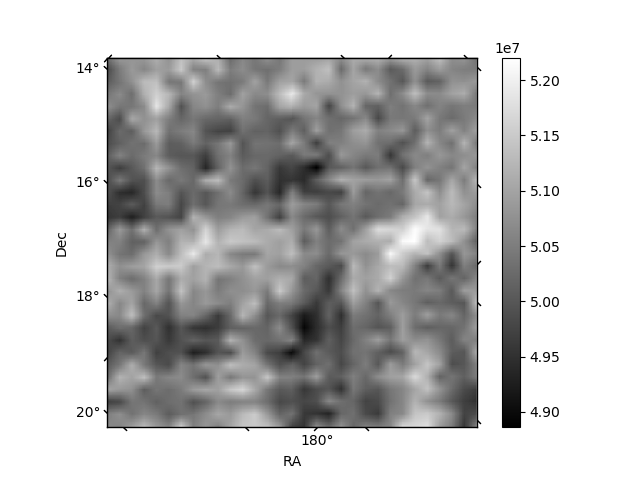
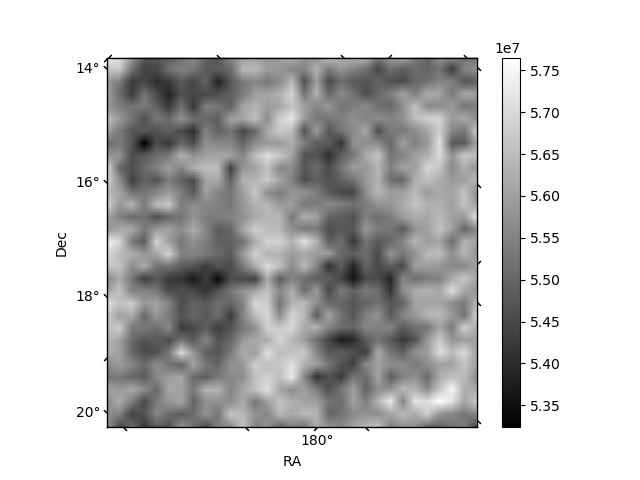
Histogram calculated using DETX and DETY for each event in the final _common_clean file
| Quadrant A | 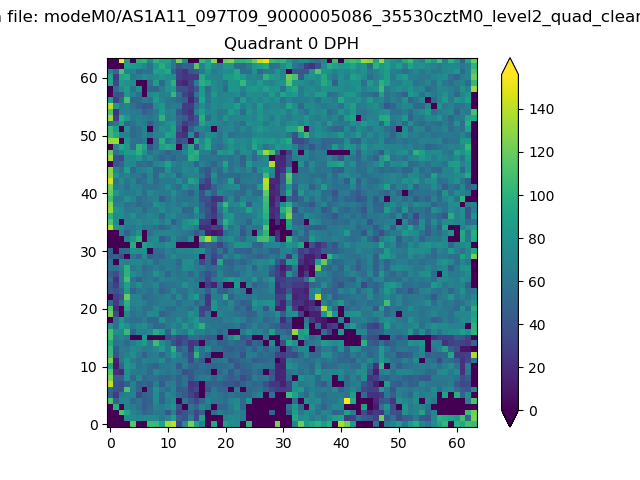 |
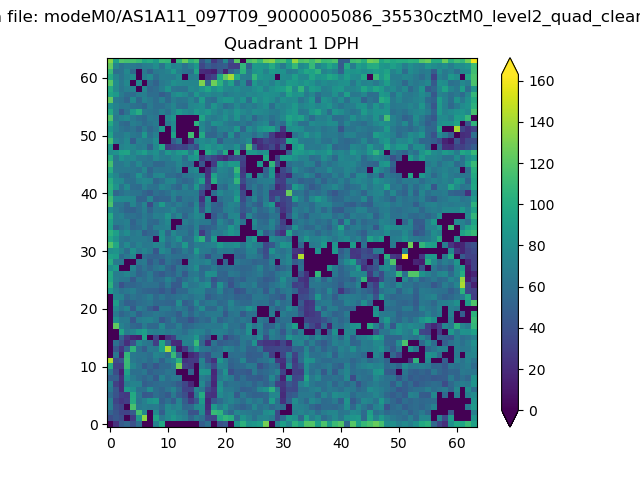 |
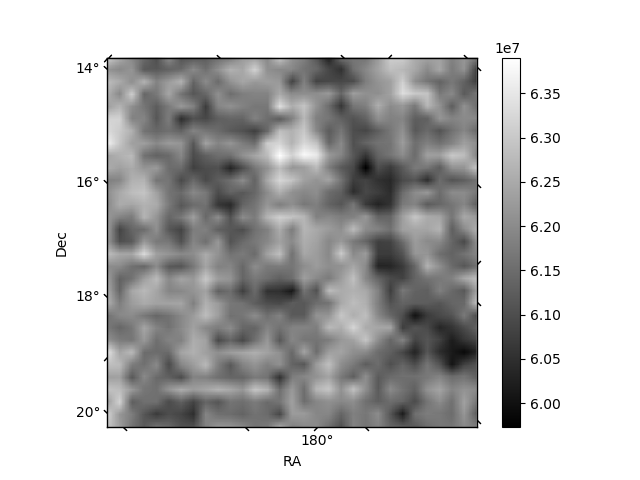
Quadrant B |
|---|---|---|---|
| Quadrant D | 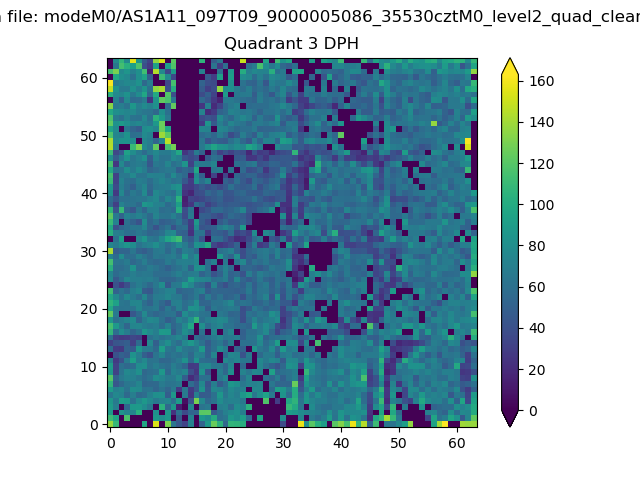 |
 |
Quadrant C |
| Plot type | Count rate plots | Images |
|---|---|---|
| Comparison with Poisson distribution Blue bars denote a histogram of data divided into 1 sec bins. Red curve is a Poisson curve with rate = median count rate of data. |
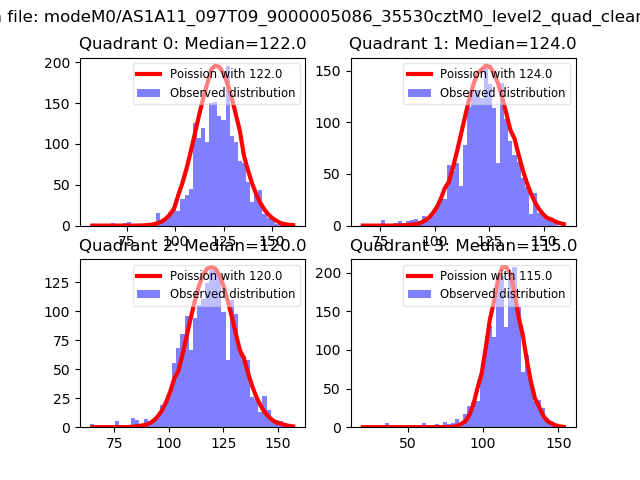 |
 |
| Quadrant-wise count rates Data is divided into 100 sec bins |
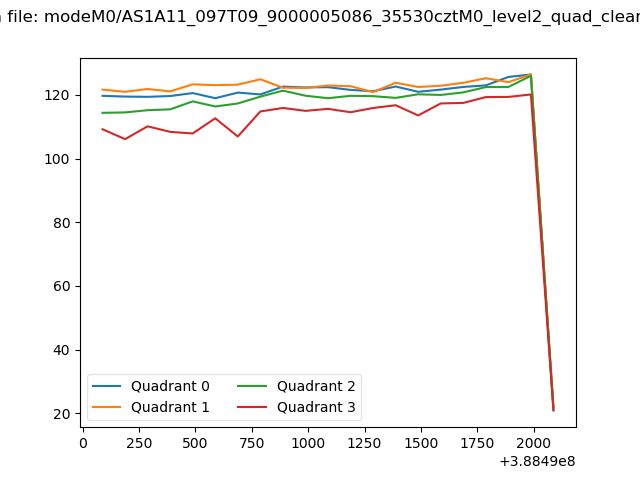 |
|
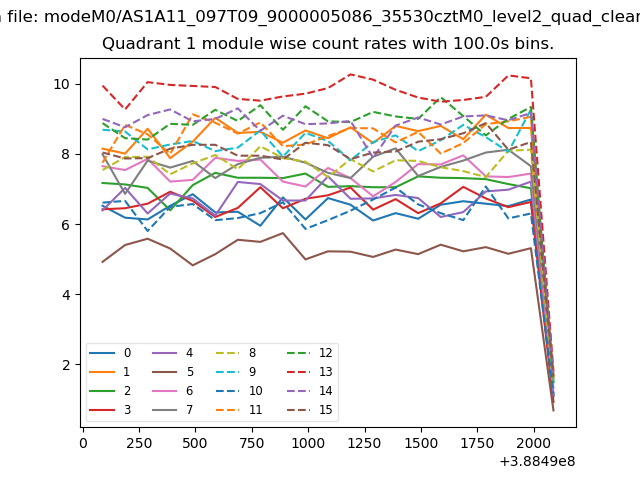
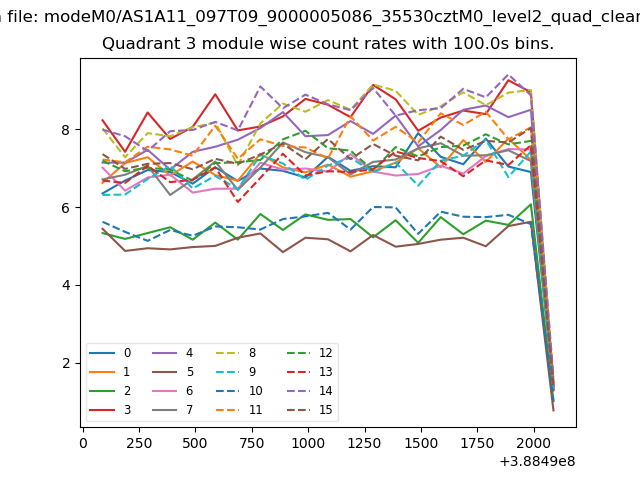
| Module-wise count rates for Quadrant A Data is divided into 100 sec bins |
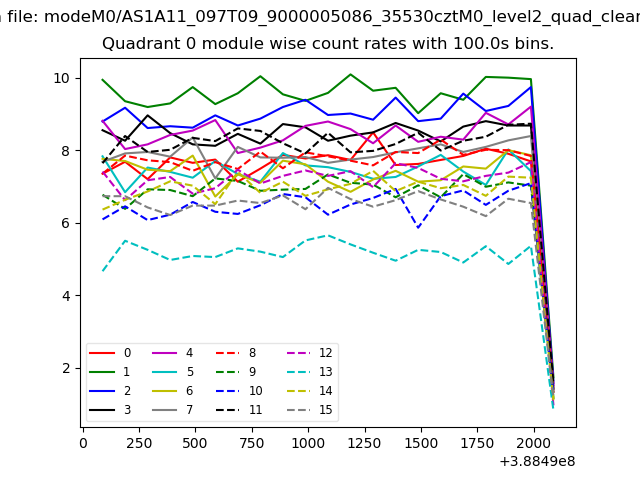 |
 |
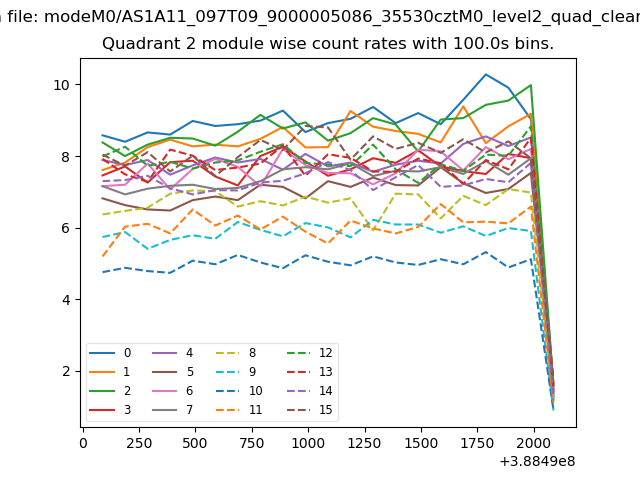
| Module-wise count rates for Quadrant B Data is divided into 100 sec bins |
 |
 |
| Module-wise count rates for Quadrant C Data is divided into 100 sec bins |
 |
 |
| Module-wise count rates for Quadrant D Data is divided into 100 sec bins |
 |
 |
| Parameter | Plot |
|---|---|
| CZT HV Monitor | 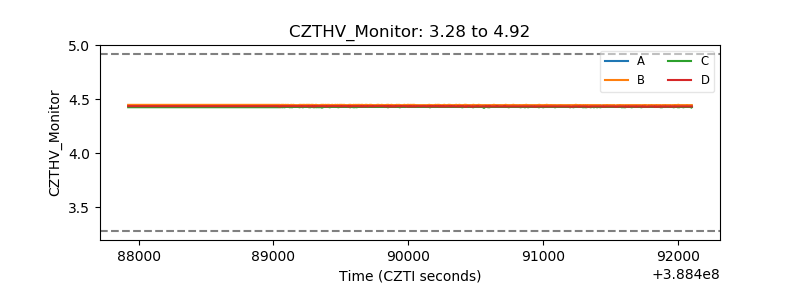 |
| D_VDD | 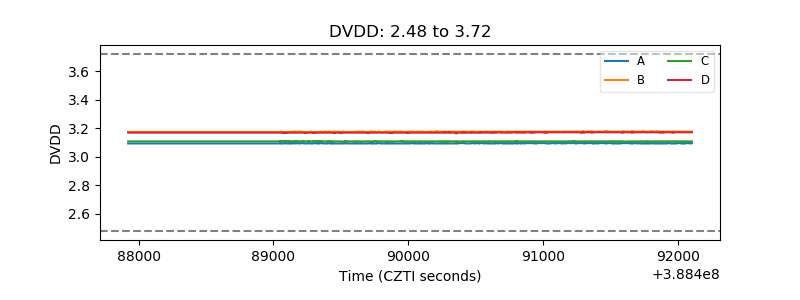 |
| Temperature 1 | 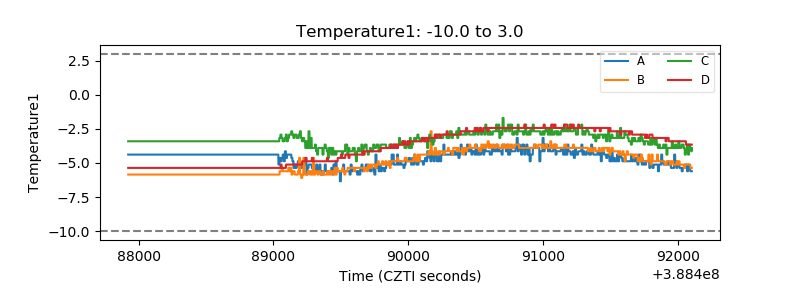 |
| Veto HV Monitor |  |
| Veto LLD | 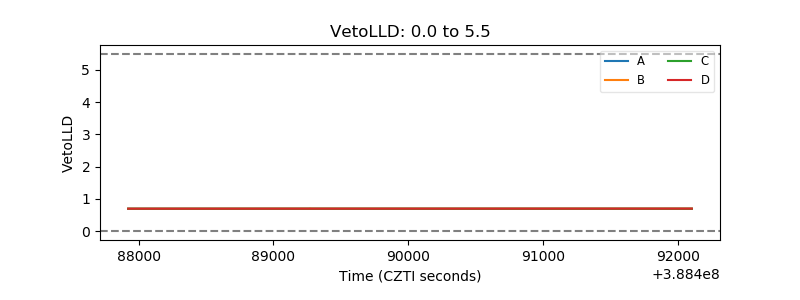 |
| Alpha Counter | 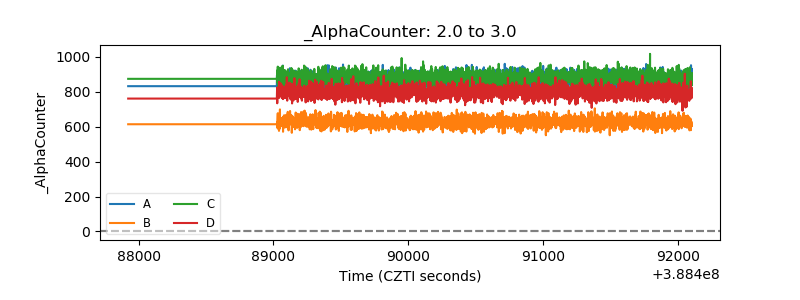 |
| _CPM_Rate | 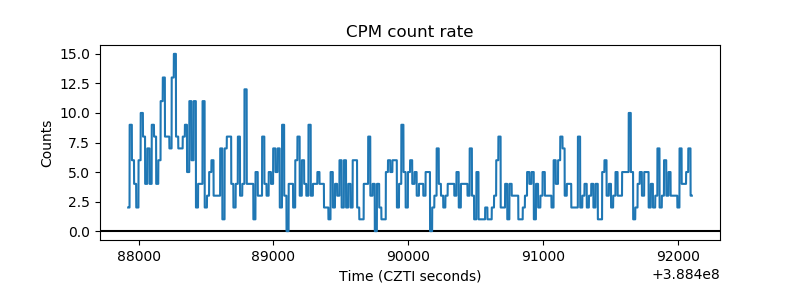 |
| CZT Counter | 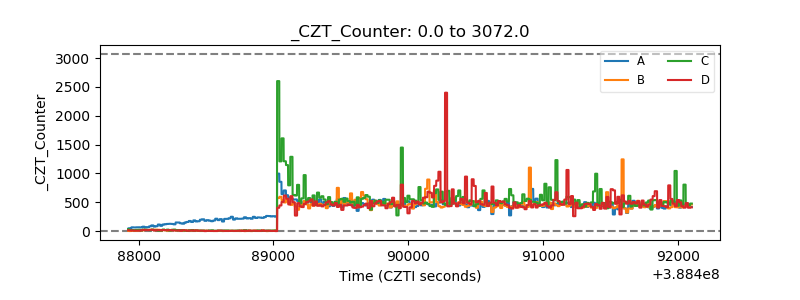 |
| +2.5 Volts monitor | 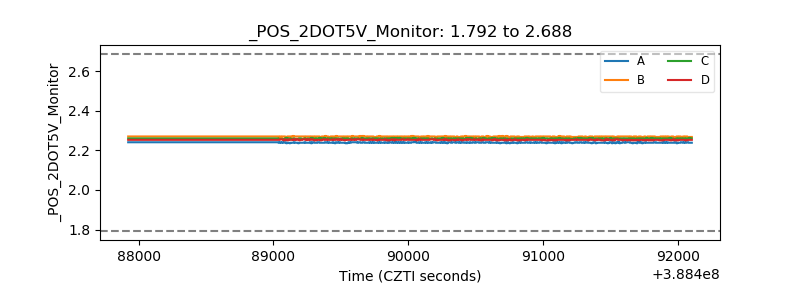 |
| +5 Volts monitor | 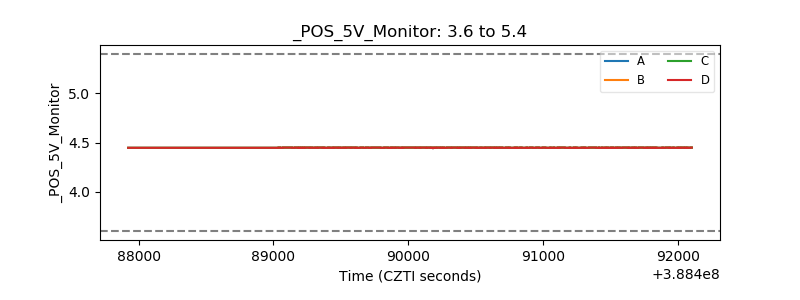 |
| _ROLL_ROT | 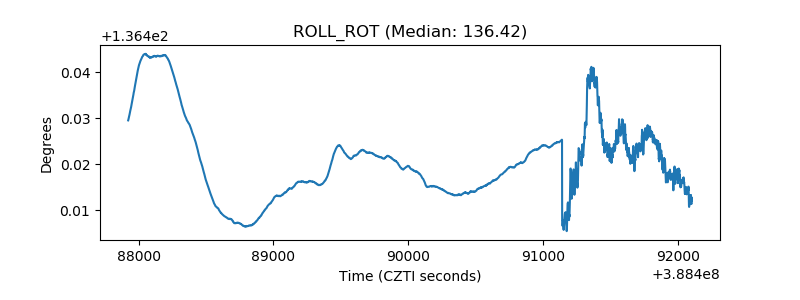 |
| _Roll_DEC | 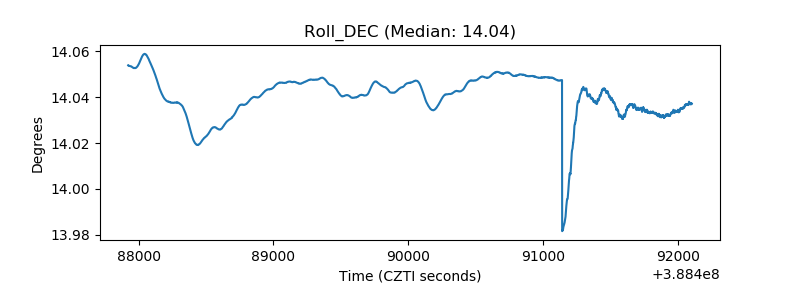 |
| _Roll_RA | 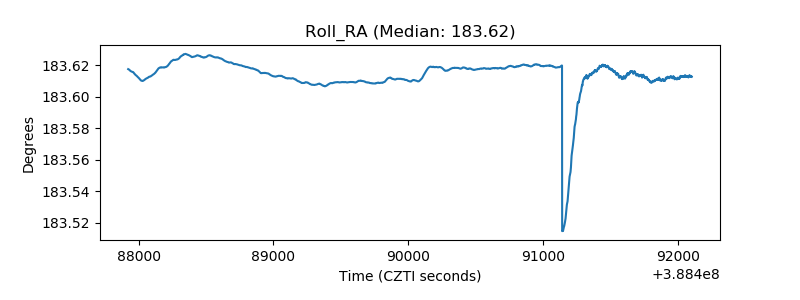 |
| Veto Counter | 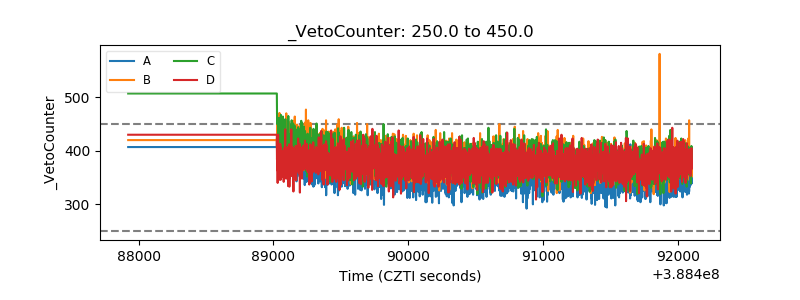 |