| Param | Original file | Final file |
|---|---|---|
| Filename | modeM0/AS1A11_097T09_9000005086_35523cztM0_level2.evt | modeM0/AS1A11_097T09_9000005086_35523cztM0_level2_quad_clean.evt |
| Size (bytes) | 381,890,880 | 61,464,960 |
| Size | 364.2 MB | 58.6 MB |
| Events in quadrant A | 2,505,385 | 386,688 |
| Events in quadrant B | 2,651,713 | 397,613 |
| Events in quadrant C | 3,361,712 | 373,341 |
| Events in quadrant D | 2,713,840 | 360,123 |
| Mode SS | |||
|---|---|---|---|
| Quadrant | BADHDUFLAG | Total packets | Discarded packets |
| A | 0 | 100 | 0 |
| B | 0 | 100 | 0 |
| C | 0 | 100 | 0 |
| D | 0 | 100 | 0 |
| Mode M0 | |||
|---|---|---|---|
| Quadrant | BADHDUFLAG | Total packets | Discarded packets |
| A | 0 | 10358 | 3 |
| B | 0 | 10780 | 2 |
| C | 0 | 13018 | 2 |
| D | 0 | 11150 | 2 |
| Mode M9 | |||
|---|---|---|---|
| Quadrant | BADHDUFLAG | Total packets | Discarded packets |
| A | 0 | 39 | 0 |
| B | 0 | 39 | 0 |
| C | 0 | 39 | 0 |
| D | 0 | 40 | 0 |
| Quadrant | Total seconds | Saturated seconds | Saturation percentage |
|---|---|---|---|
| A | 4893 | 6 | 0.122624% |
| B | 4893 | 72 | 1.471490% |
| C | 4893 | 215 | 4.394032% |
| D | 4893 | 60 | 1.226242% |
Noise dominated data is calculated using 1-second bins in cleaned event files. If a bin has >2000 counts, and if more than 50% of those come from <1% of pixels, then it is considered to be noise-dominated and hence unusable.
| Quadrant | # 1 sec bins | Bins with >0 counts | Bins with >2000 counts | High rate bins dominated by noise | Noise dominated (total time) | Noise dominated (detector-on time) | Marked lightcurve |
|---|---|---|---|---|---|---|---|
| A | 7046 | 4894 | 2 | 2 | 0.03% | 0.04% | 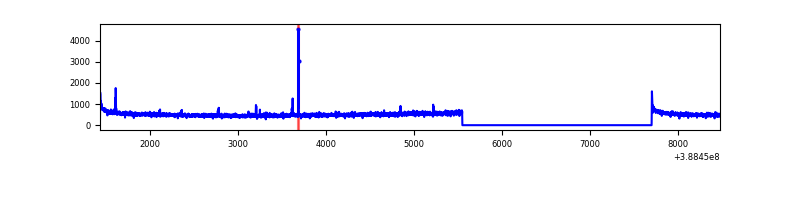 |
| B | 7046 | 4894 | 34 | 34 | 0.48% | 0.69% | 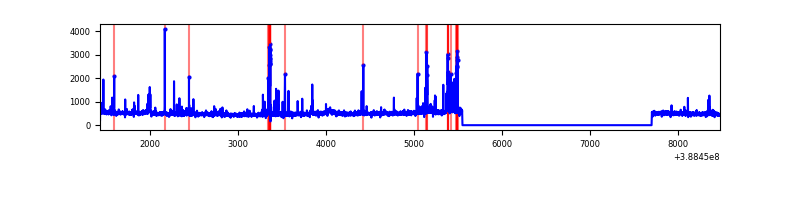 |
| C | 7046 | 4894 | 188 | 188 | 2.67% | 3.84% | 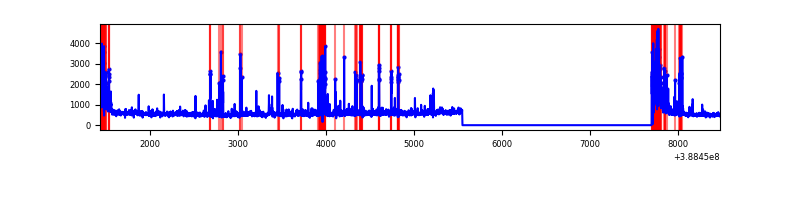 |
| D | 7046 | 4894 | 40 | 40 | 0.57% | 0.82% | 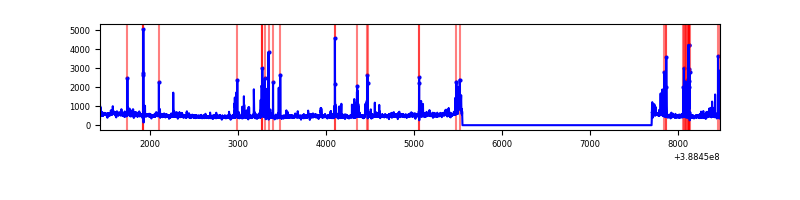 |
Top three noisy pixels from each quadrant. If the there are fewer than three noisy pixels in the level2.evt file, extra rows are filled as -1
| Pixel properties | Quadrant properties | ||||||
|---|---|---|---|---|---|---|---|
| Quadrant | DetID | PixID | Counts | Sigma | Mean | Median | Sigma |
| A | 10 | 83 | 127757 | 1057.63 | 601 | 592 | 120.2 |
| A | 9 | 143 | 32906 | 268.76 | 601 | 592 | 120.2 |
| A | 15 | 169 | 13190 | 104.78 | 601 | 592 | 120.2 |
| B | 5 | 236 | 174246 | 1513.06 | 600 | 586 | 114.8 |
| B | 5 | 172 | 80075 | 692.57 | 600 | 586 | 114.8 |
| B | 5 | 200 | 21754 | 184.43 | 600 | 586 | 114.8 |
| C | 0 | 10 | 506127 | 3763.47 | 576 | 581 | 134.3 |
| C | 0 | 207 | 243998 | 1812.08 | 576 | 581 | 134.3 |
| C | 15 | 214 | 202955 | 1506.55 | 576 | 581 | 134.3 |
| D | 13 | 249 | 332681 | 2371.02 | 572 | 557 | 140.1 |
| D | 8 | 195 | 132223 | 939.96 | 572 | 557 | 140.1 |
| D | 10 | 203 | 37728 | 265.36 | 572 | 557 | 140.1 |
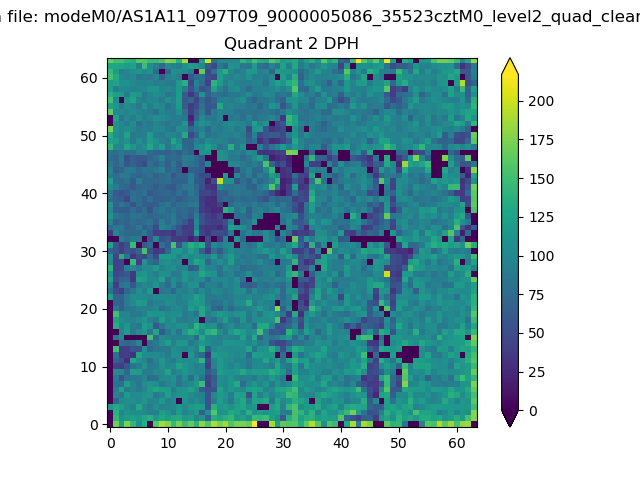
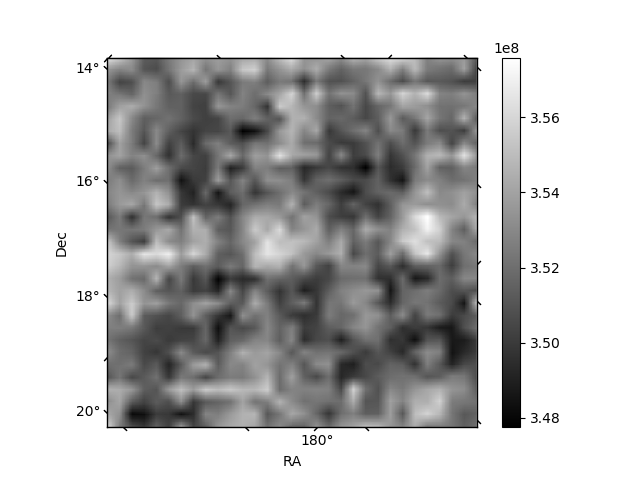
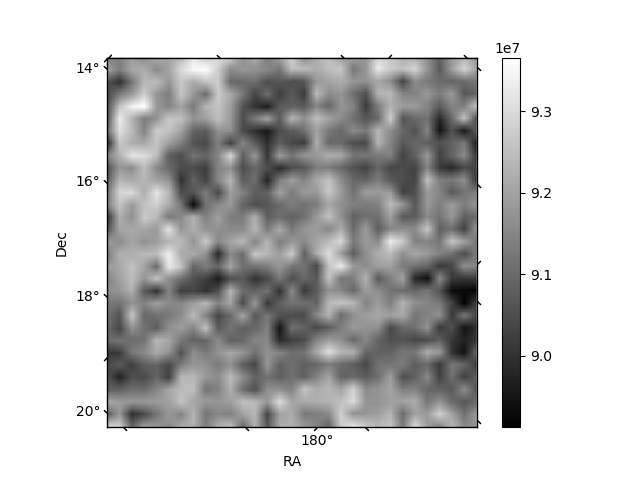
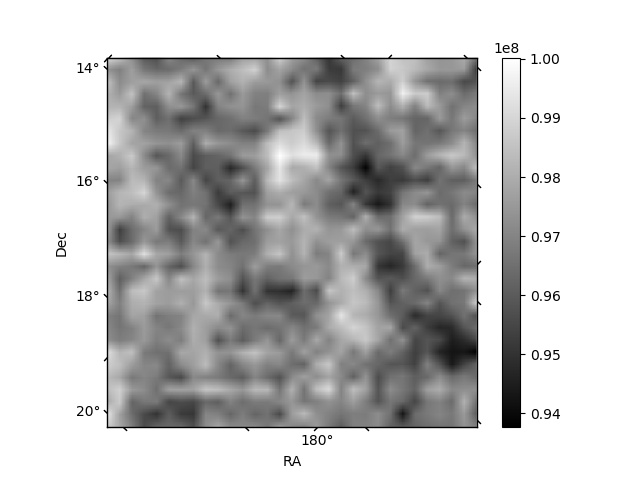
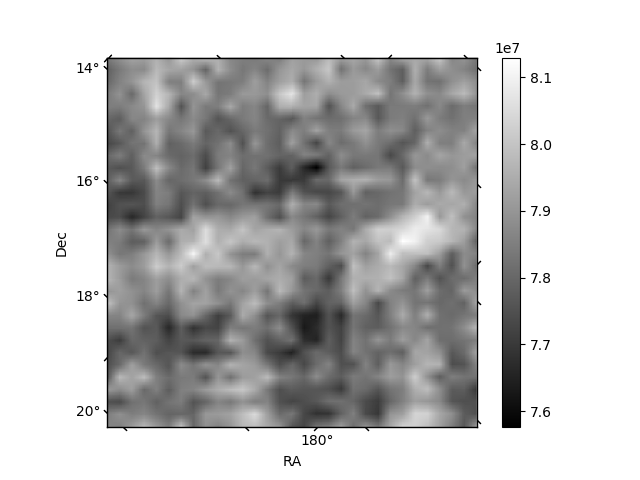
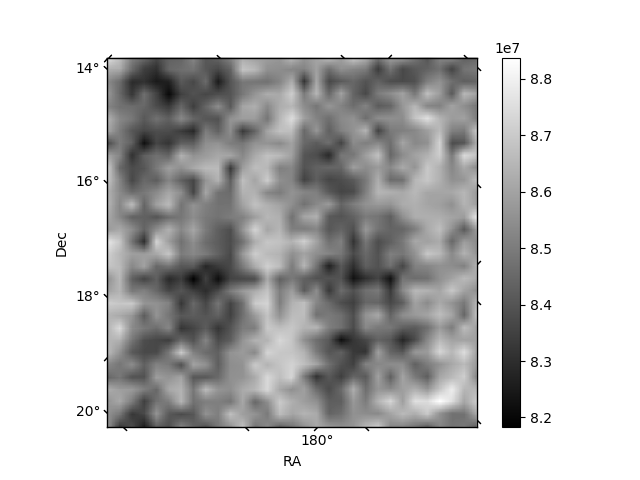
Histogram calculated using DETX and DETY for each event in the final _common_clean file
| Quadrant A | 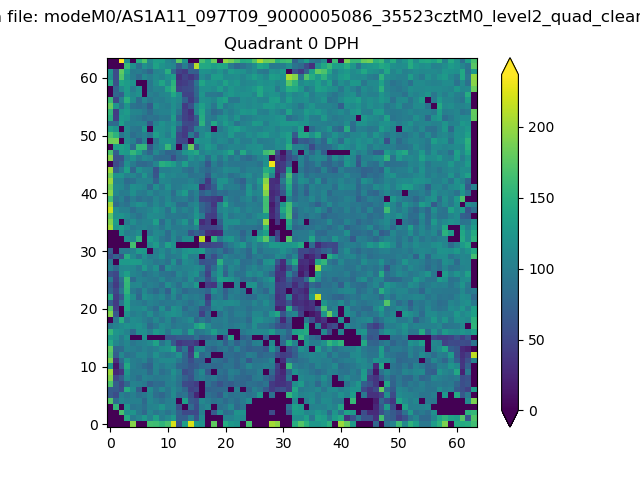 |
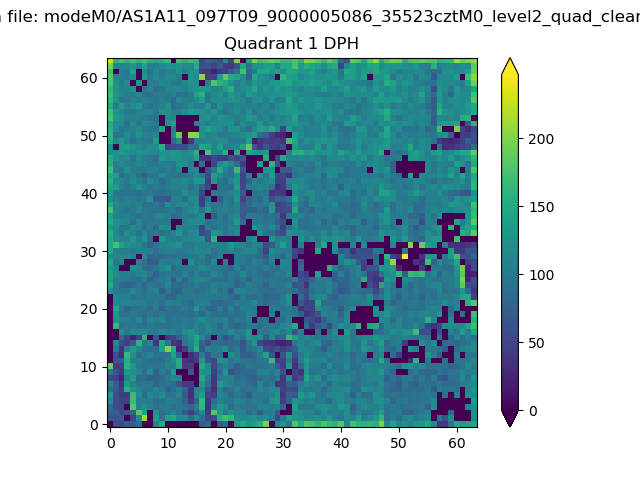 |
Quadrant B |
|---|---|---|---|
| Quadrant D | 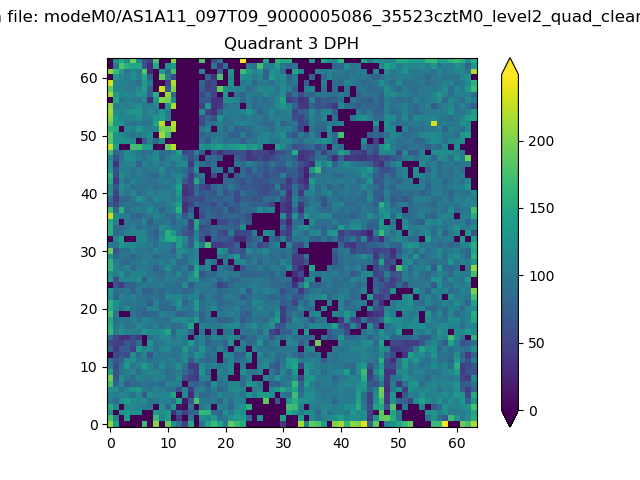 |
 |
Quadrant C |
| Plot type | Count rate plots | Images |
|---|---|---|
| Comparison with Poisson distribution Blue bars denote a histogram of data divided into 1 sec bins. Red curve is a Poisson curve with rate = median count rate of data. |
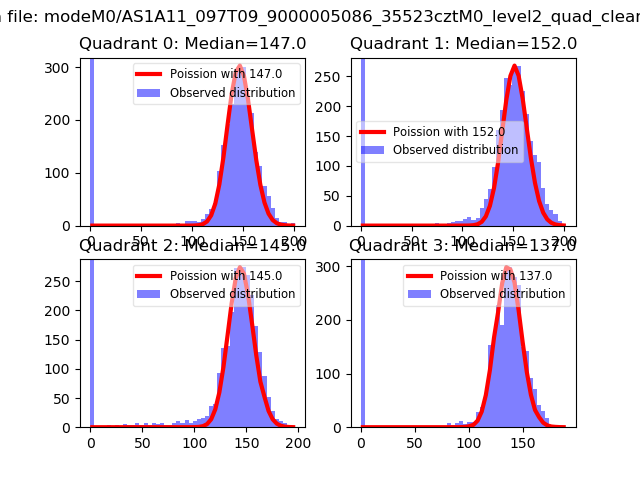 |
 |
| Quadrant-wise count rates Data is divided into 100 sec bins |
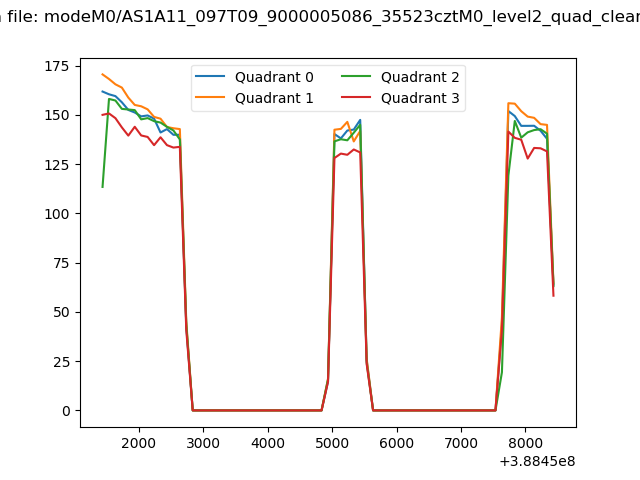 |
|
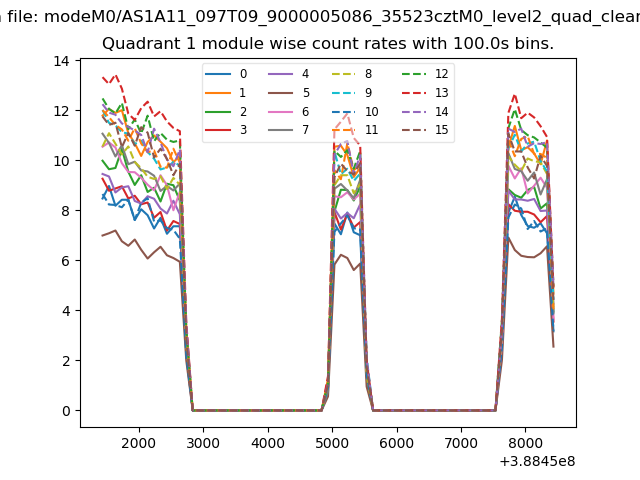
| Module-wise count rates for Quadrant A Data is divided into 100 sec bins |
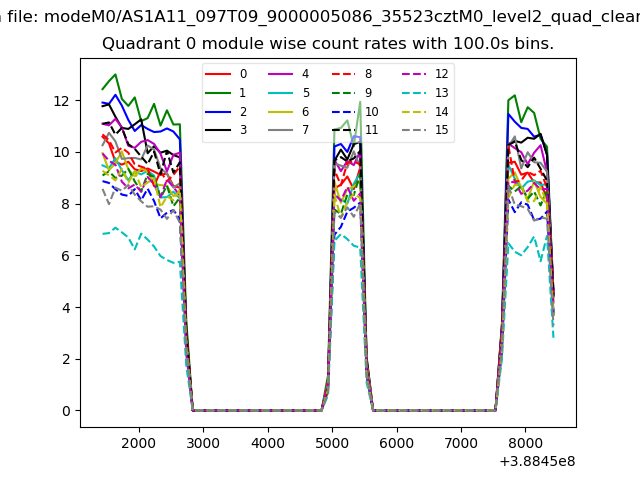 |
 |
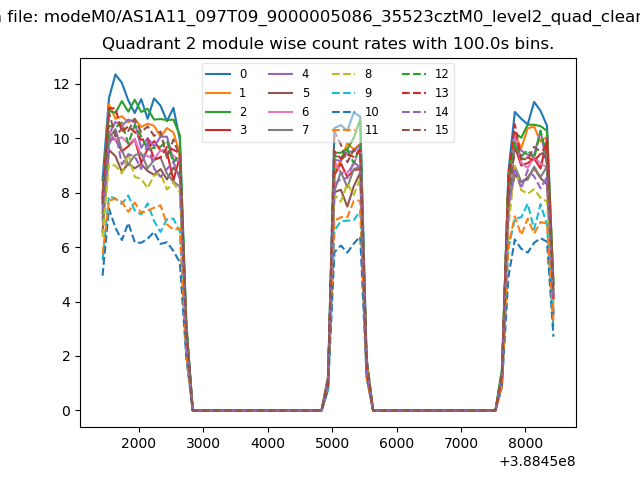
| Module-wise count rates for Quadrant B Data is divided into 100 sec bins |
 |
 |
| Module-wise count rates for Quadrant C Data is divided into 100 sec bins |
 |
 |
| Module-wise count rates for Quadrant D Data is divided into 100 sec bins |
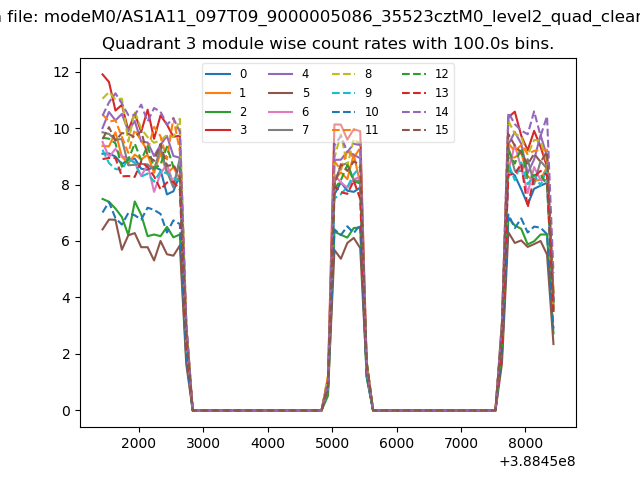 |
 |
| Parameter | Plot |
|---|---|
| CZT HV Monitor | 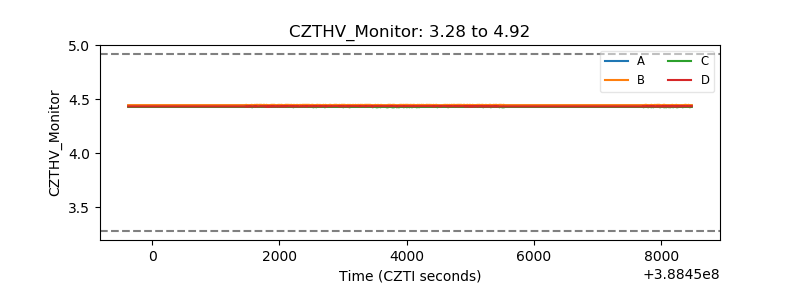 |
| D_VDD | 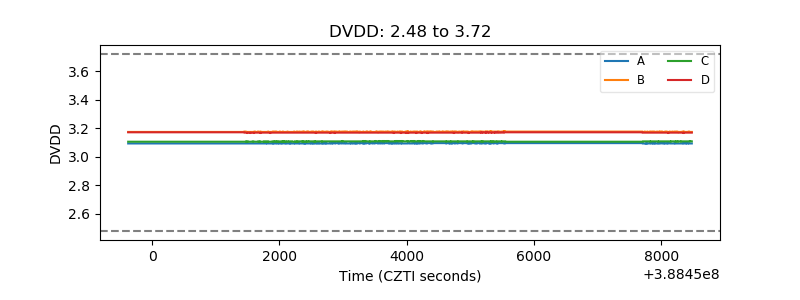 |
| Temperature 1 | 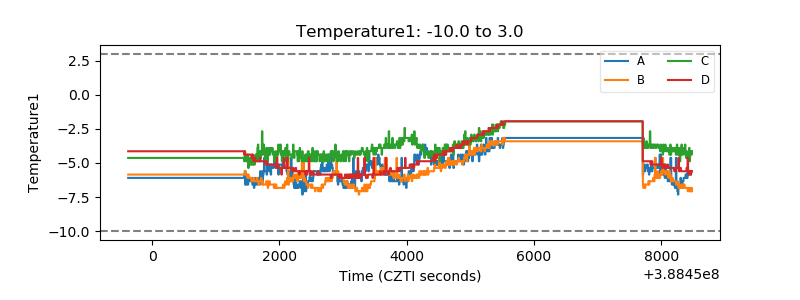 |
| Veto HV Monitor | 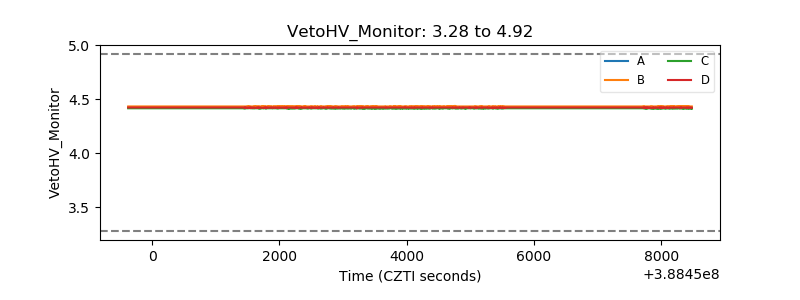 |
| Veto LLD | 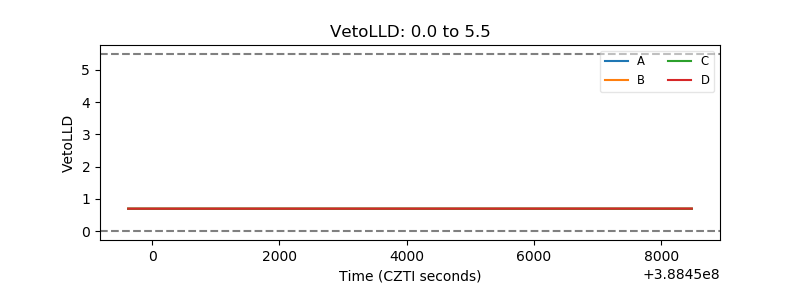 |
| Alpha Counter | 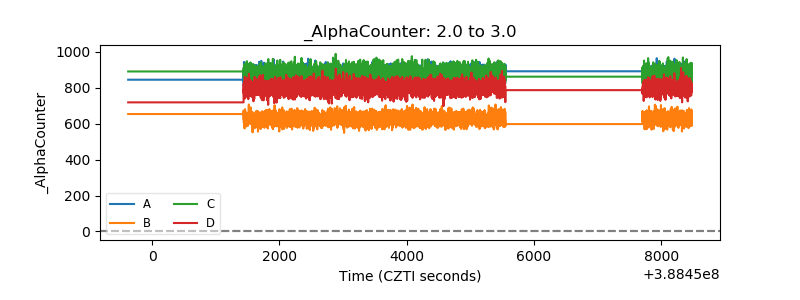 |
| _CPM_Rate | 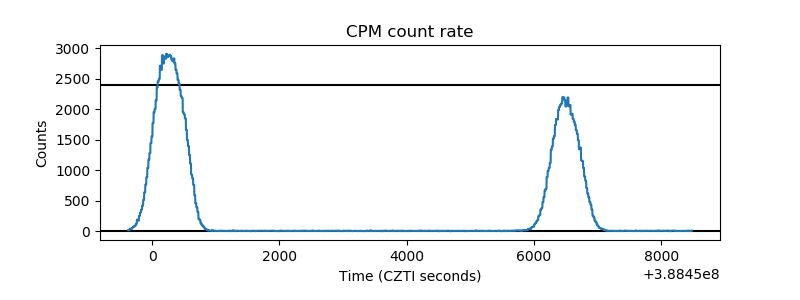 |
| CZT Counter | 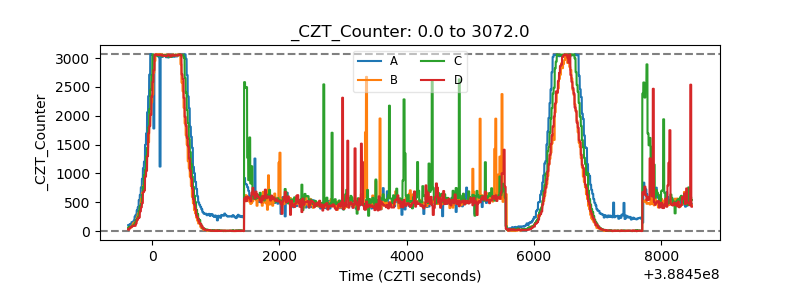 |
| +2.5 Volts monitor |  |
| +5 Volts monitor | 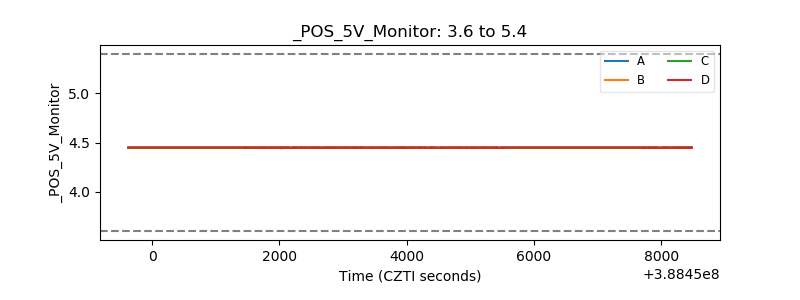 |
| _ROLL_ROT |  |
| _Roll_DEC | 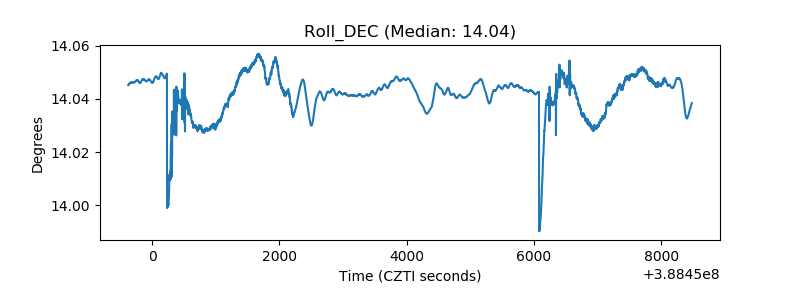 |
| _Roll_RA | 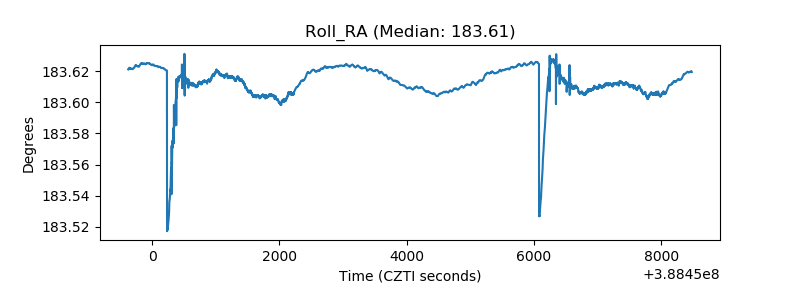 |
| Veto Counter | 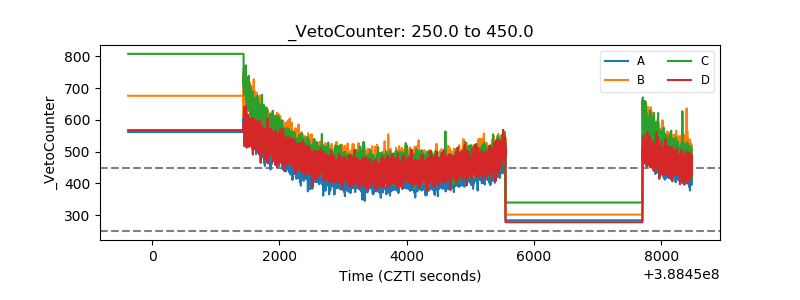 |