| Param | Original file | Final file |
|---|---|---|
| Filename | modeM0/AS1A11_097T09_9000005086cztM0_level2_bc.evt | modeM0/AS1A11_097T09_9000005086cztM0_level2_quad_clean.evt |
| Size (bytes) | 3,081,974,400 | 908,164,800 |
| Size | 2.9 GB | 866.1 MB |
| Events in quadrant A | 17,735,869 | 5,703,409 |
| Events in quadrant B | 19,593,545 | 5,740,336 |
| Events in quadrant C | 25,792,411 | 5,614,431 |
| Events in quadrant D | 25,134,503 | 5,328,447 |
| Mode SS | |||
|---|---|---|---|
| Quadrant | BADHDUFLAG | Total packets | Discarded packets |
| A | 0 | 1530 | 0 |
| B | 0 | 1530 | 0 |
| C | 0 | 1530 | 0 |
| D | 0 | 1530 | 0 |
| Mode M0 | |||
|---|---|---|---|
| Quadrant | BADHDUFLAG | Total packets | Discarded packets |
| A | 0 | 156337 | 0 |
| B | 0 | 166124 | 0 |
| C | 0 | 180242 | 0 |
| D | 0 | 184284 | 0 |
| Mode M9 | |||
|---|---|---|---|
| Quadrant | BADHDUFLAG | Total packets | Discarded packets |
| A | 0 | 300 | 0 |
| B | 0 | 300 | 0 |
| C | 0 | 300 | 0 |
| D | 0 | 300 | 0 |
| Quadrant | Total seconds | Saturated seconds | Saturation percentage |
|---|---|---|---|
| A | 74674 | 118 | 0.158020% |
| B | 74674 | 1241 | 1.661890% |
| C | 74674 | 1428 | 1.912312% |
| D | 74674 | 1900 | 2.544393% |
Noise dominated data is calculated using 1-second bins in cleaned event files. If a bin has >2000 counts, and if more than 50% of those come from <1% of pixels, then it is considered to be noise-dominated and hence unusable.
| Quadrant | # 1 sec bins | Bins with >0 counts | Bins with >2000 counts | High rate bins dominated by noise | Noise dominated (total time) | Noise dominated (detector-on time) | Marked lightcurve |
|---|---|---|---|---|---|---|---|
| A | 104856 | 74691 | 9 | 9 | 0.01% | 0.01% | 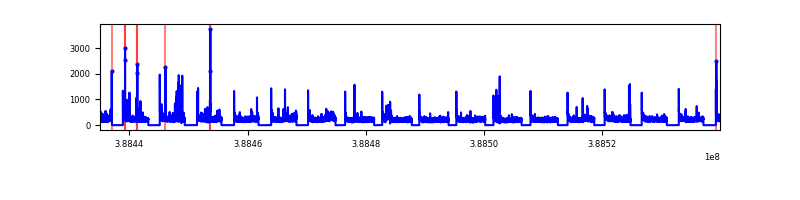 |
| B | 104856 | 74675 | 172 | 172 | 0.16% | 0.23% | 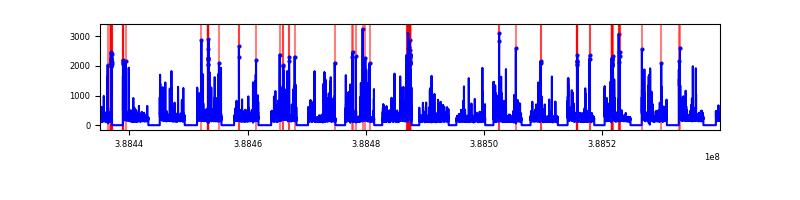 |
| C | 104856 | 74674 | 339 | 339 | 0.32% | 0.45% | 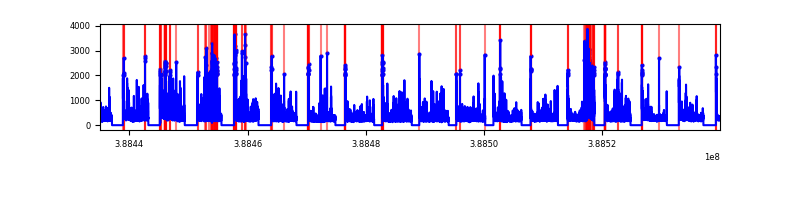 |
| D | 104856 | 74675 | 254 | 254 | 0.24% | 0.34% | 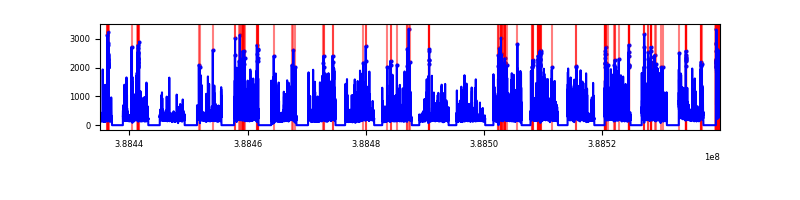 |
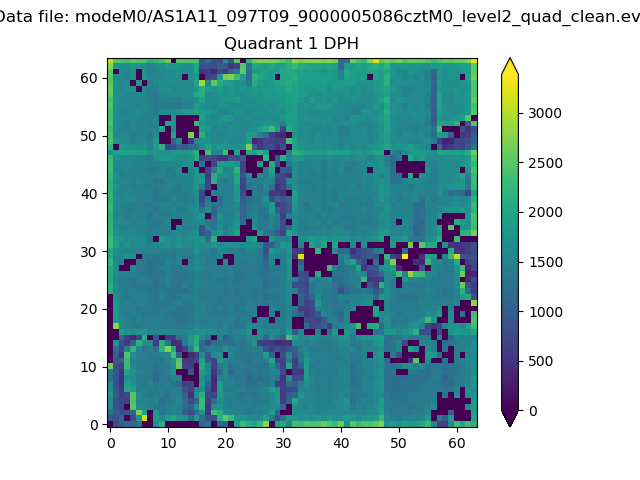
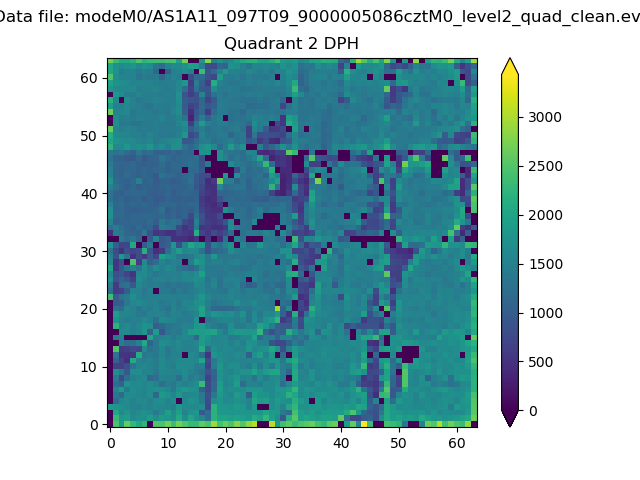
Top three noisy pixels from each quadrant. If the there are fewer than three noisy pixels in the level2.evt file, extra rows are filled as -1
| Pixel properties | Quadrant properties | ||||||
|---|---|---|---|---|---|---|---|
| Quadrant | DetID | PixID | Counts | Sigma | Mean | Median | Sigma |
| A | 10 | 83 | 1394906 | 1628.74 | 3889 | 3822 | 854.1 |
| A | 15 | 169 | 988345 | 1152.72 | 3889 | 3822 | 854.1 |
| A | 9 | 143 | 183826 | 210.76 | 3889 | 3822 | 854.1 |
| B | 5 | 236 | 2664601 | 3484.15 | 3913 | 3829 | 763.7 |
| B | 5 | 172 | 860639 | 1121.95 | 3913 | 3829 | 763.7 |
| B | 5 | 200 | 369395 | 478.69 | 3913 | 3829 | 763.7 |
| C | 0 | 10 | 3124991 | 3568.54 | 3805 | 3775 | 874.6 |
| C | 15 | 214 | 2934255 | 3350.47 | 3805 | 3775 | 874.6 |
| C | 15 | 159 | 1510504 | 1722.67 | 3805 | 3775 | 874.6 |
| D | 12 | 235 | 3472024 | 3832.34 | 3795 | 3676 | 905.0 |
| D | 8 | 195 | 1903006 | 2098.66 | 3795 | 3676 | 905.0 |
| D | 2 | 250 | 1752171 | 1931.99 | 3795 | 3676 | 905.0 |
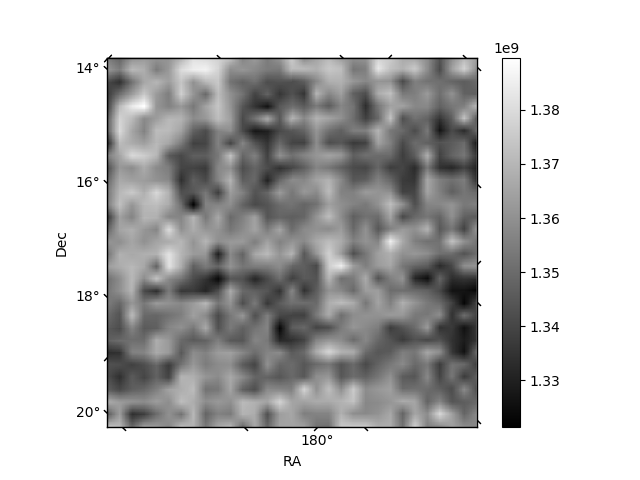
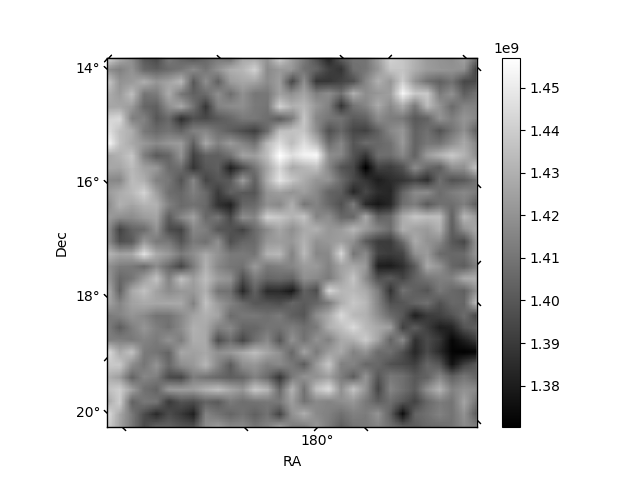
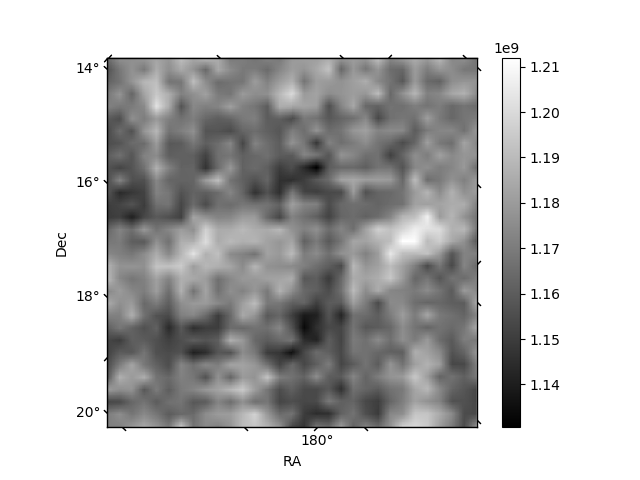
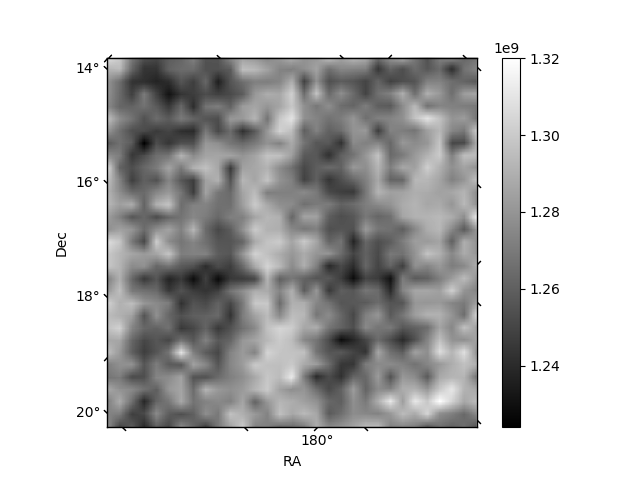
Histogram calculated using DETX and DETY for each event in the final _common_clean file
| Quadrant A | 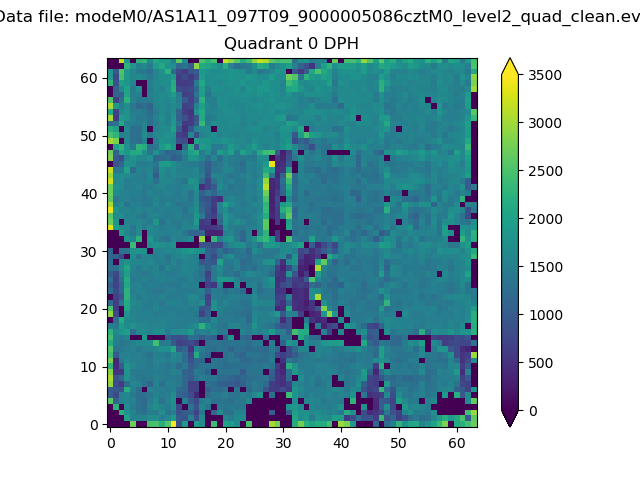 |
 |
Quadrant B |
|---|---|---|---|
| Quadrant D | 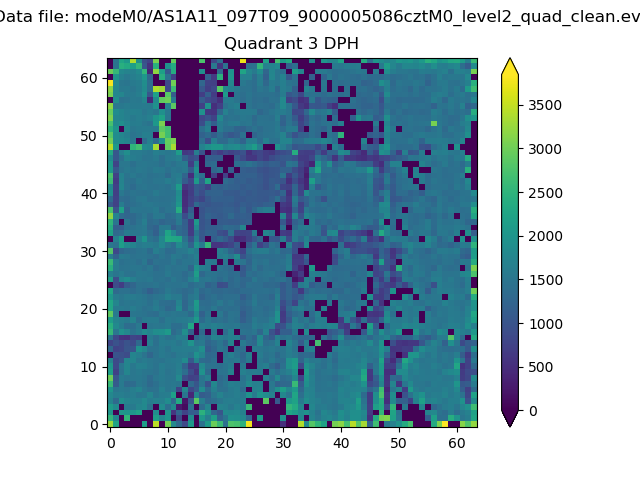 |
 |
Quadrant C |
| Plot type | Count rate plots | Images |
|---|---|---|
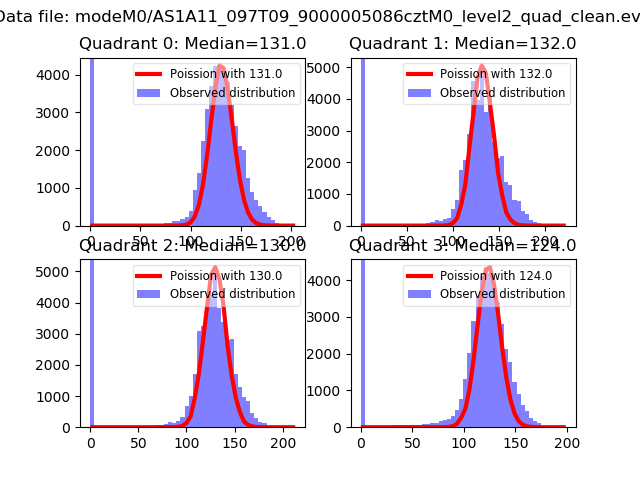
| Comparison with Poisson distribution Blue bars denote a histogram of data divided into 1 sec bins. Red curve is a Poisson curve with rate = median count rate of data. |
 |
 |
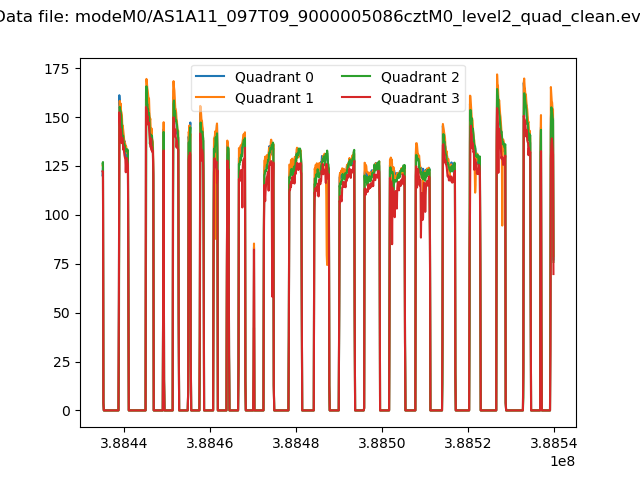
| Quadrant-wise count rates Data is divided into 100 sec bins |
 |
|
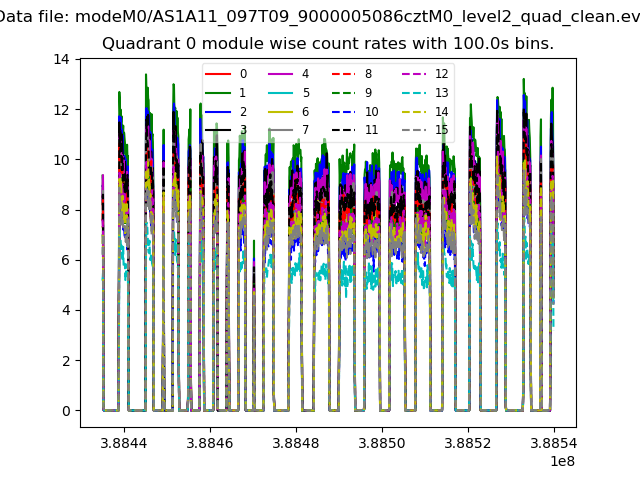
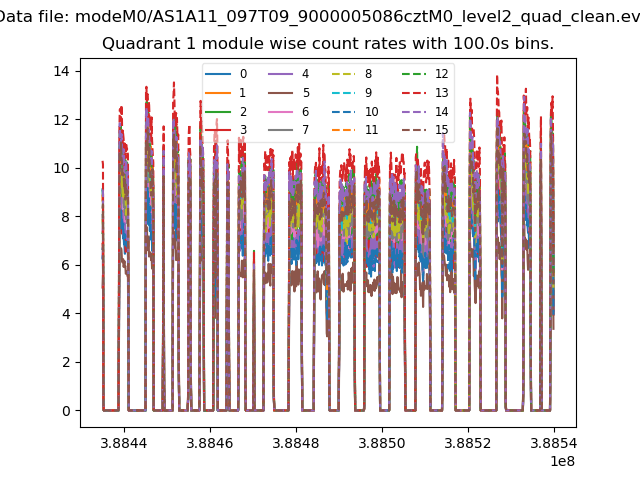
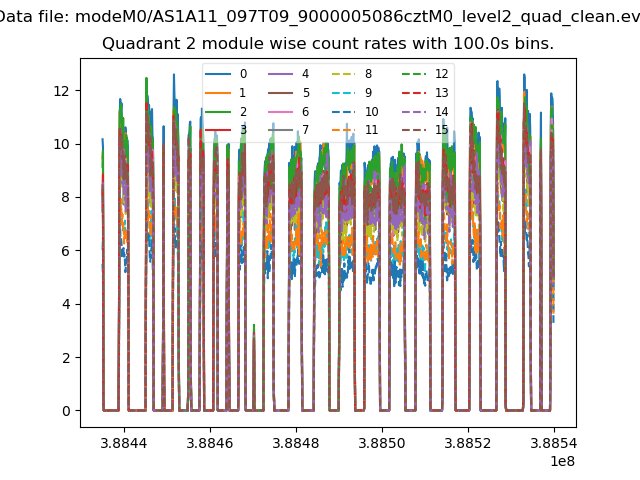
| Module-wise count rates for Quadrant A Data is divided into 100 sec bins |
 |
 |
| Module-wise count rates for Quadrant B Data is divided into 100 sec bins |
 |
 |
| Module-wise count rates for Quadrant C Data is divided into 100 sec bins |
 |
 |
| Module-wise count rates for Quadrant D Data is divided into 100 sec bins |
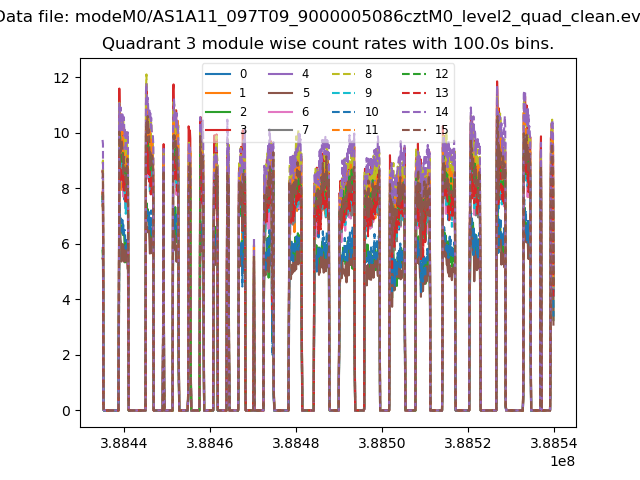 |
 |
| Parameter | Plot |
|---|---|
| CZT HV Monitor | 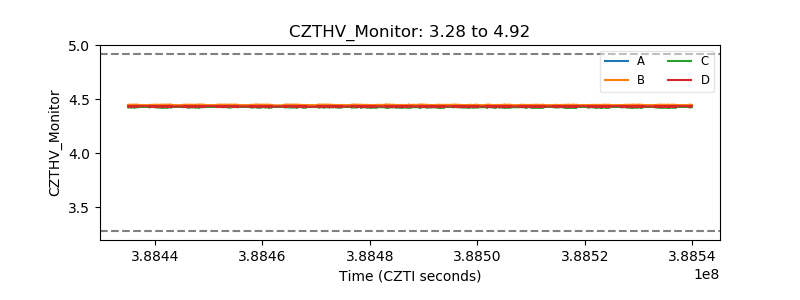 |
| D_VDD | 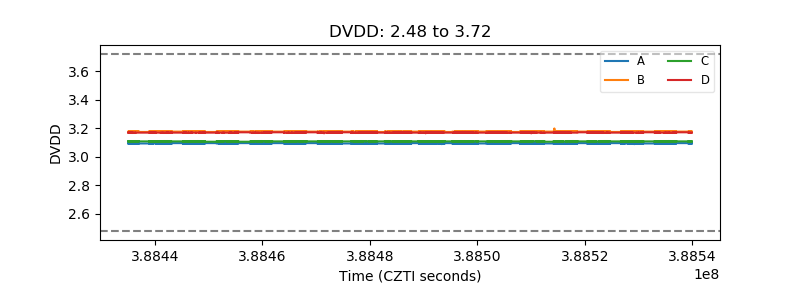 |
| Temperature 1 | 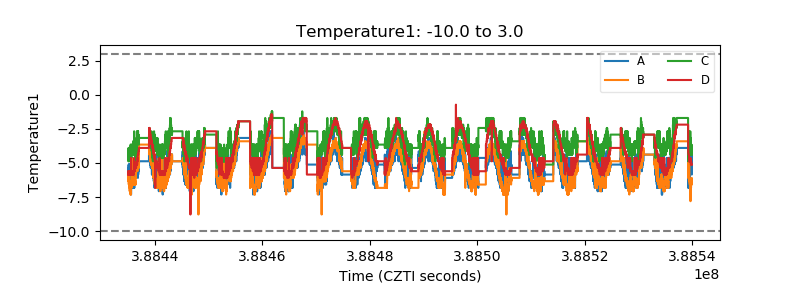 |
| Veto HV Monitor | 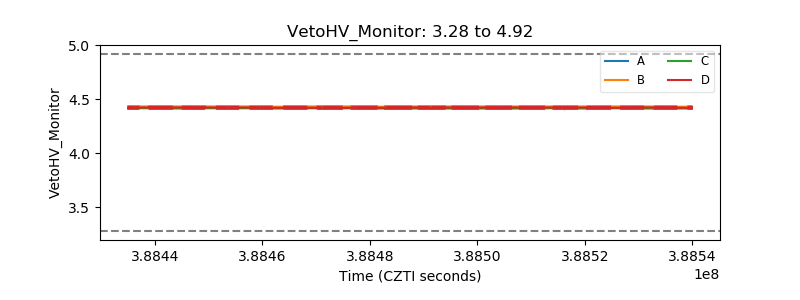 |
| Veto LLD | 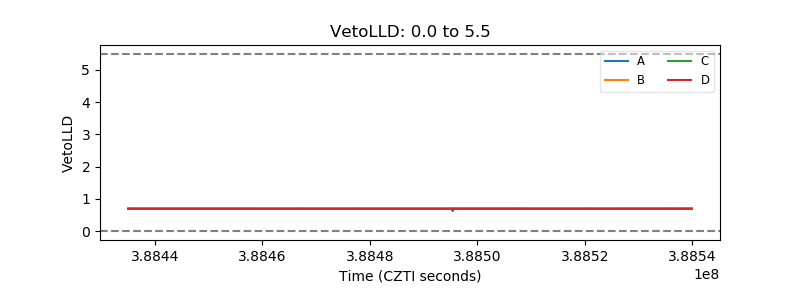 |
| Alpha Counter | 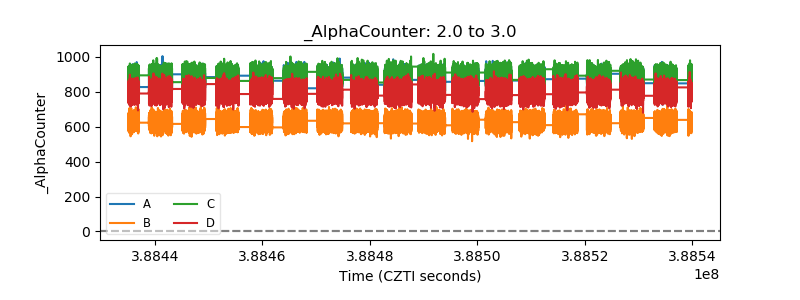 |
| _CPM_Rate | 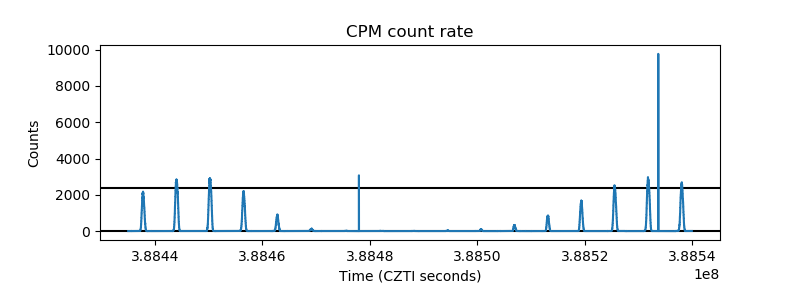 |
| CZT Counter | 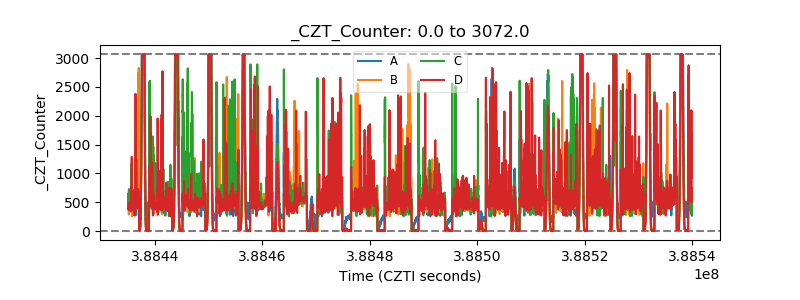 |
| +2.5 Volts monitor | 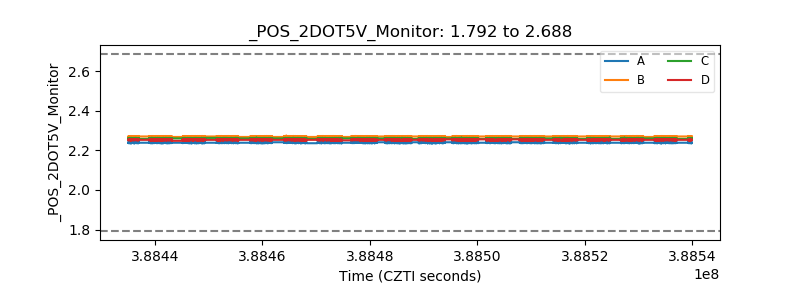 |
| +5 Volts monitor | 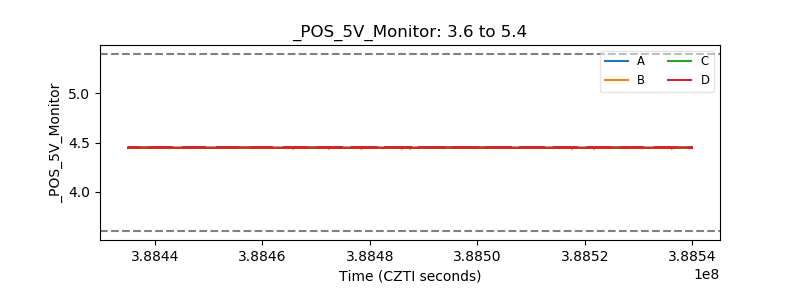 |
| _ROLL_ROT | 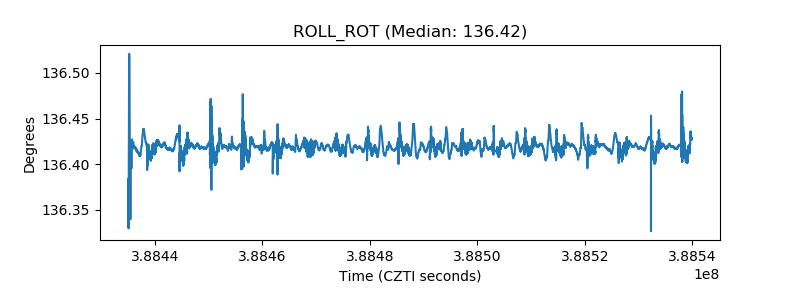 |
| _Roll_DEC | 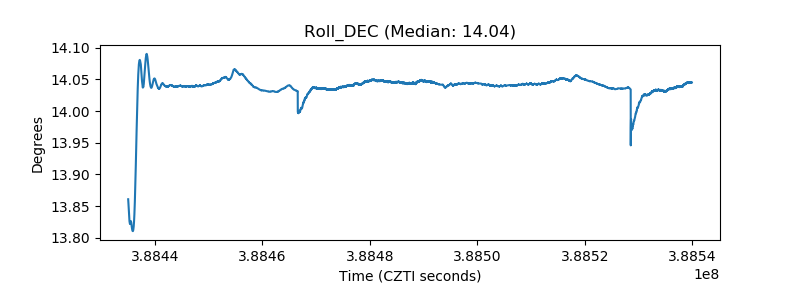 |
| _Roll_RA | 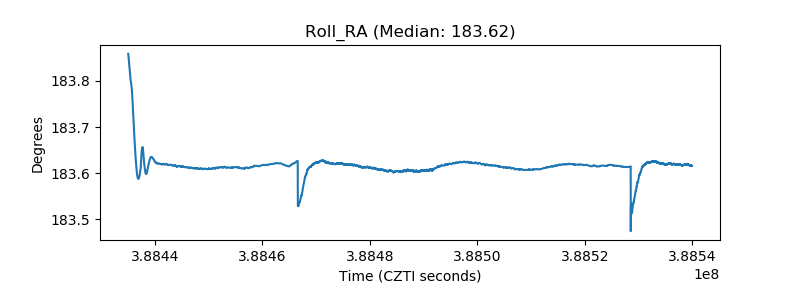 |
| Veto Counter | 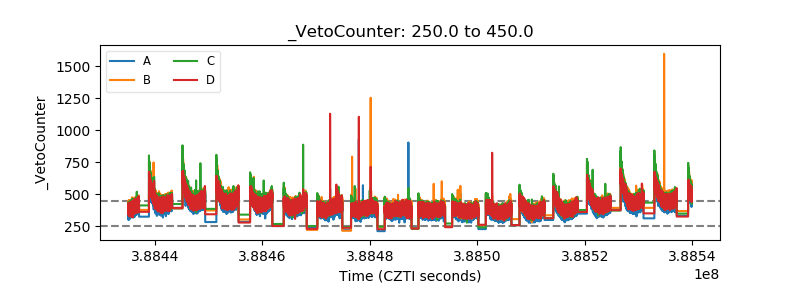 |