| Param | Original file | Final file |
|---|---|---|
| Filename | modeM0/AS1A11_097T07_9000005084_35520cztM0_level2.evt | modeM0/AS1A11_097T07_9000005084_35520cztM0_level2_quad_clean.evt |
| Size (bytes) | 146,983,680 | 39,168,000 |
| Size | 140.2 MB | 37.4 MB |
| Events in quadrant A | 1,005,013 | 263,679 |
| Events in quadrant B | 1,037,010 | 266,364 |
| Events in quadrant C | 1,239,273 | 259,337 |
| Events in quadrant D | 1,033,398 | 252,759 |
| Mode SS | |||
|---|---|---|---|
| Quadrant | BADHDUFLAG | Total packets | Discarded packets |
| A | 0 | 38 | 0 |
| B | 0 | 38 | 0 |
| C | 0 | 38 | 0 |
| D | 0 | 38 | 0 |
| Mode M0 | |||
|---|---|---|---|
| Quadrant | BADHDUFLAG | Total packets | Discarded packets |
| A | 0 | 4286 | 1 |
| B | 0 | 4391 | 1 |
| C | 0 | 4920 | 1 |
| D | 0 | 4316 | 1 |
| Mode M9 | |||
|---|---|---|---|
| Quadrant | BADHDUFLAG | Total packets | Discarded packets |
| A | 0 | 5 | 0 |
| B | 0 | 5 | 0 |
| C | 0 | 5 | 0 |
| D | 0 | 6 | 0 |
| Quadrant | Total seconds | Saturated seconds | Saturation percentage |
|---|---|---|---|
| A | 1978 | 6 | 0.303337% |
| B | 1978 | 15 | 0.758342% |
| C | 1978 | 58 | 2.932255% |
| D | 1978 | 9 | 0.455005% |
Noise dominated data is calculated using 1-second bins in cleaned event files. If a bin has >2000 counts, and if more than 50% of those come from <1% of pixels, then it is considered to be noise-dominated and hence unusable.
| Quadrant | # 1 sec bins | Bins with >0 counts | Bins with >2000 counts | High rate bins dominated by noise | Noise dominated (total time) | Noise dominated (detector-on time) | Marked lightcurve |
|---|---|---|---|---|---|---|---|
| A | 1978 | 1978 | 3 | 3 | 0.15% | 0.15% | 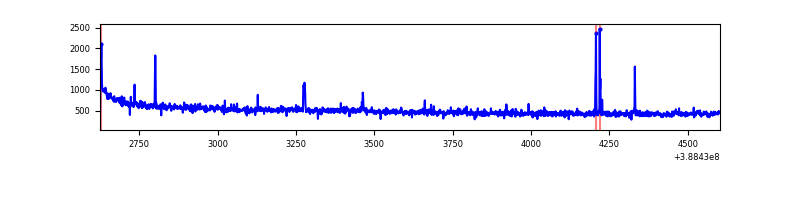 |
| B | 1978 | 1978 | 8 | 8 | 0.40% | 0.40% | 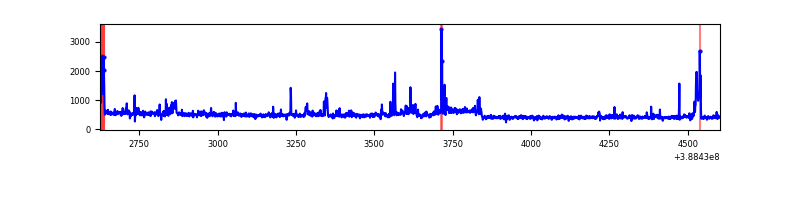 |
| C | 1978 | 1978 | 37 | 37 | 1.87% | 1.87% | 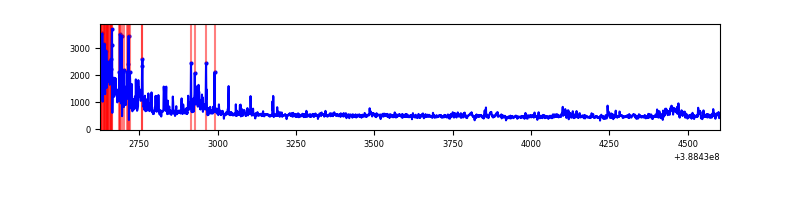 |
| D | 1978 | 1978 | 6 | 6 | 0.30% | 0.30% | 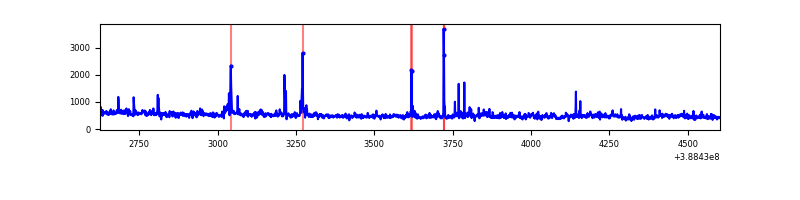 |
Top three noisy pixels from each quadrant. If the there are fewer than three noisy pixels in the level2.evt file, extra rows are filled as -1
| Pixel properties | Quadrant properties | ||||||
|---|---|---|---|---|---|---|---|
| Quadrant | DetID | PixID | Counts | Sigma | Mean | Median | Sigma |
| A | 10 | 83 | 60109 | 1270.53 | 227 | 223 | 47.1 |
| A | 15 | 169 | 36295 | 765.3 | 227 | 223 | 47.1 |
| A | 9 | 143 | 19055 | 399.54 | 227 | 223 | 47.1 |
| B | 5 | 172 | 73567 | 1660.66 | 225 | 220 | 44.2 |
| B | 5 | 236 | 64288 | 1450.57 | 225 | 220 | 44.2 |
| B | 12 | 111 | 5153 | 111.69 | 225 | 220 | 44.2 |
| C | 0 | 10 | 166904 | 3164.52 | 221 | 222 | 52.7 |
| C | 15 | 214 | 83743 | 1585.68 | 221 | 222 | 52.7 |
| C | 15 | 159 | 79725 | 1509.39 | 221 | 222 | 52.7 |
| D | 8 | 195 | 86054 | 1532.99 | 225 | 219 | 56.0 |
| D | 10 | 118 | 19831 | 350.26 | 225 | 219 | 56.0 |
| D | 12 | 6 | 19637 | 346.8 | 225 | 219 | 56.0 |
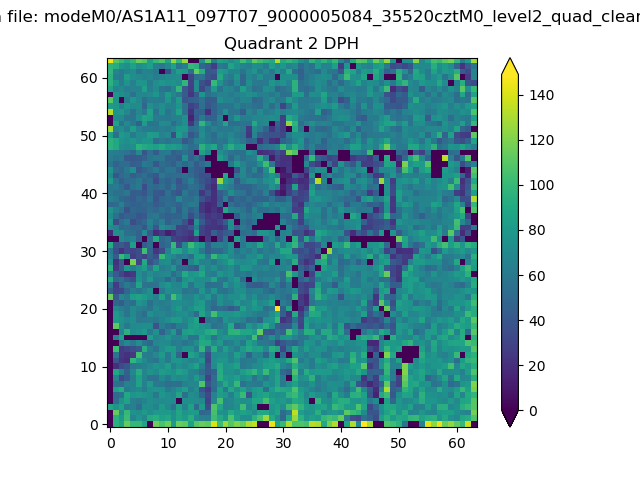
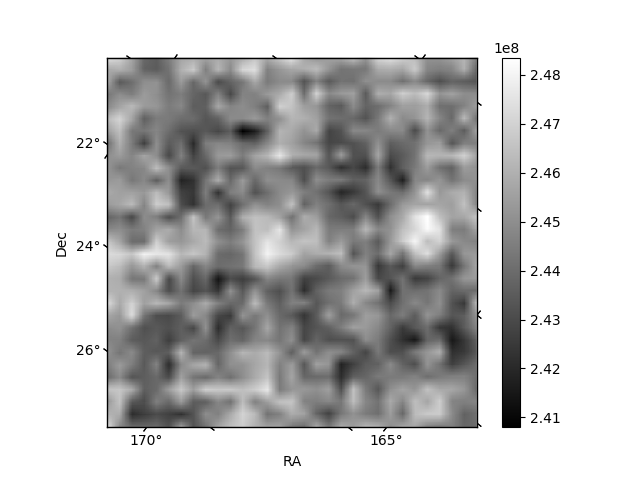
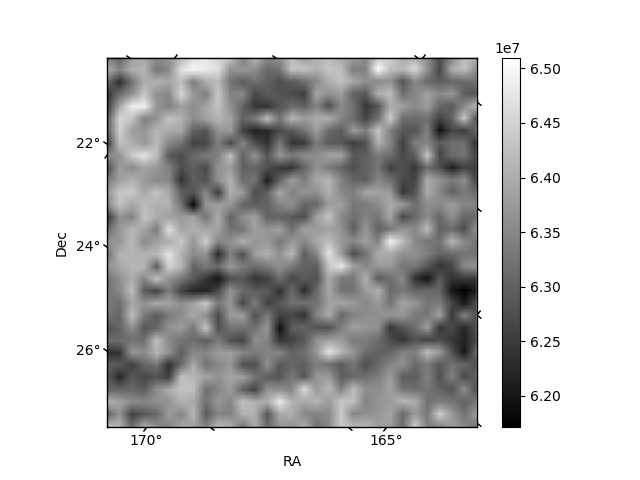
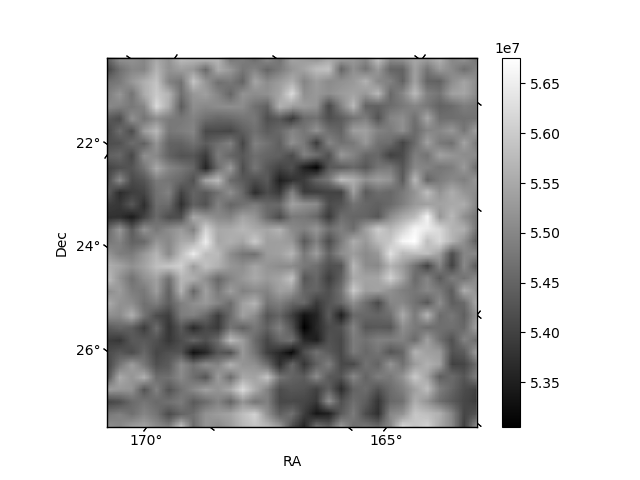
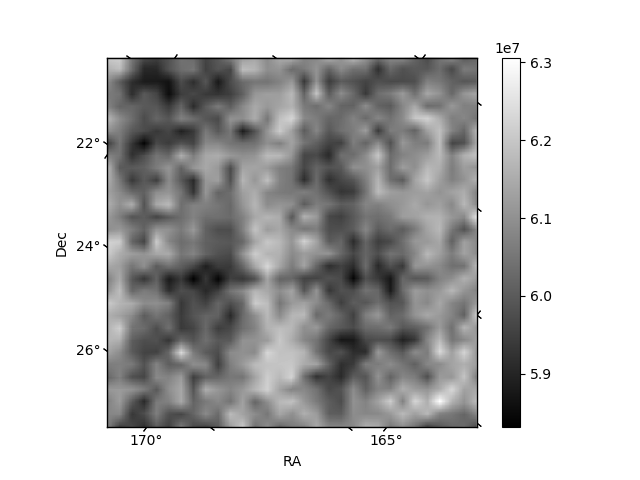
Histogram calculated using DETX and DETY for each event in the final _common_clean file
| Quadrant A | 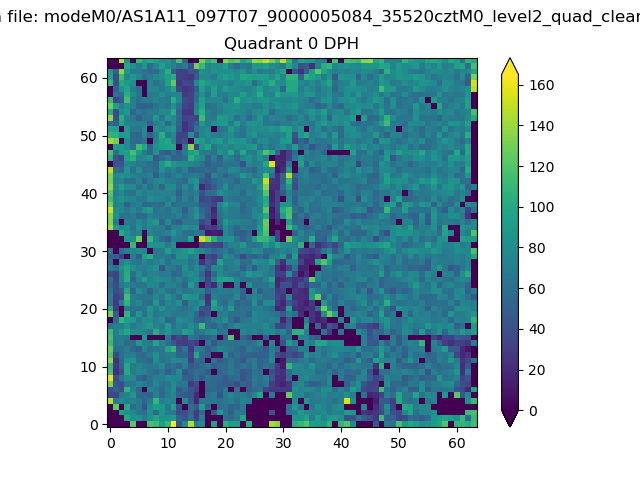 |
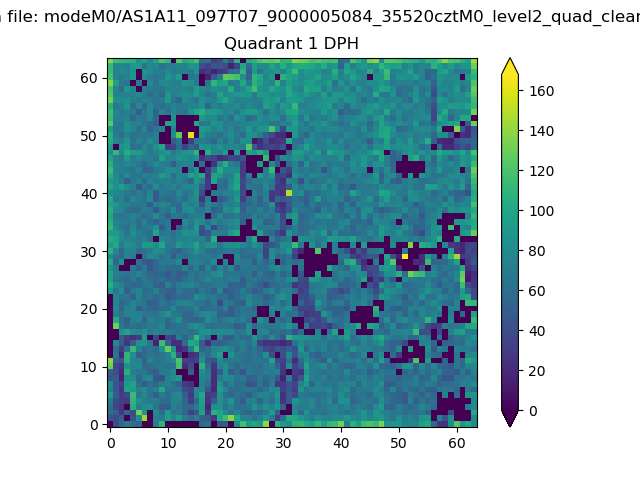 |
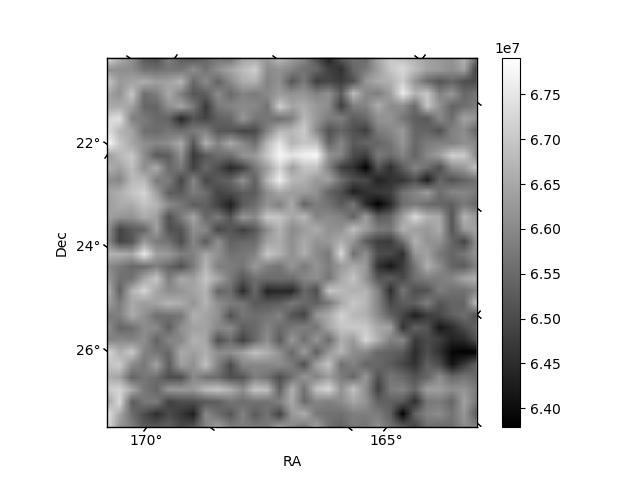
Quadrant B |
|---|---|---|---|
| Quadrant D | 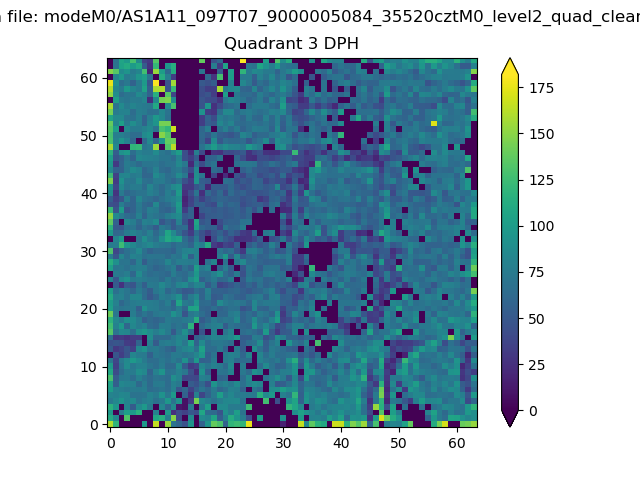 |
 |
Quadrant C |
| Plot type | Count rate plots | Images |
|---|---|---|
| Comparison with Poisson distribution Blue bars denote a histogram of data divided into 1 sec bins. Red curve is a Poisson curve with rate = median count rate of data. |
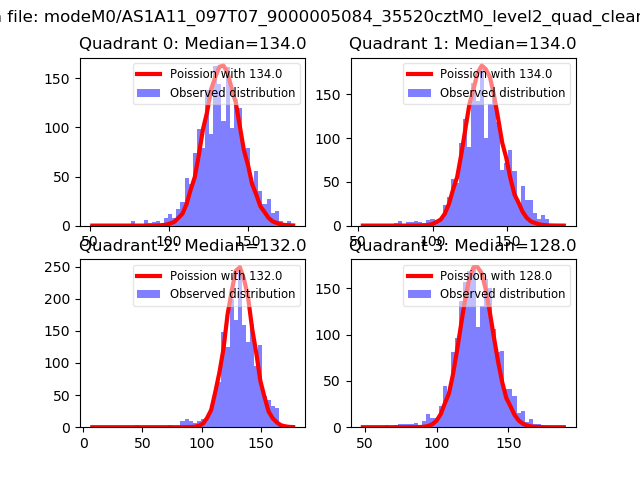 |
 |
| Quadrant-wise count rates Data is divided into 100 sec bins |
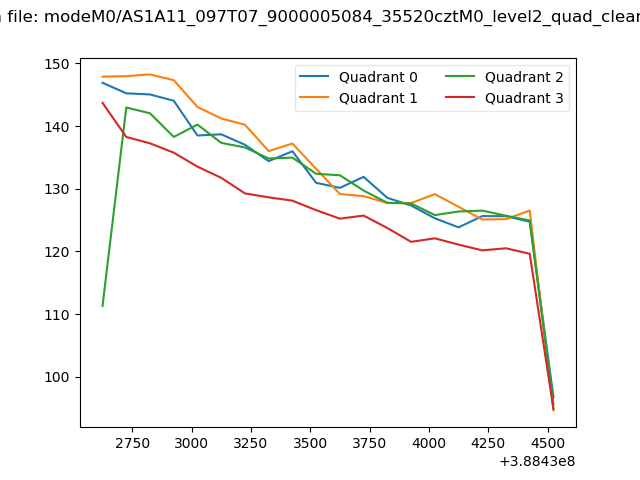 |
|
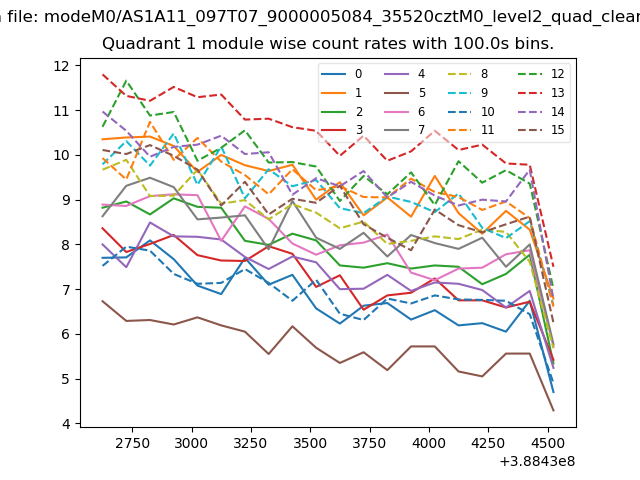
| Module-wise count rates for Quadrant A Data is divided into 100 sec bins |
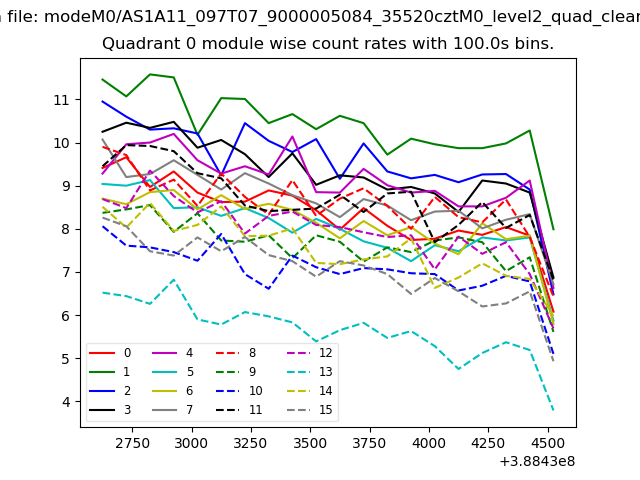 |
 |
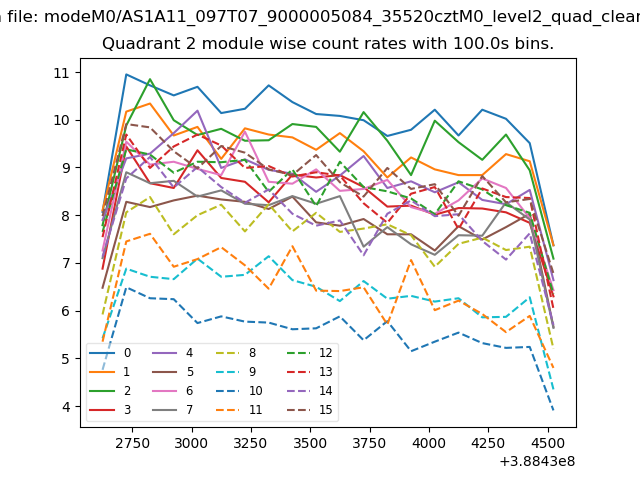
| Module-wise count rates for Quadrant B Data is divided into 100 sec bins |
 |
 |
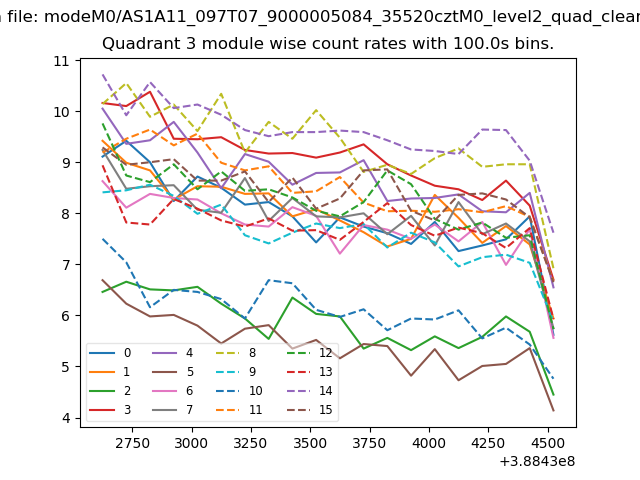
| Module-wise count rates for Quadrant C Data is divided into 100 sec bins |
 |
 |
| Module-wise count rates for Quadrant D Data is divided into 100 sec bins |
 |
 |
| Parameter | Plot |
|---|---|
| CZT HV Monitor | 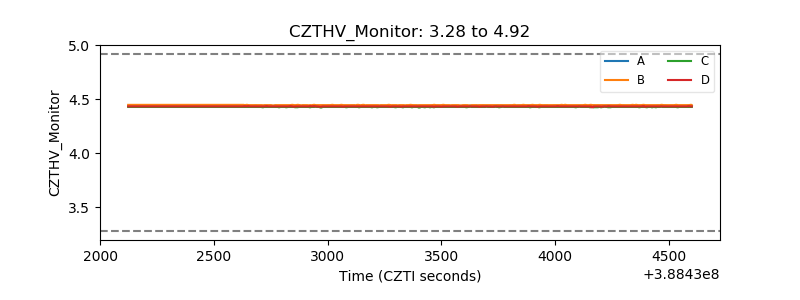 |
| D_VDD | 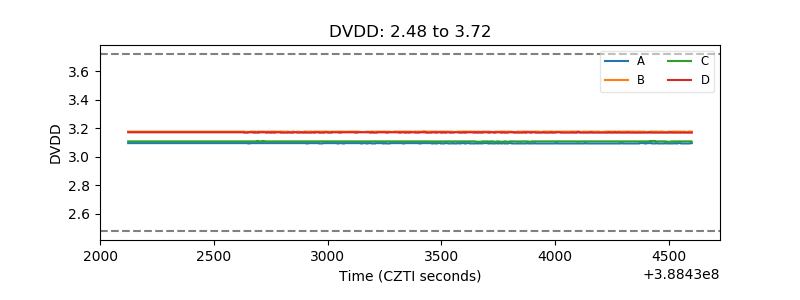 |
| Temperature 1 | 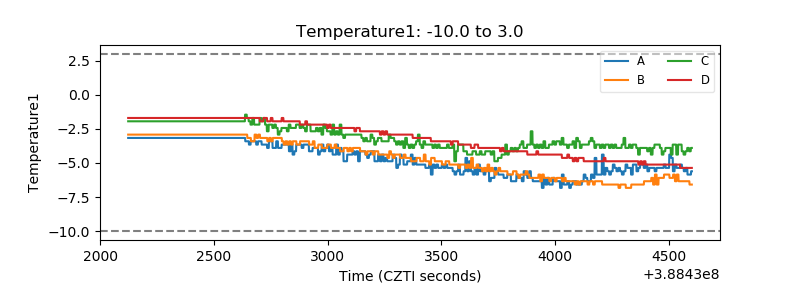 |
| Veto HV Monitor | 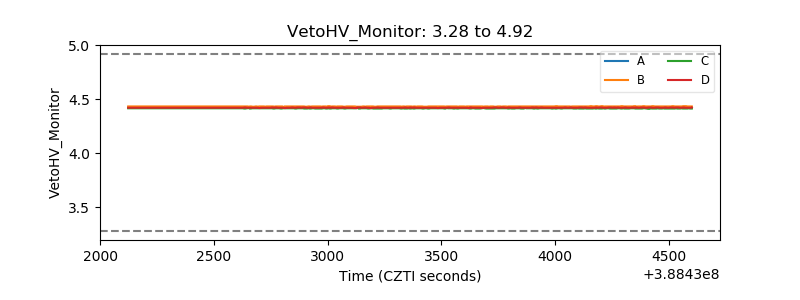 |
| Veto LLD | 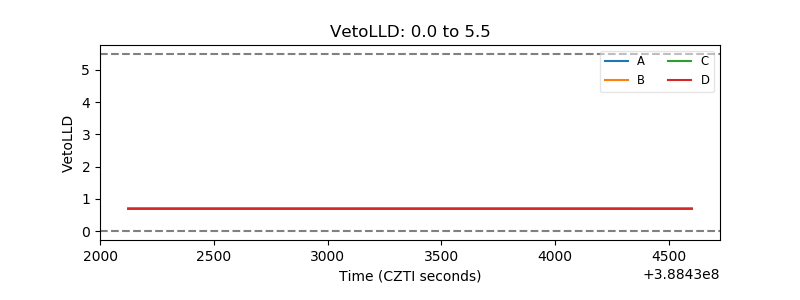 |
| Alpha Counter | 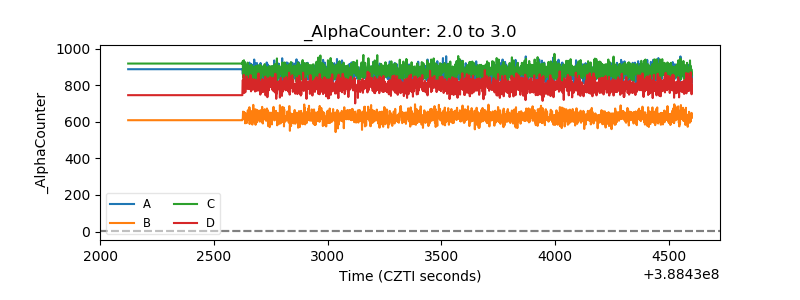 |
| _CPM_Rate | 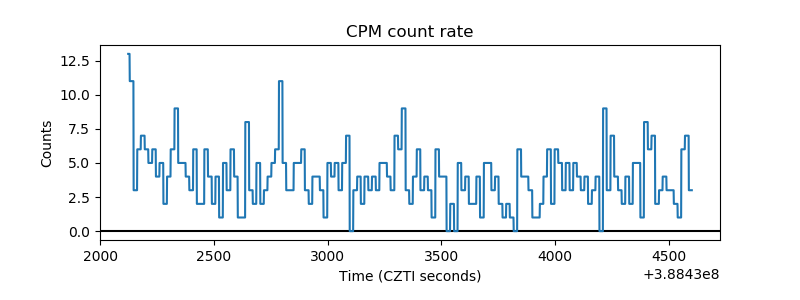 |
| CZT Counter | 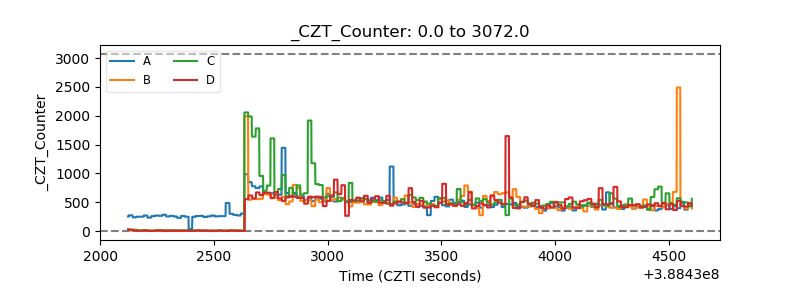 |
| +2.5 Volts monitor | 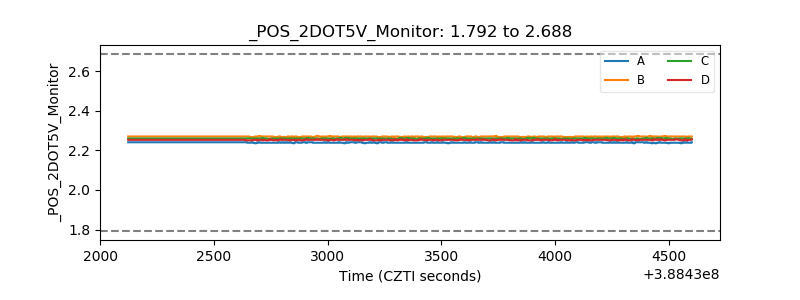 |
| +5 Volts monitor | 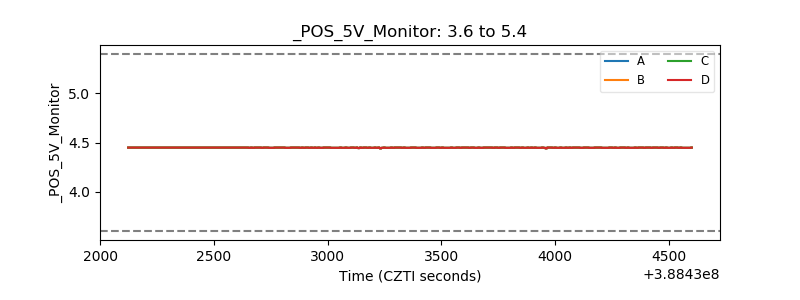 |
| _ROLL_ROT | 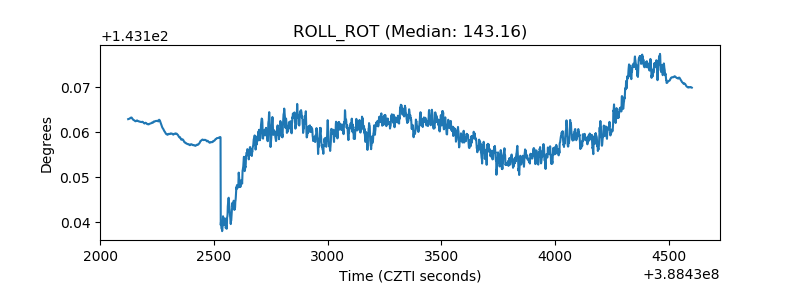 |
| _Roll_DEC | 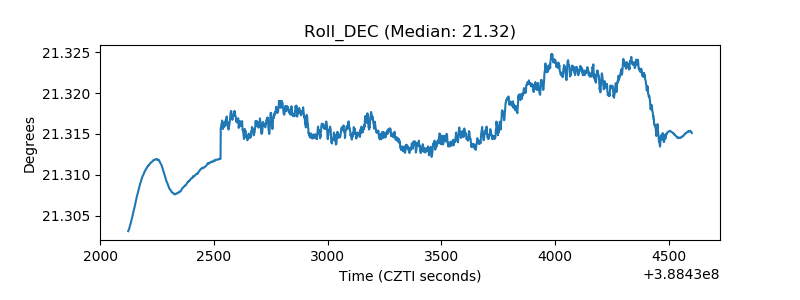 |
| _Roll_RA | 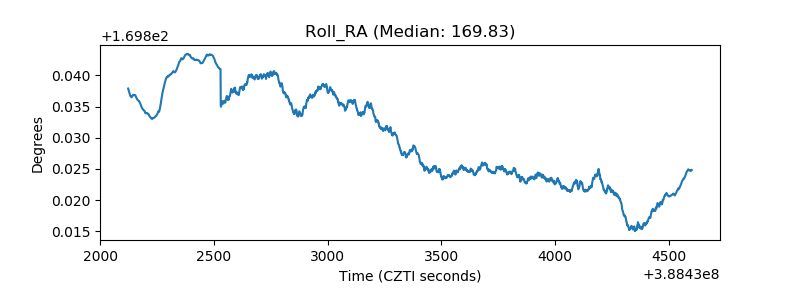 |
| Veto Counter | 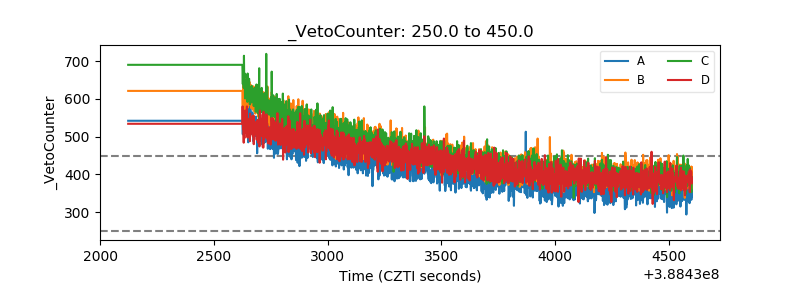 |