| Param | Original file | Final file |
|---|---|---|
| Filename | modeM0/AS1A11_097T07_9000005084_35518cztM0_level2.evt | modeM0/AS1A11_097T07_9000005084_35518cztM0_level2_quad_clean.evt |
| Size (bytes) | 402,419,520 | 74,088,000 |
| Size | 383.8 MB | 70.7 MB |
| Events in quadrant A | 2,758,281 | 473,870 |
| Events in quadrant B | 2,738,299 | 477,220 |
| Events in quadrant C | 3,058,952 | 468,161 |
| Events in quadrant D | 3,264,906 | 446,526 |
| Mode SS | |||
|---|---|---|---|
| Quadrant | BADHDUFLAG | Total packets | Discarded packets |
| A | 0 | 110 | 0 |
| B | 0 | 110 | 0 |
| C | 0 | 110 | 0 |
| D | 0 | 110 | 0 |
| Mode M0 | |||
|---|---|---|---|
| Quadrant | BADHDUFLAG | Total packets | Discarded packets |
| A | 0 | 11703 | 3 |
| B | 0 | 11672 | 2 |
| C | 0 | 12377 | 2 |
| D | 0 | 13277 | 2 |
| Mode M9 | |||
|---|---|---|---|
| Quadrant | BADHDUFLAG | Total packets | Discarded packets |
| A | 0 | 34 | 0 |
| B | 0 | 34 | 0 |
| C | 0 | 34 | 0 |
| D | 0 | 34 | 0 |
| Quadrant | Total seconds | Saturated seconds | Saturation percentage |
|---|---|---|---|
| A | 5401 | 26 | 0.481392% |
| B | 5401 | 24 | 0.444362% |
| C | 5401 | 92 | 1.703388% |
| D | 5401 | 173 | 3.203111% |
Noise dominated data is calculated using 1-second bins in cleaned event files. If a bin has >2000 counts, and if more than 50% of those come from <1% of pixels, then it is considered to be noise-dominated and hence unusable.
| Quadrant | # 1 sec bins | Bins with >0 counts | Bins with >2000 counts | High rate bins dominated by noise | Noise dominated (total time) | Noise dominated (detector-on time) | Marked lightcurve |
|---|---|---|---|---|---|---|---|
| A | 8715 | 5403 | 17 | 17 | 0.20% | 0.31% | 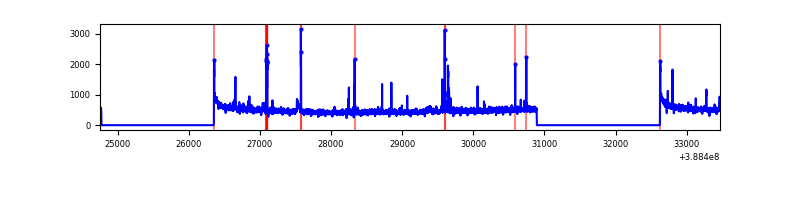 |
| B | 8715 | 5403 | 11 | 11 | 0.13% | 0.20% |  |
| C | 8715 | 5403 | 53 | 53 | 0.61% | 0.98% | 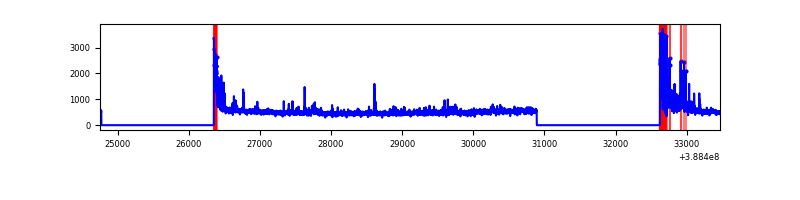 |
| D | 8715 | 5403 | 147 | 147 | 1.69% | 2.72% | 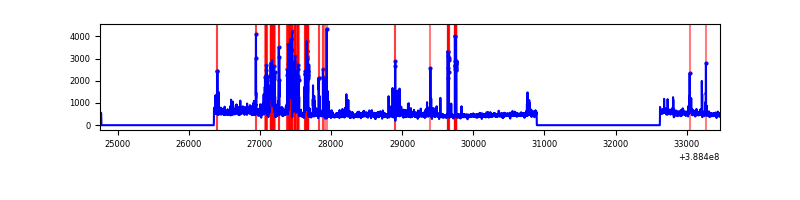 |
Top three noisy pixels from each quadrant. If the there are fewer than three noisy pixels in the level2.evt file, extra rows are filled as -1
| Pixel properties | Quadrant properties | ||||||
|---|---|---|---|---|---|---|---|
| Quadrant | DetID | PixID | Counts | Sigma | Mean | Median | Sigma |
| A | 15 | 169 | 148797 | 1178.86 | 623 | 609 | 125.7 |
| A | 10 | 83 | 137855 | 1091.82 | 623 | 609 | 125.7 |
| A | 9 | 143 | 47147 | 370.22 | 623 | 609 | 125.7 |
| B | 5 | 236 | 105546 | 879.35 | 618 | 602 | 119.3 |
| B | 5 | 172 | 102766 | 856.06 | 618 | 602 | 119.3 |
| B | 5 | 200 | 36082 | 297.3 | 618 | 602 | 119.3 |
| C | 0 | 10 | 280728 | 1969.12 | 608 | 611 | 142.3 |
| C | 15 | 214 | 224407 | 1573.21 | 608 | 611 | 142.3 |
| C | 15 | 159 | 80401 | 560.9 | 608 | 611 | 142.3 |
| D | 10 | 118 | 471638 | 3177.42 | 604 | 587 | 148.2 |
| D | 8 | 195 | 179208 | 1204.87 | 604 | 587 | 148.2 |
| D | 13 | 249 | 114584 | 768.95 | 604 | 587 | 148.2 |
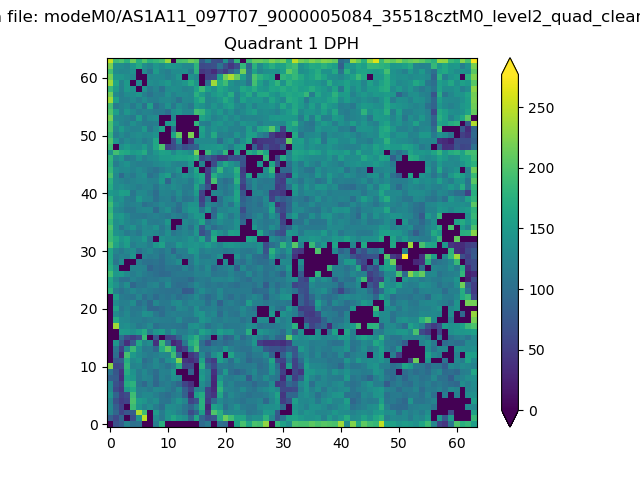
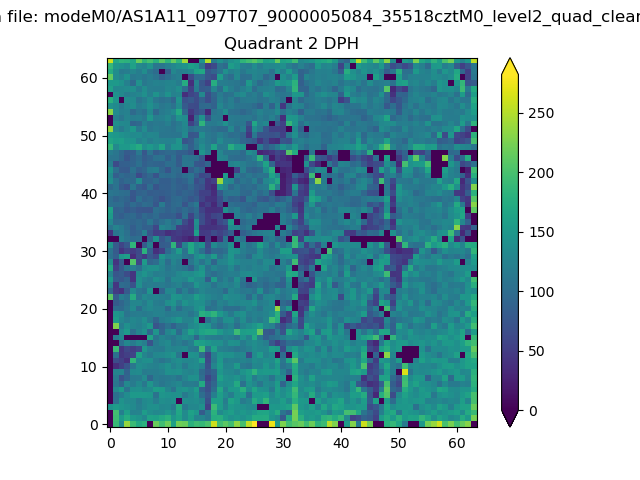
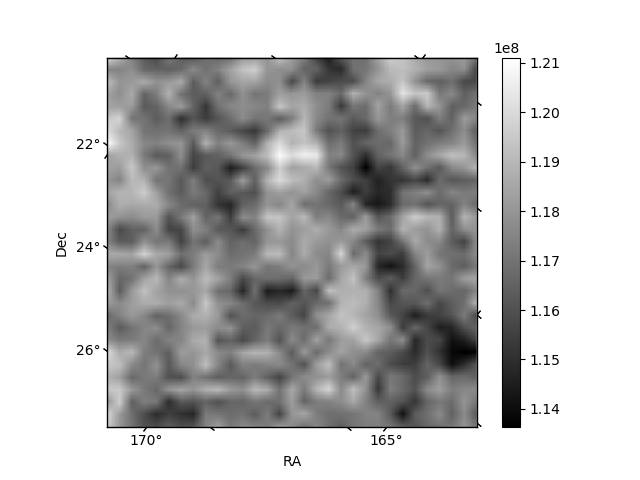
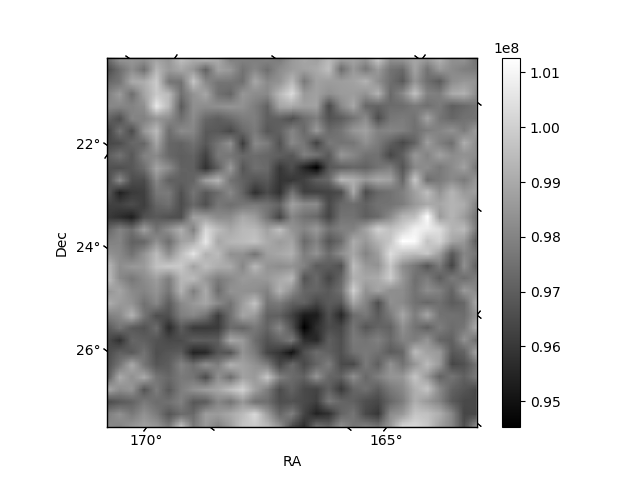
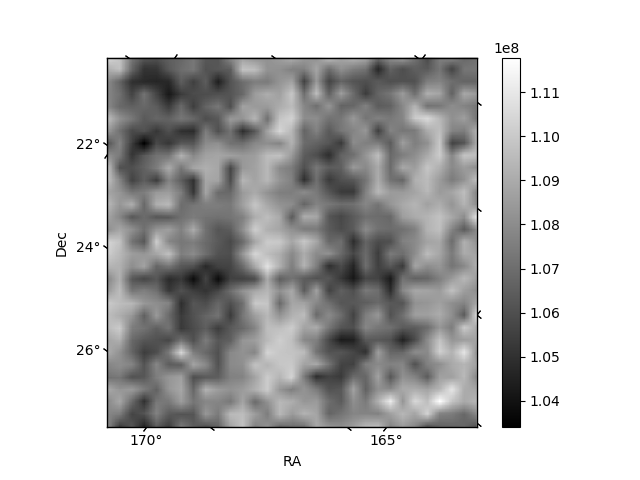
Histogram calculated using DETX and DETY for each event in the final _common_clean file
| Quadrant A | 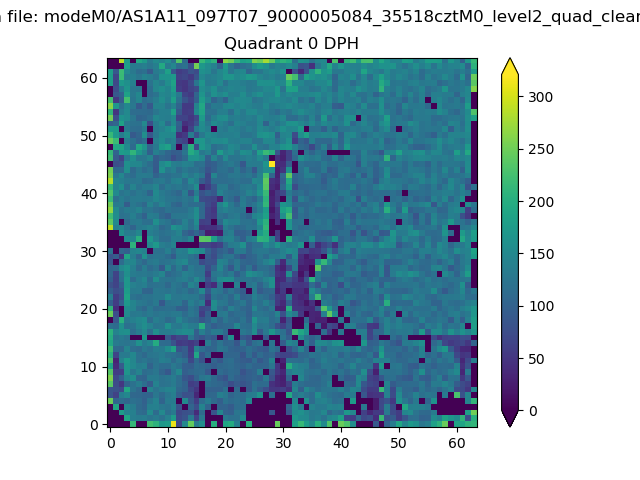 |
 |
Quadrant B |
|---|---|---|---|
| Quadrant D |  |
 |
Quadrant C |
| Plot type | Count rate plots | Images |
|---|---|---|
| Comparison with Poisson distribution Blue bars denote a histogram of data divided into 1 sec bins. Red curve is a Poisson curve with rate = median count rate of data. |
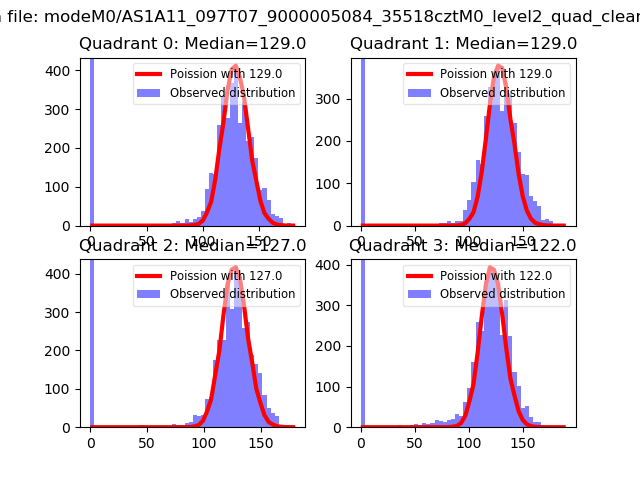 |
 |
| Quadrant-wise count rates Data is divided into 100 sec bins |
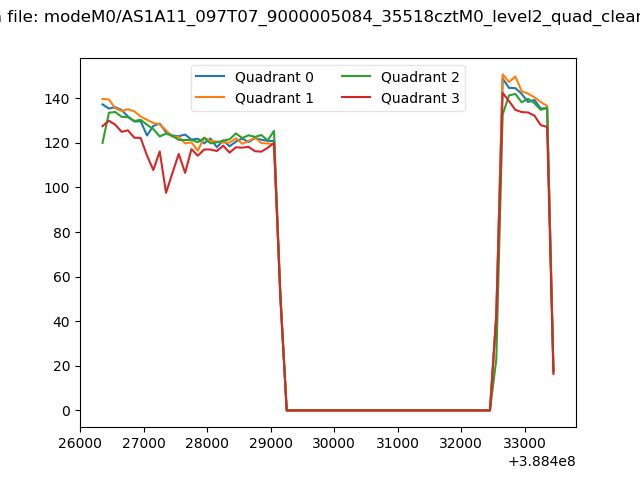 |
|
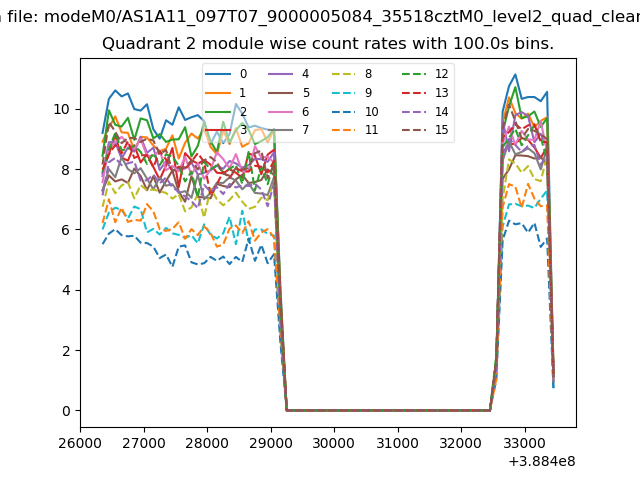
| Module-wise count rates for Quadrant A Data is divided into 100 sec bins |
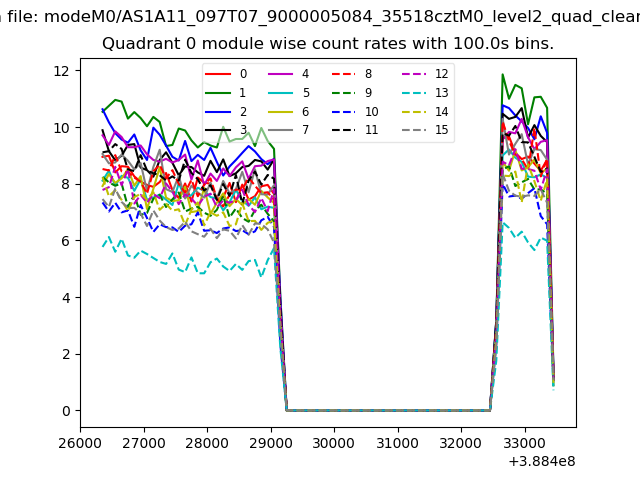 |
 |
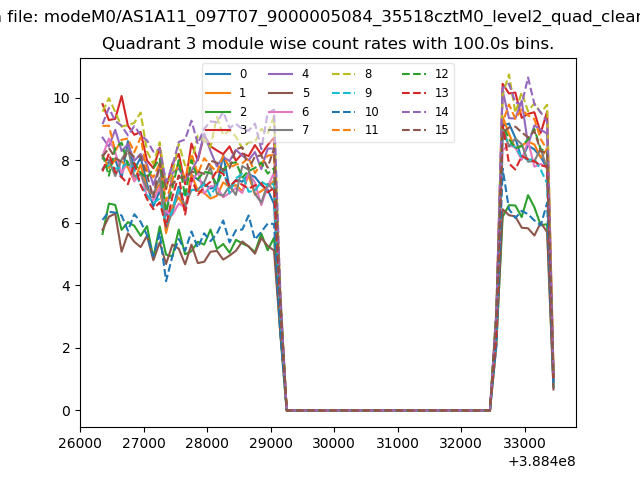
| Module-wise count rates for Quadrant B Data is divided into 100 sec bins |
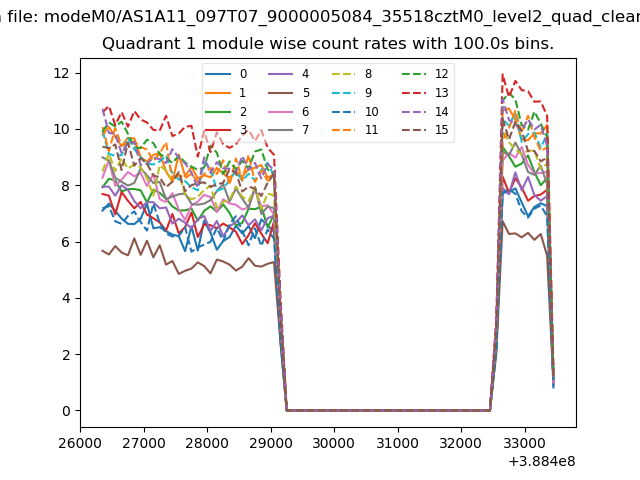 |
 |
| Module-wise count rates for Quadrant C Data is divided into 100 sec bins |
 |
 |
| Module-wise count rates for Quadrant D Data is divided into 100 sec bins |
 |
 |
| Parameter | Plot |
|---|---|
| CZT HV Monitor | 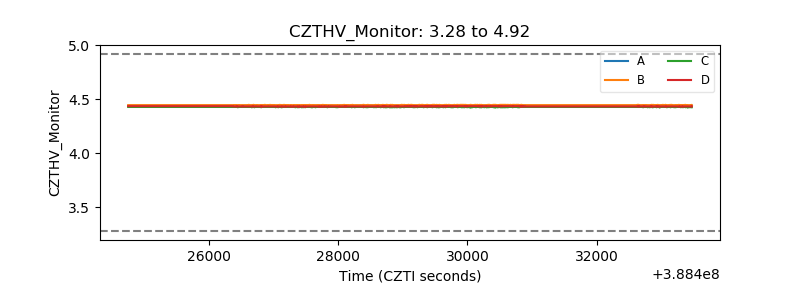 |
| D_VDD | 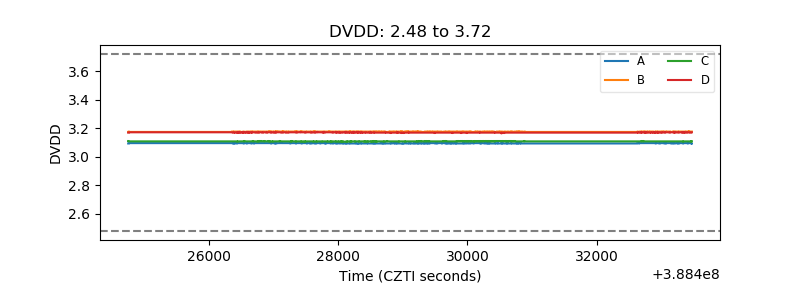 |
| Temperature 1 | 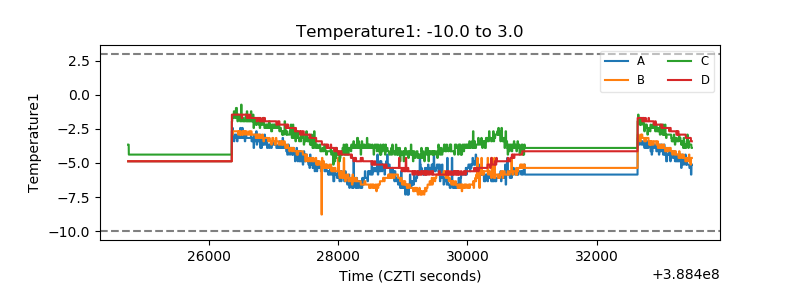 |
| Veto HV Monitor | 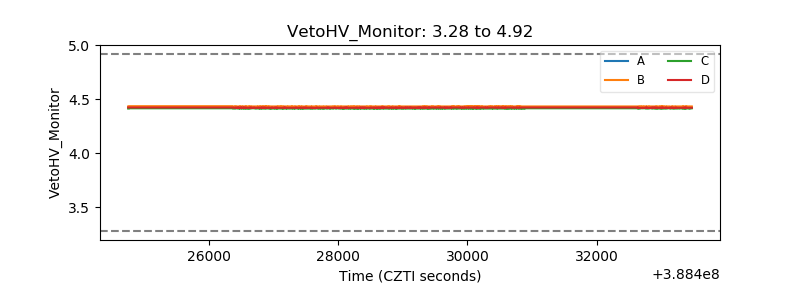 |
| Veto LLD | 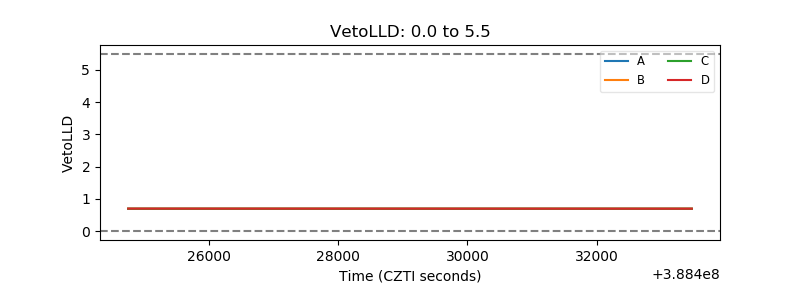 |
| Alpha Counter | 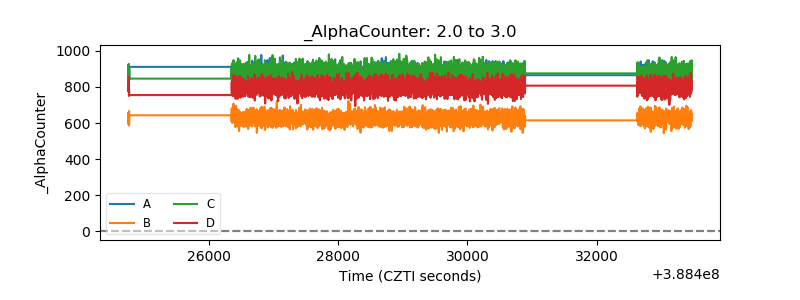 |
| _CPM_Rate | 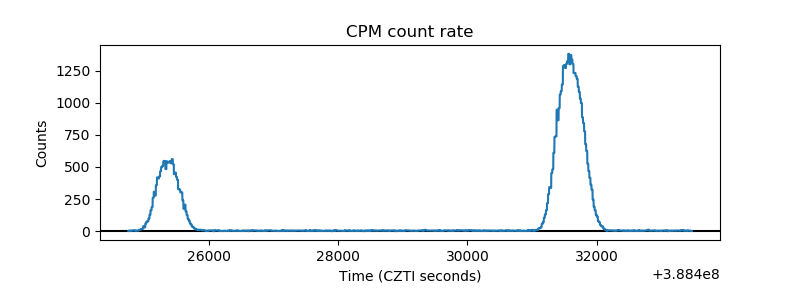 |
| CZT Counter | 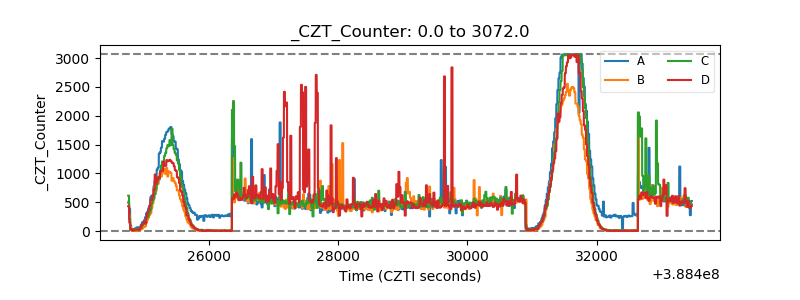 |
| +2.5 Volts monitor | 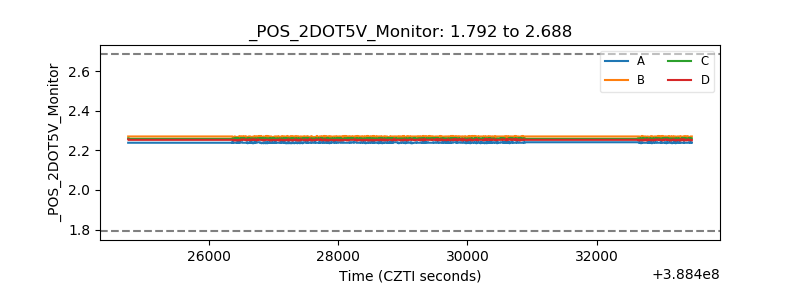 |
| +5 Volts monitor | 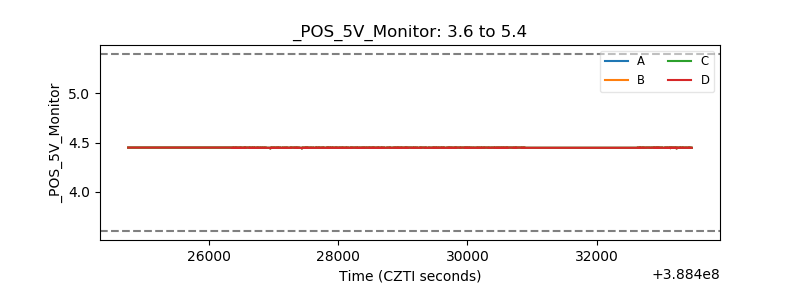 |
| _ROLL_ROT | 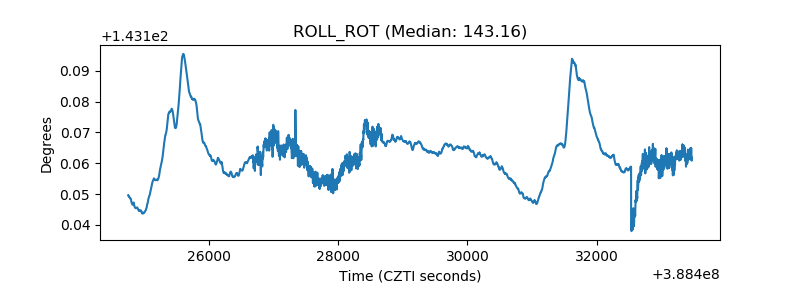 |
| _Roll_DEC | 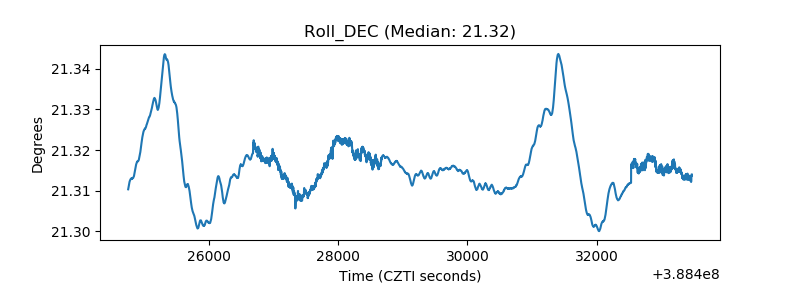 |
| _Roll_RA | 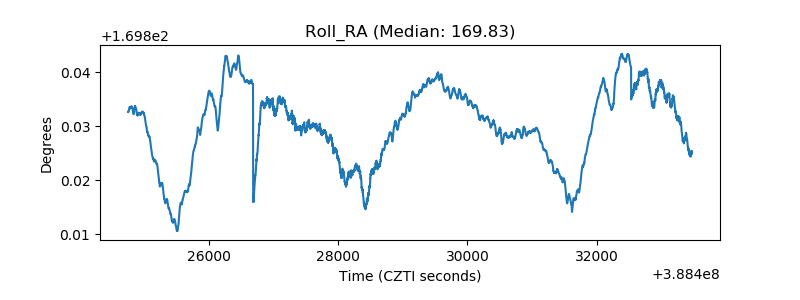 |
| Veto Counter | 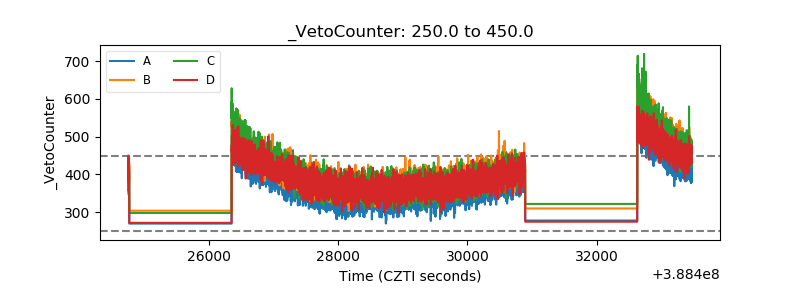 |