| Param | Original file | Final file |
|---|---|---|
| Filename | modeM0/AS1A11_097T07_9000005084_35513cztM0_level2.evt | modeM0/AS1A11_097T07_9000005084_35513cztM0_level2_quad_clean.evt |
| Size (bytes) | 420,595,200 | 74,433,600 |
| Size | 401.1 MB | 71.0 MB |
| Events in quadrant A | 2,817,213 | 464,551 |
| Events in quadrant B | 3,064,202 | 468,629 |
| Events in quadrant C | 3,352,133 | 461,441 |
| Events in quadrant D | 3,098,411 | 442,241 |
| Mode SS | |||
|---|---|---|---|
| Quadrant | BADHDUFLAG | Total packets | Discarded packets |
| A | 0 | 124 | 0 |
| B | 0 | 124 | 0 |
| C | 0 | 124 | 0 |
| D | 0 | 124 | 0 |
| Mode M0 | |||
|---|---|---|---|
| Quadrant | BADHDUFLAG | Total packets | Discarded packets |
| A | 0 | 12156 | 3 |
| B | 0 | 12929 | 2 |
| C | 0 | 13458 | 2 |
| D | 0 | 13073 | 2 |
| Mode M9 | |||
|---|---|---|---|
| Quadrant | BADHDUFLAG | Total packets | Discarded packets |
| A | 0 | 28 | 0 |
| B | 0 | 28 | 0 |
| C | 0 | 28 | 0 |
| D | 0 | 28 | 0 |
| Quadrant | Total seconds | Saturated seconds | Saturation percentage |
|---|---|---|---|
| A | 5968 | 6 | 0.100536% |
| B | 5968 | 57 | 0.955094% |
| C | 5968 | 90 | 1.508043% |
| D | 5968 | 60 | 1.005362% |
Noise dominated data is calculated using 1-second bins in cleaned event files. If a bin has >2000 counts, and if more than 50% of those come from <1% of pixels, then it is considered to be noise-dominated and hence unusable.
| Quadrant | # 1 sec bins | Bins with >0 counts | Bins with >2000 counts | High rate bins dominated by noise | Noise dominated (total time) | Noise dominated (detector-on time) | Marked lightcurve |
|---|---|---|---|---|---|---|---|
| A | 8805 | 5970 | 0 | 0 | 0.00% | 0.00% | 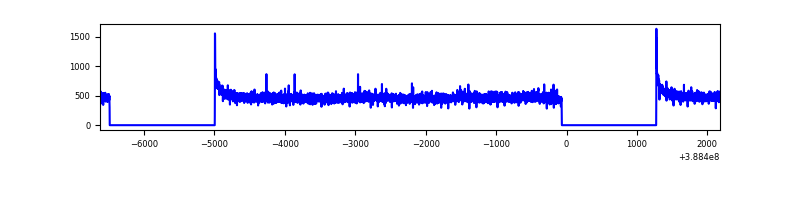 |
| B | 8805 | 5970 | 33 | 33 | 0.37% | 0.55% | 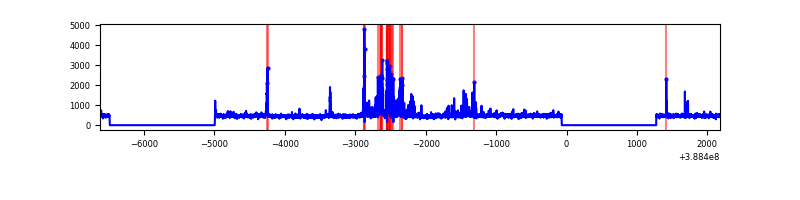 |
| C | 8805 | 5970 | 56 | 56 | 0.64% | 0.94% | 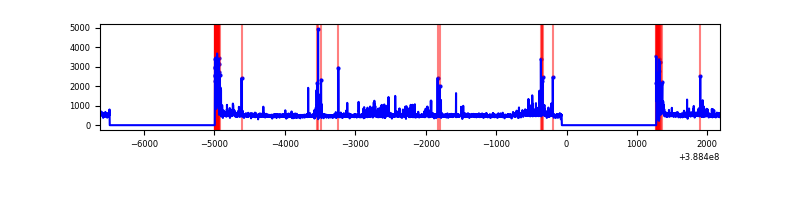 |
| D | 8805 | 5970 | 47 | 47 | 0.53% | 0.79% | 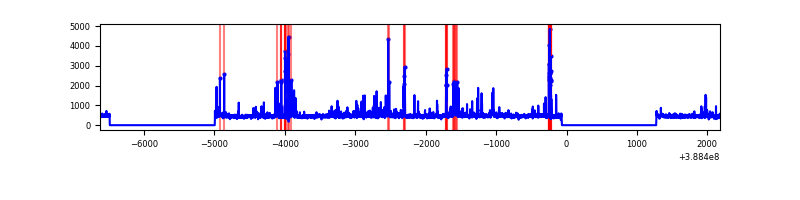 |
Top three noisy pixels from each quadrant. If the there are fewer than three noisy pixels in the level2.evt file, extra rows are filled as -1
| Pixel properties | Quadrant properties | ||||||
|---|---|---|---|---|---|---|---|
| Quadrant | DetID | PixID | Counts | Sigma | Mean | Median | Sigma |
| A | 10 | 83 | 142792 | 1019.47 | 690 | 674 | 139.4 |
| A | 13 | 254 | 8833 | 58.53 | 690 | 674 | 139.4 |
| A | 3 | 137 | 7197 | 46.79 | 690 | 674 | 139.4 |
| B | 5 | 172 | 260394 | 1951.88 | 683 | 664 | 133.1 |
| B | 5 | 236 | 50080 | 371.36 | 683 | 664 | 133.1 |
| B | 5 | 200 | 45859 | 339.64 | 683 | 664 | 133.1 |
| C | 15 | 214 | 247538 | 1557.06 | 670 | 673 | 158.5 |
| C | 0 | 10 | 242107 | 1522.81 | 670 | 673 | 158.5 |
| C | 0 | 207 | 219980 | 1383.25 | 670 | 673 | 158.5 |
| D | 10 | 118 | 121360 | 739.06 | 667 | 650 | 163.3 |
| D | 7 | 223 | 106515 | 648.17 | 667 | 650 | 163.3 |
| D | 8 | 195 | 90209 | 548.33 | 667 | 650 | 163.3 |
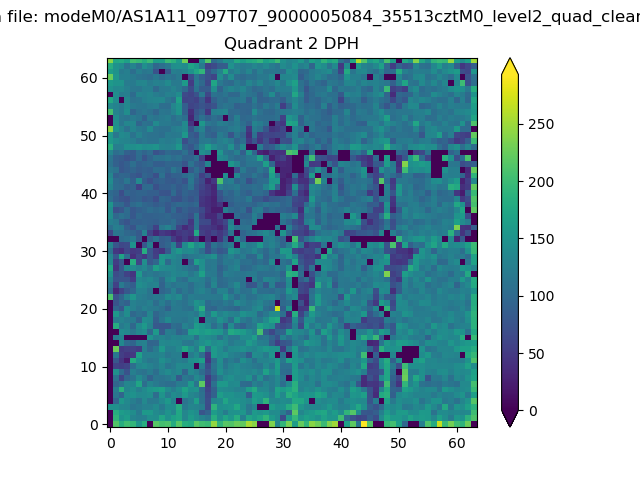
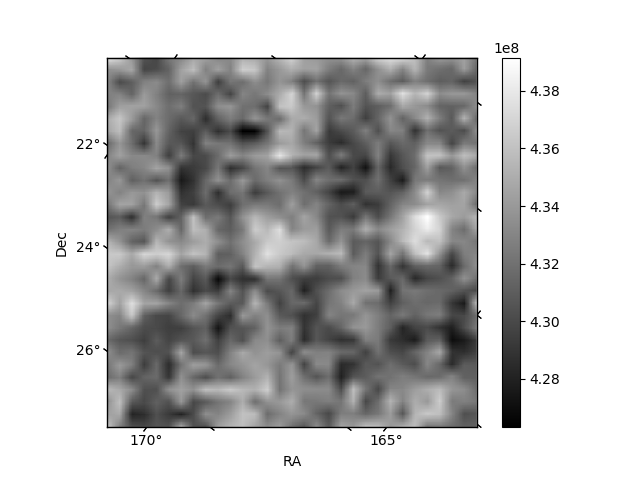
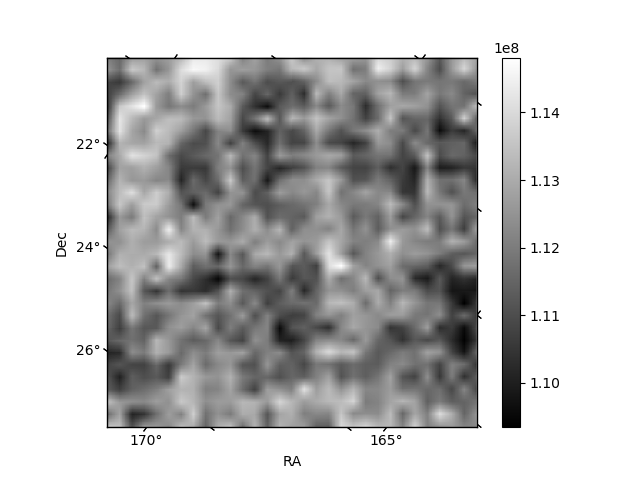
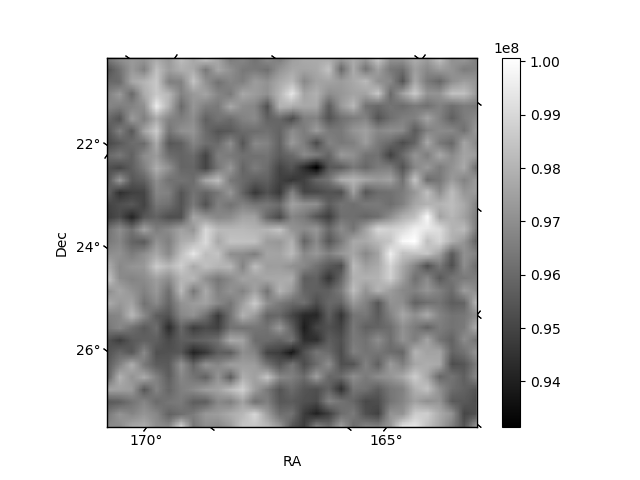
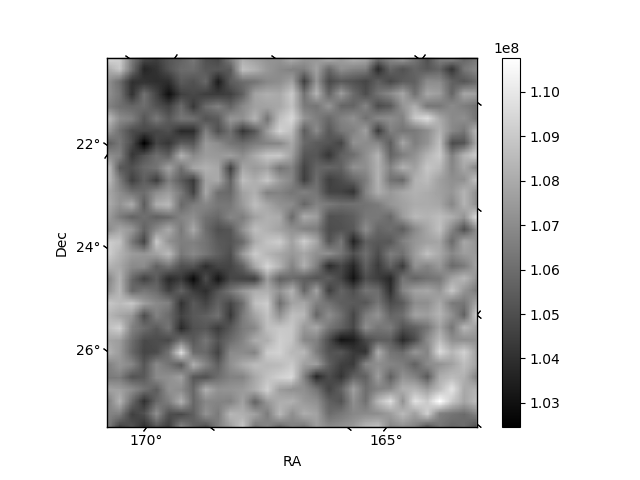
Histogram calculated using DETX and DETY for each event in the final _common_clean file
| Quadrant A | 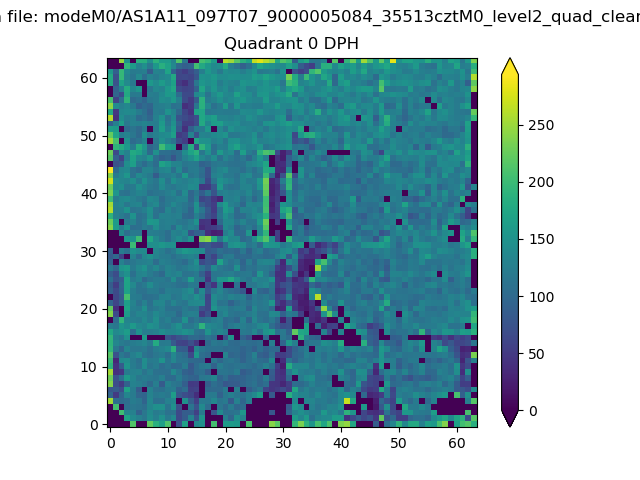 |
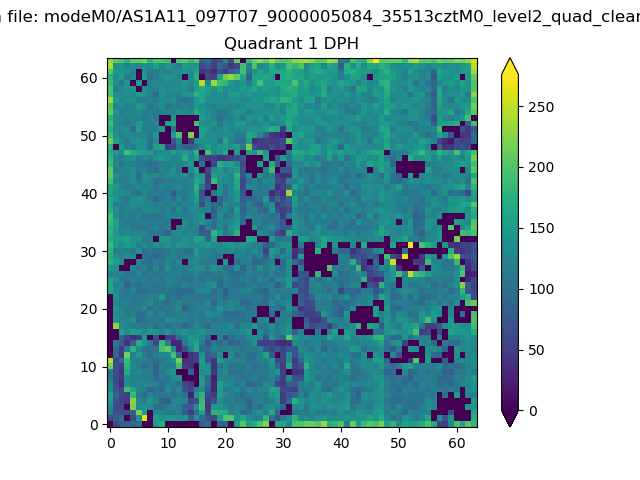 |
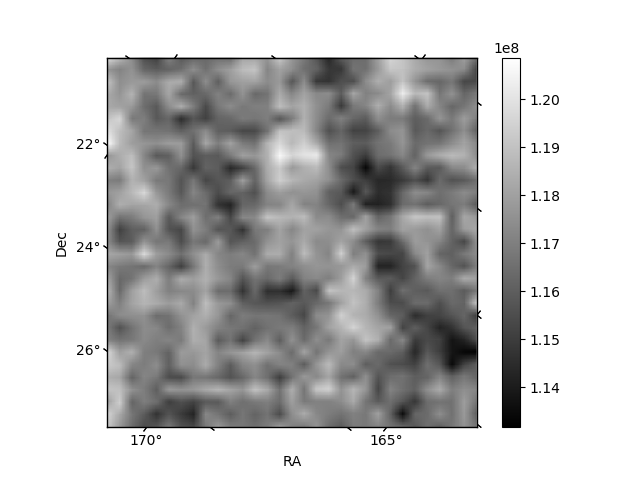
Quadrant B |
|---|---|---|---|
| Quadrant D | 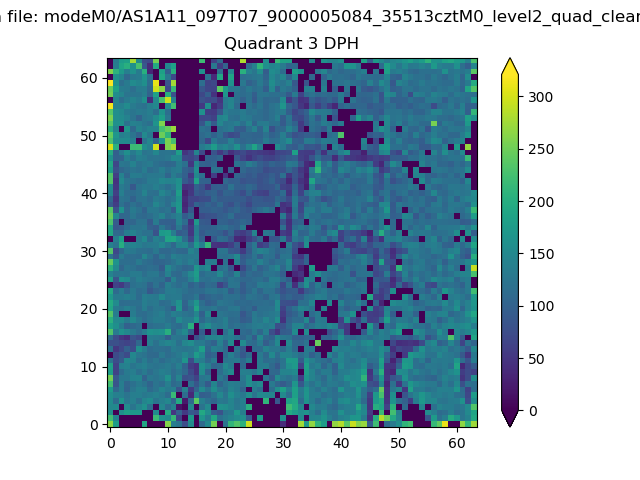 |
 |
Quadrant C |
| Plot type | Count rate plots | Images |
|---|---|---|
| Comparison with Poisson distribution Blue bars denote a histogram of data divided into 1 sec bins. Red curve is a Poisson curve with rate = median count rate of data. |
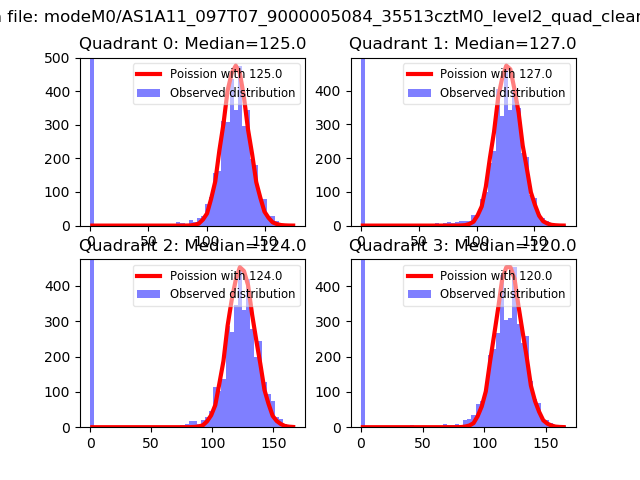 |
 |
| Quadrant-wise count rates Data is divided into 100 sec bins |
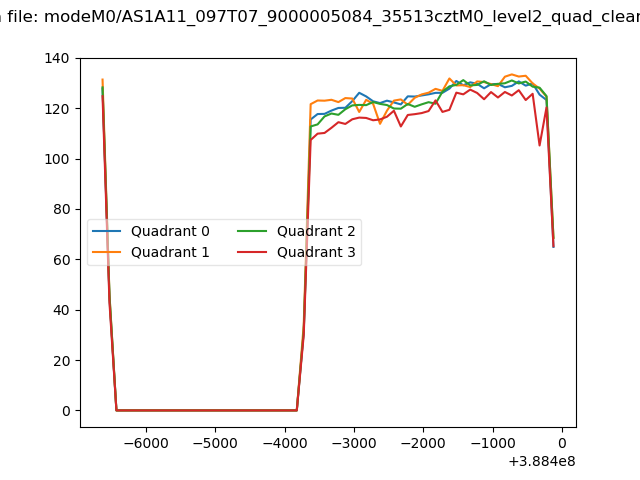 |
|
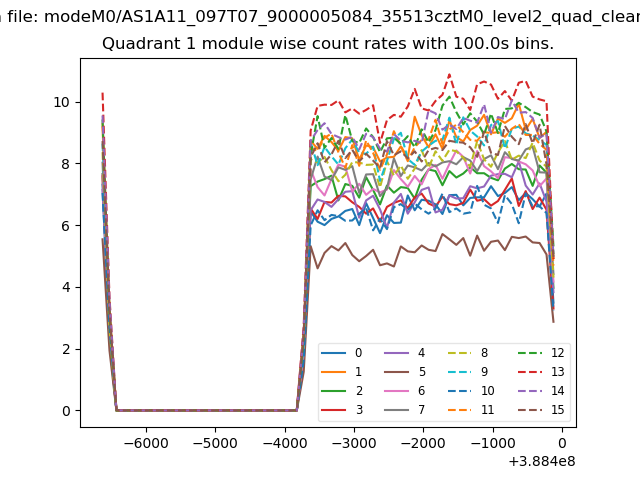
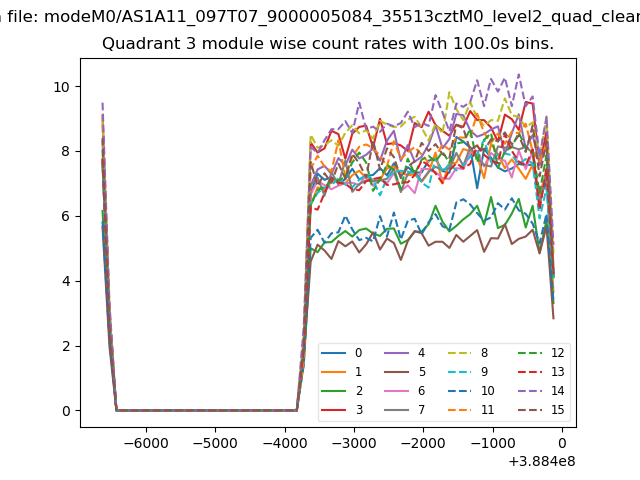
| Module-wise count rates for Quadrant A Data is divided into 100 sec bins |
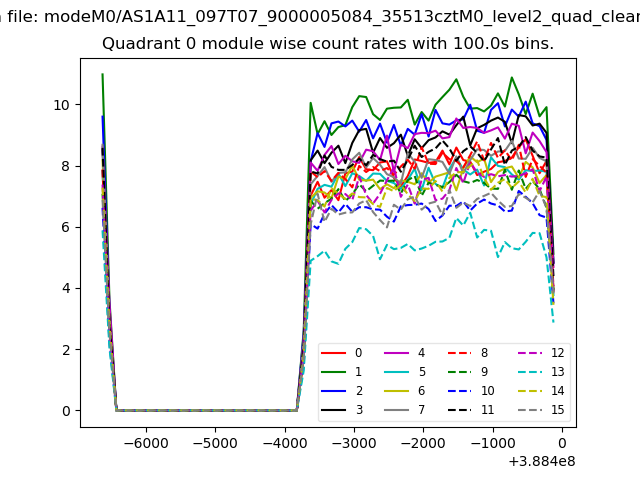 |
 |
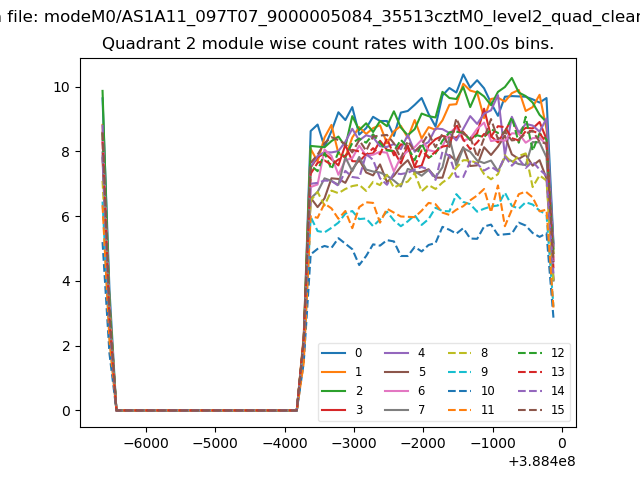
| Module-wise count rates for Quadrant B Data is divided into 100 sec bins |
 |
 |
| Module-wise count rates for Quadrant C Data is divided into 100 sec bins |
 |
 |
| Module-wise count rates for Quadrant D Data is divided into 100 sec bins |
 |
 |
| Parameter | Plot |
|---|---|
| CZT HV Monitor | 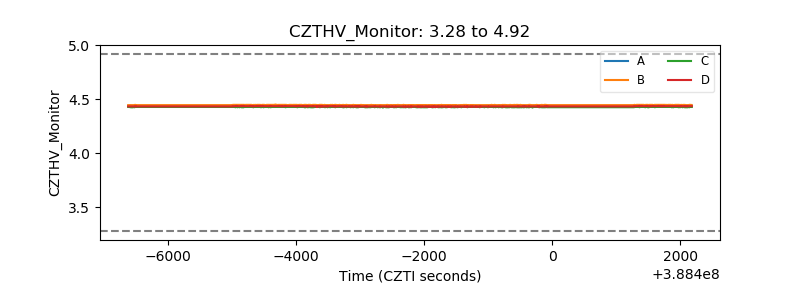 |
| D_VDD | 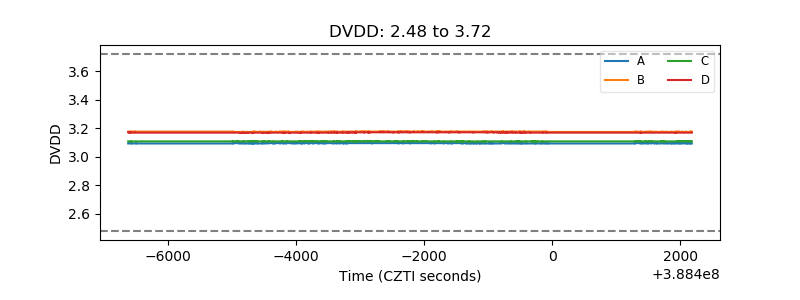 |
| Temperature 1 | 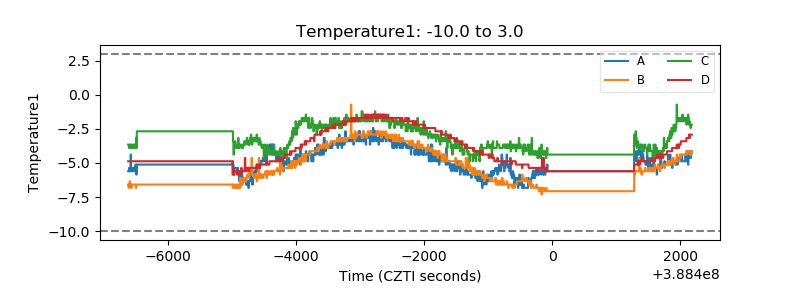 |
| Veto HV Monitor | 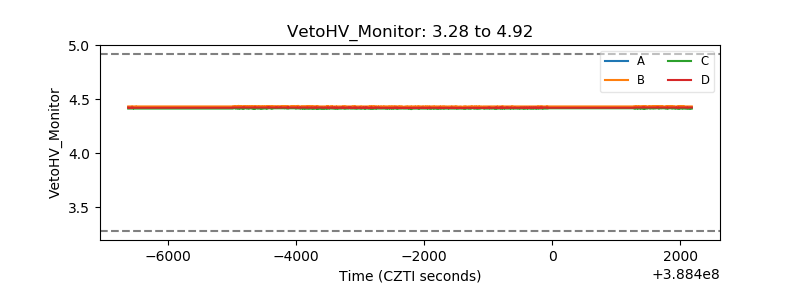 |
| Veto LLD | 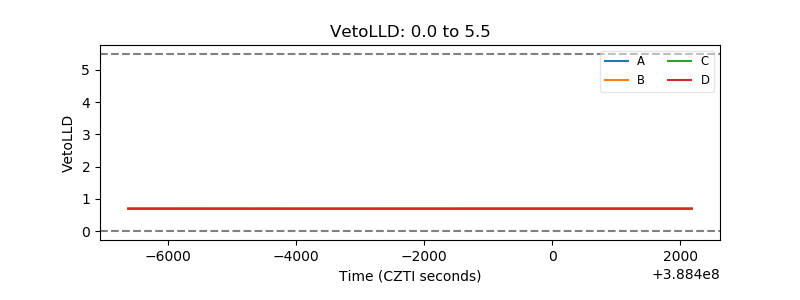 |
| Alpha Counter | 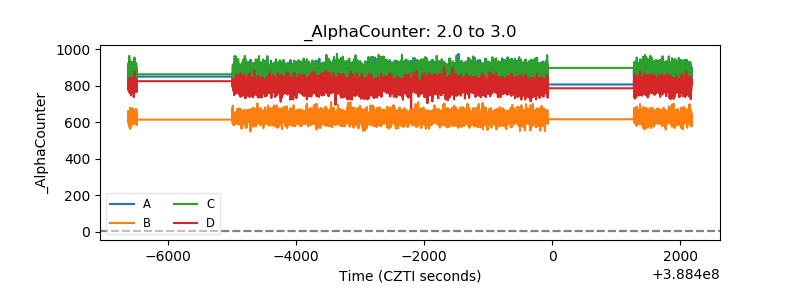 |
| _CPM_Rate | 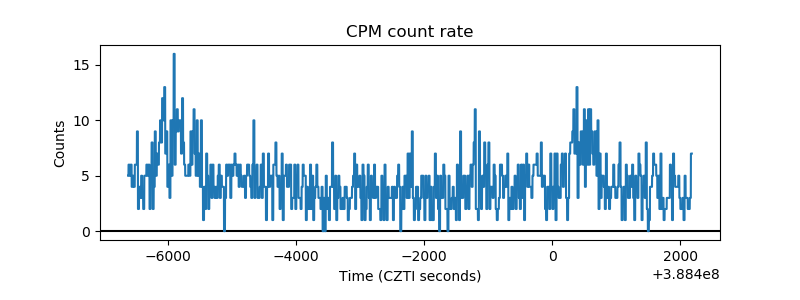 |
| CZT Counter | 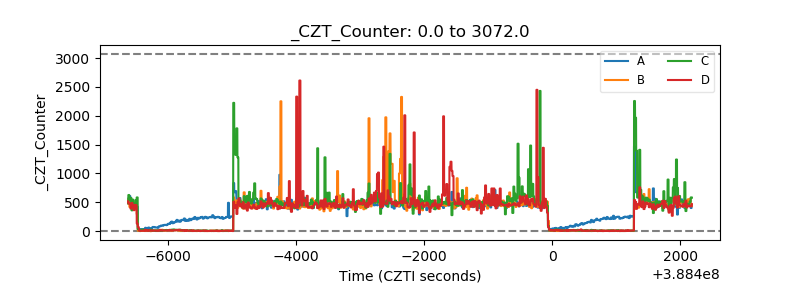 |
| +2.5 Volts monitor | 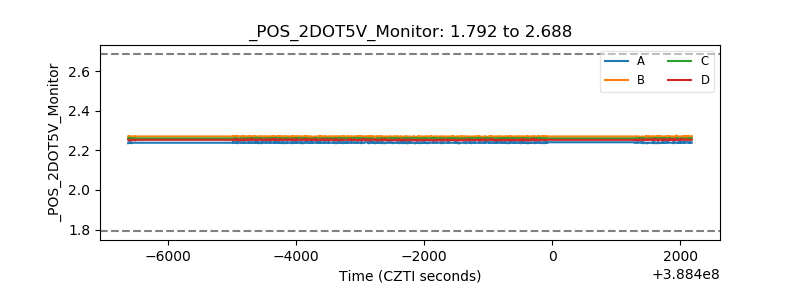 |
| +5 Volts monitor | 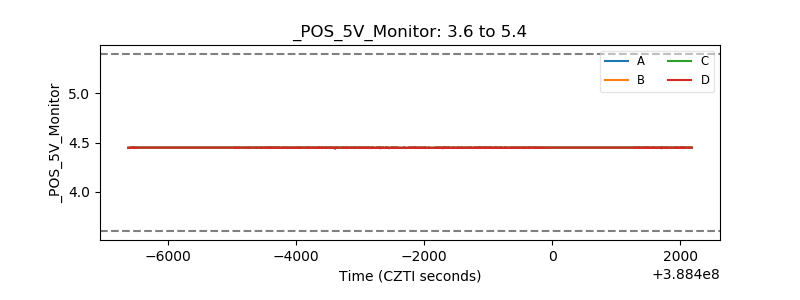 |
| _ROLL_ROT | 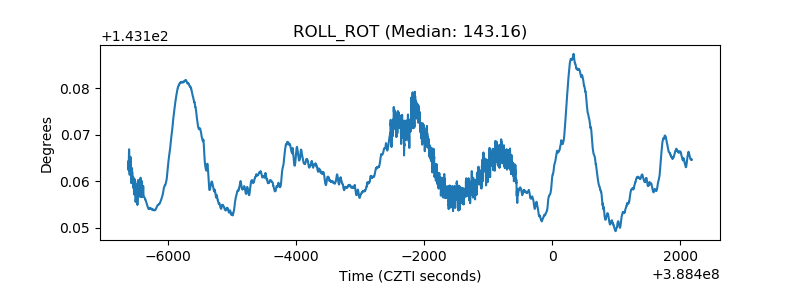 |
| _Roll_DEC | 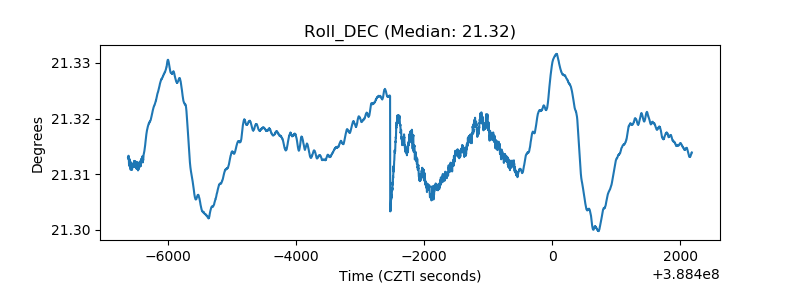 |
| _Roll_RA | 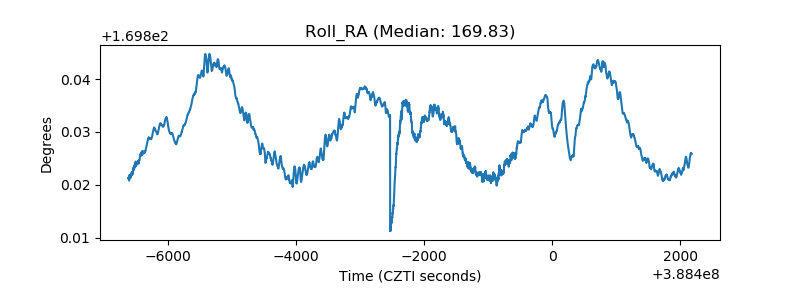 |
| Veto Counter | 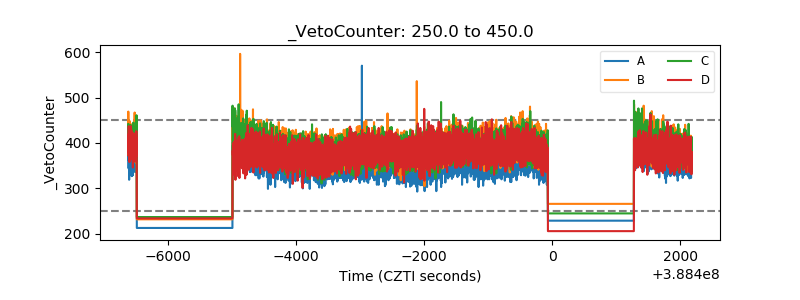 |