| Param | Original file | Final file |
|---|---|---|
| Filename | modeM0/AS1A11_097T07_9000005084_35512cztM0_level2.evt | modeM0/AS1A11_097T07_9000005084_35512cztM0_level2_quad_clean.evt |
| Size (bytes) | 479,056,320 | 81,374,400 |
| Size | 456.9 MB | 77.6 MB |
| Events in quadrant A | 3,165,665 | 510,172 |
| Events in quadrant B | 3,454,884 | 514,026 |
| Events in quadrant C | 3,958,853 | 502,520 |
| Events in quadrant D | 3,481,079 | 477,706 |
| Mode SS | |||
|---|---|---|---|
| Quadrant | BADHDUFLAG | Total packets | Discarded packets |
| A | 0 | 134 | 0 |
| B | 0 | 134 | 0 |
| C | 0 | 134 | 0 |
| D | 0 | 134 | 0 |
| Mode M0 | |||
|---|---|---|---|
| Quadrant | BADHDUFLAG | Total packets | Discarded packets |
| A | 0 | 13465 | 3 |
| B | 0 | 14397 | 2 |
| C | 0 | 15660 | 2 |
| D | 0 | 14548 | 2 |
| Mode M9 | |||
|---|---|---|---|
| Quadrant | BADHDUFLAG | Total packets | Discarded packets |
| A | 0 | 34 | 0 |
| B | 0 | 34 | 0 |
| C | 0 | 34 | 0 |
| D | 0 | 34 | 0 |
| Quadrant | Total seconds | Saturated seconds | Saturation percentage |
|---|---|---|---|
| A | 6599 | 7 | 0.106077% |
| B | 6599 | 57 | 0.863767% |
| C | 6599 | 159 | 2.409456% |
| D | 6599 | 98 | 1.485073% |
Noise dominated data is calculated using 1-second bins in cleaned event files. If a bin has >2000 counts, and if more than 50% of those come from <1% of pixels, then it is considered to be noise-dominated and hence unusable.
| Quadrant | # 1 sec bins | Bins with >0 counts | Bins with >2000 counts | High rate bins dominated by noise | Noise dominated (total time) | Noise dominated (detector-on time) | Marked lightcurve |
|---|---|---|---|---|---|---|---|
| A | 9916 | 6601 | 0 | 0 | 0.00% | 0.00% | 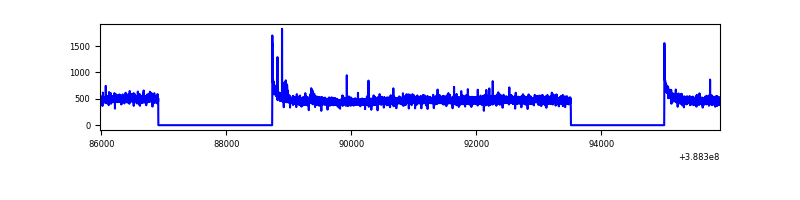 |
| B | 9916 | 6601 | 24 | 24 | 0.24% | 0.36% | 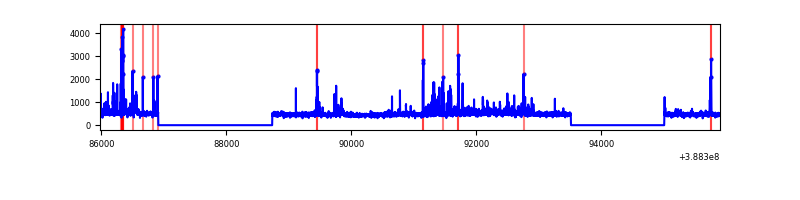 |
| C | 9916 | 6601 | 107 | 107 | 1.08% | 1.62% | 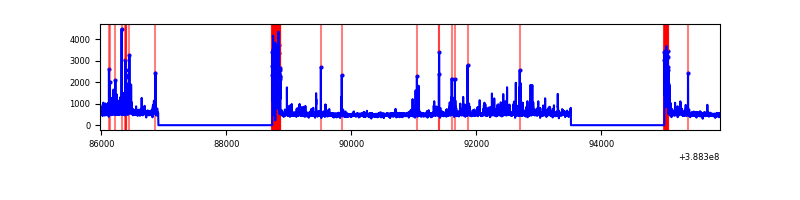 |
| D | 9916 | 6601 | 69 | 69 | 0.70% | 1.05% | 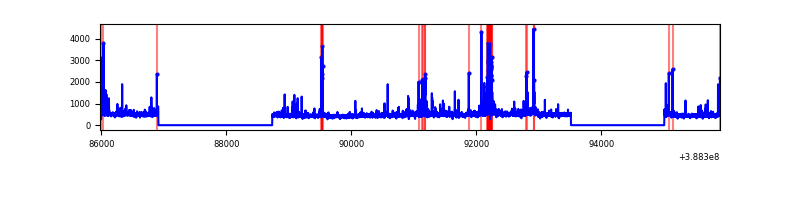 |
Top three noisy pixels from each quadrant. If the there are fewer than three noisy pixels in the level2.evt file, extra rows are filled as -1
| Pixel properties | Quadrant properties | ||||||
|---|---|---|---|---|---|---|---|
| Quadrant | DetID | PixID | Counts | Sigma | Mean | Median | Sigma |
| A | 10 | 83 | 150066 | 957.72 | 773 | 757 | 155.9 |
| A | 15 | 169 | 16742 | 102.53 | 773 | 757 | 155.9 |
| A | 13 | 254 | 9685 | 57.27 | 773 | 757 | 155.9 |
| B | 5 | 172 | 274604 | 1859.38 | 766 | 744 | 147.3 |
| B | 4 | 232 | 90302 | 608.06 | 766 | 744 | 147.3 |
| B | 5 | 236 | 48161 | 321.94 | 766 | 744 | 147.3 |
| C | 0 | 10 | 422973 | 2416.86 | 747 | 752 | 174.7 |
| C | 0 | 207 | 296976 | 1695.63 | 747 | 752 | 174.7 |
| C | 15 | 214 | 271112 | 1547.58 | 747 | 752 | 174.7 |
| D | 10 | 118 | 203851 | 1122.0 | 747 | 729 | 181.0 |
| D | 8 | 195 | 145733 | 800.97 | 747 | 729 | 181.0 |
| D | 13 | 249 | 79796 | 436.75 | 747 | 729 | 181.0 |
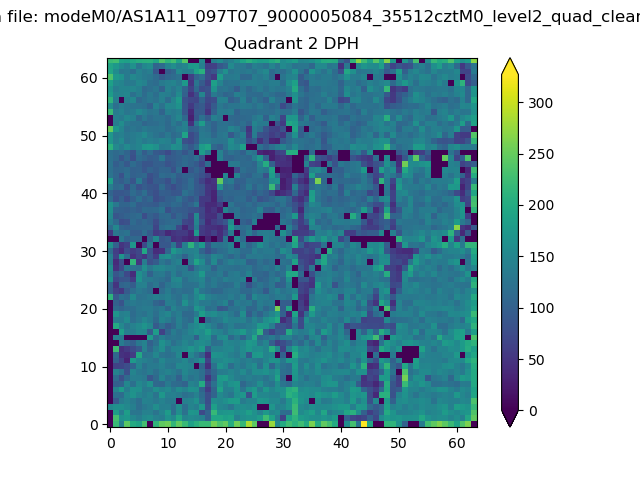
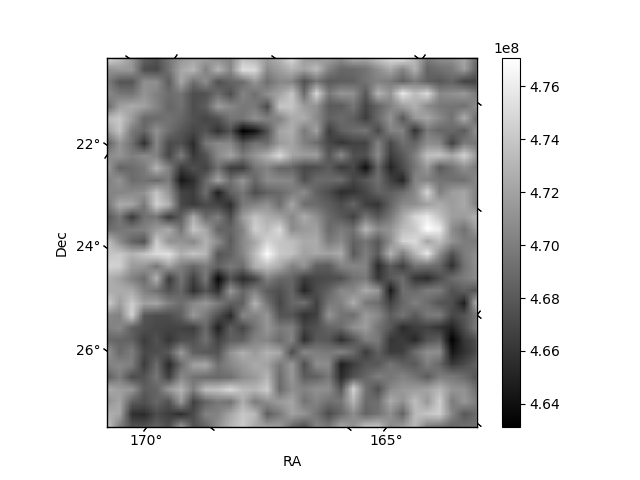
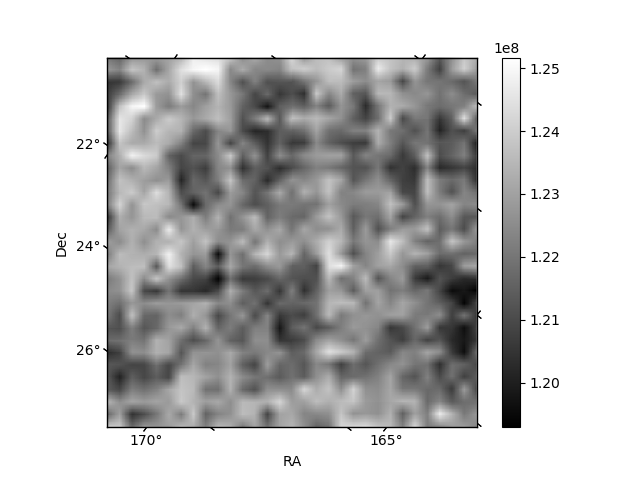
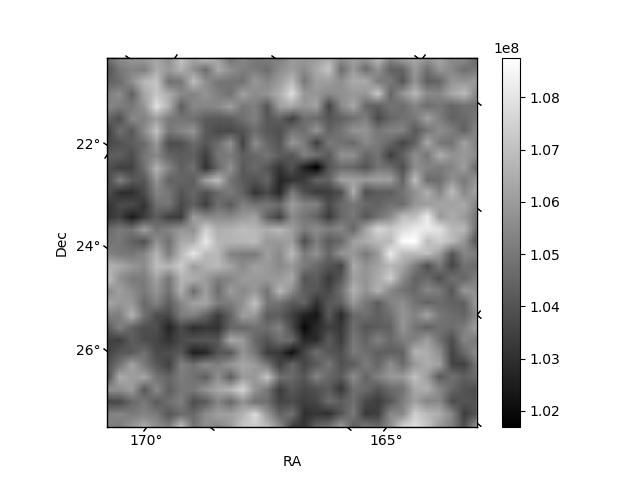
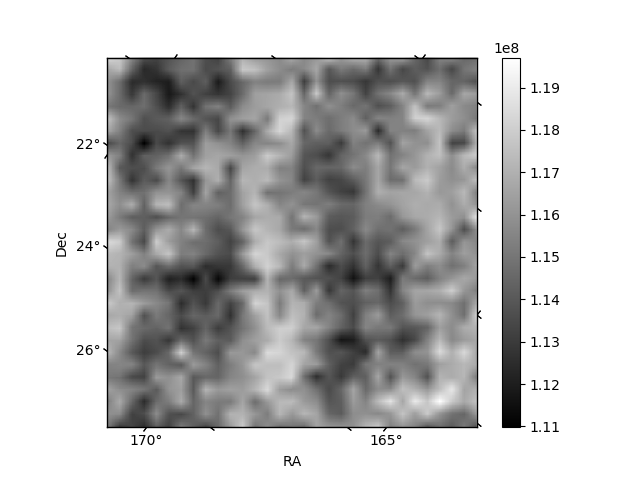
Histogram calculated using DETX and DETY for each event in the final _common_clean file
| Quadrant A | 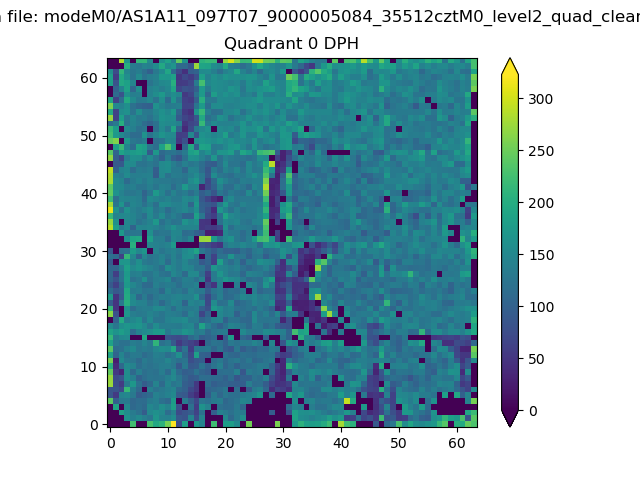 |
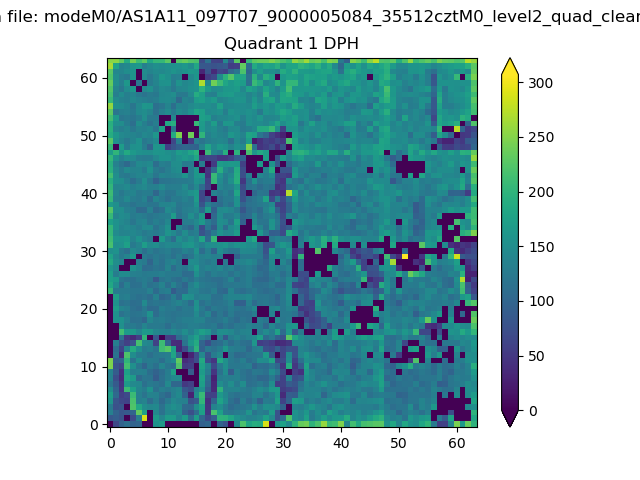 |
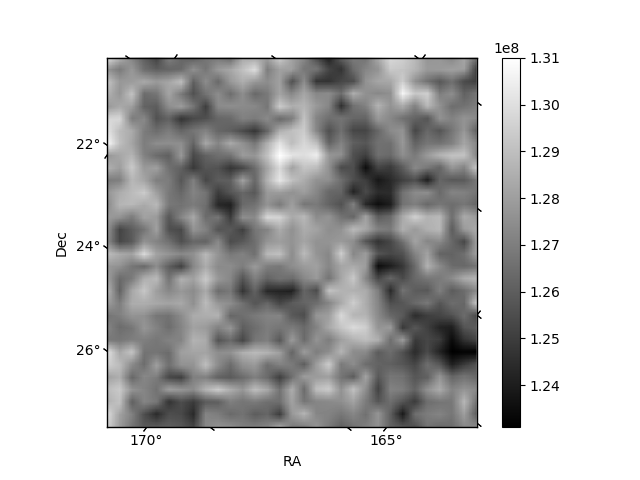
Quadrant B |
|---|---|---|---|
| Quadrant D | 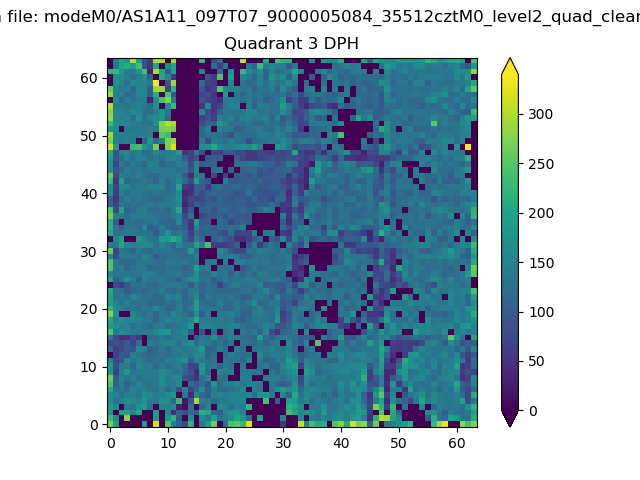 |
 |
Quadrant C |
| Plot type | Count rate plots | Images |
|---|---|---|
| Comparison with Poisson distribution Blue bars denote a histogram of data divided into 1 sec bins. Red curve is a Poisson curve with rate = median count rate of data. |
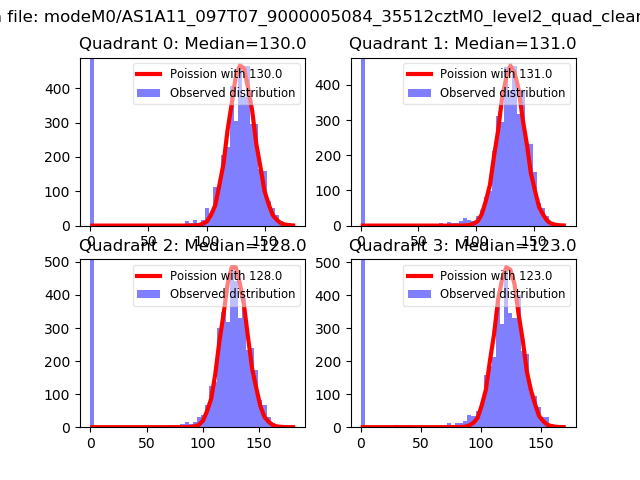 |
 |
| Quadrant-wise count rates Data is divided into 100 sec bins |
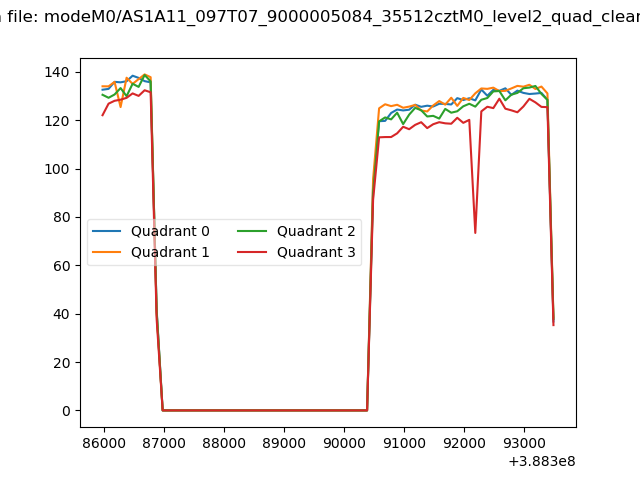 |
|
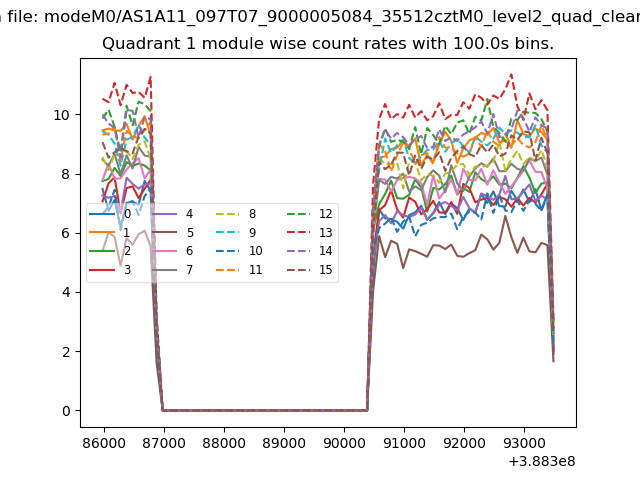
| Module-wise count rates for Quadrant A Data is divided into 100 sec bins |
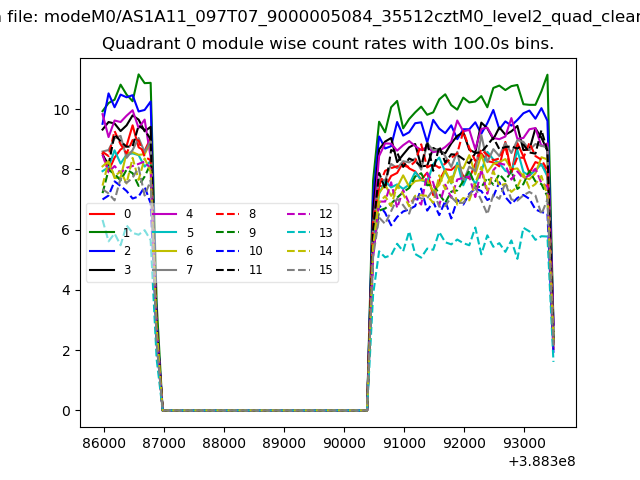 |
 |
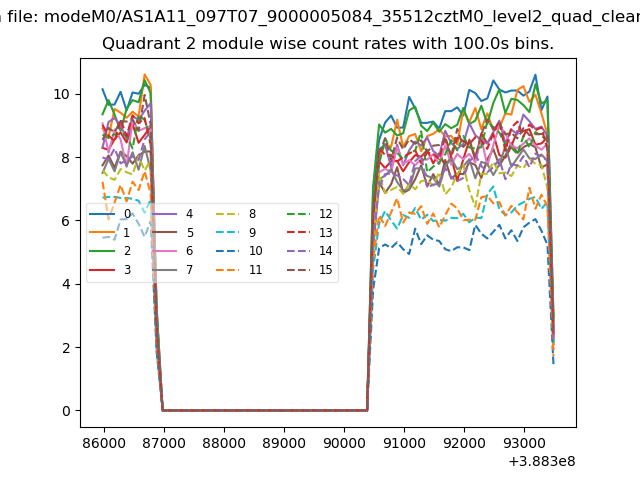
| Module-wise count rates for Quadrant B Data is divided into 100 sec bins |
 |
 |
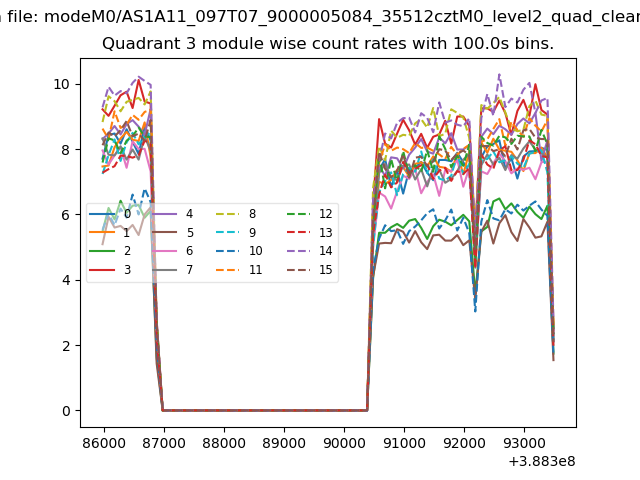
| Module-wise count rates for Quadrant C Data is divided into 100 sec bins |
 |
 |
| Module-wise count rates for Quadrant D Data is divided into 100 sec bins |
 |
 |
| Parameter | Plot |
|---|---|
| CZT HV Monitor | 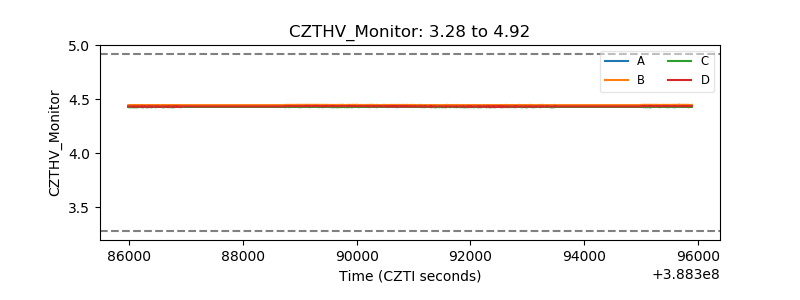 |
| D_VDD | 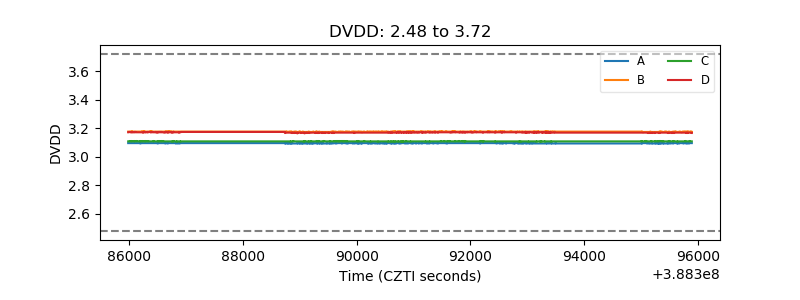 |
| Temperature 1 | 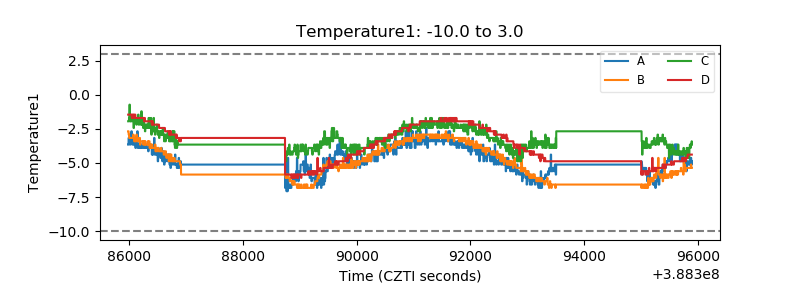 |
| Veto HV Monitor | 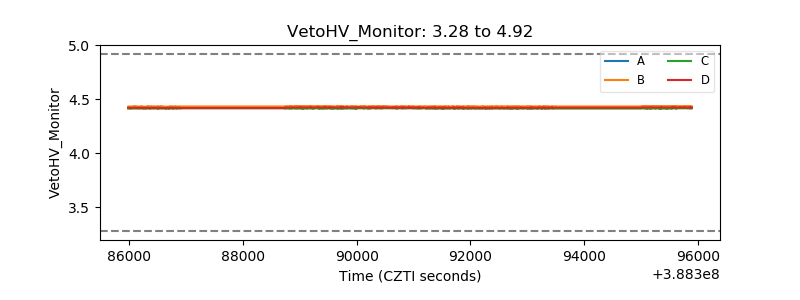 |
| Veto LLD | 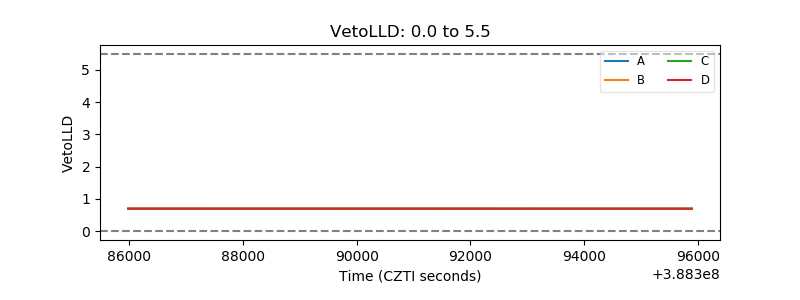 |
| Alpha Counter | 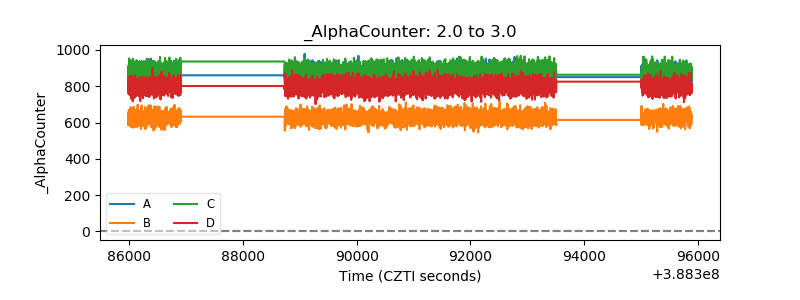 |
| _CPM_Rate | 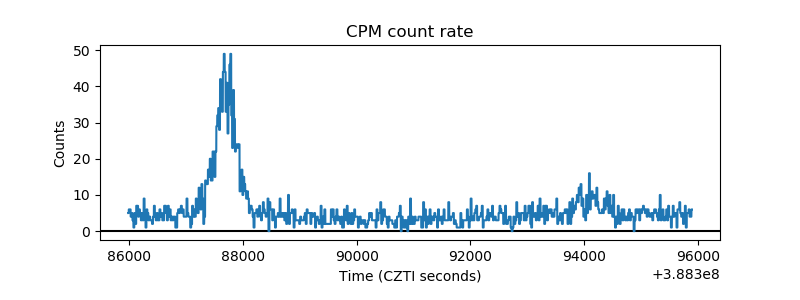 |
| CZT Counter |  |
| +2.5 Volts monitor | 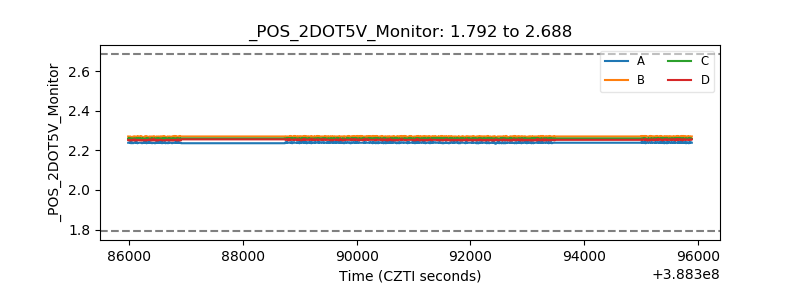 |
| +5 Volts monitor | 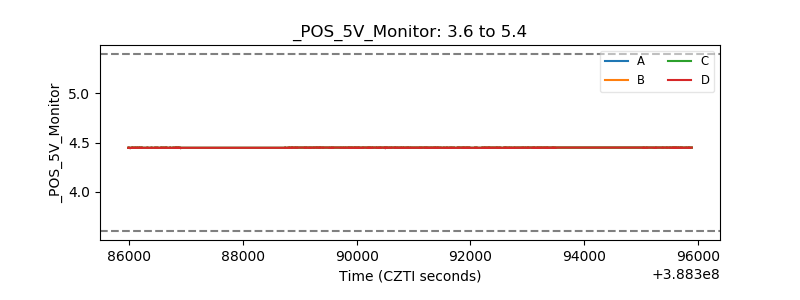 |
| _ROLL_ROT | 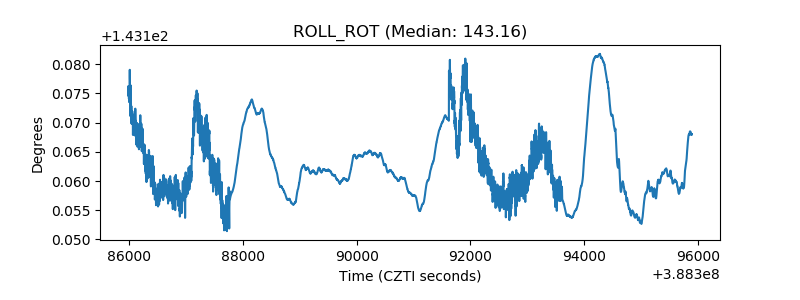 |
| _Roll_DEC | 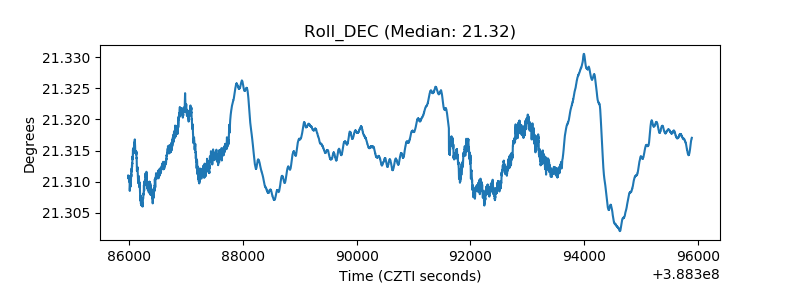 |
| _Roll_RA | 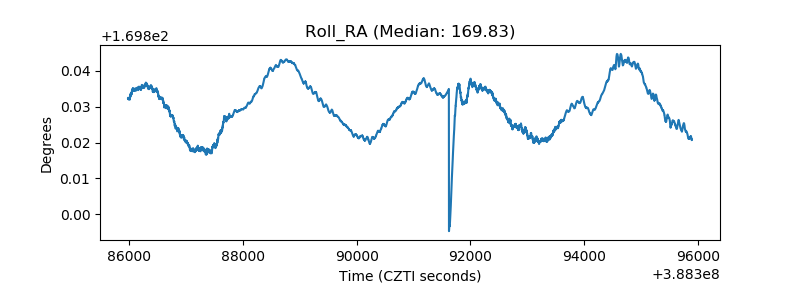 |
| Veto Counter | 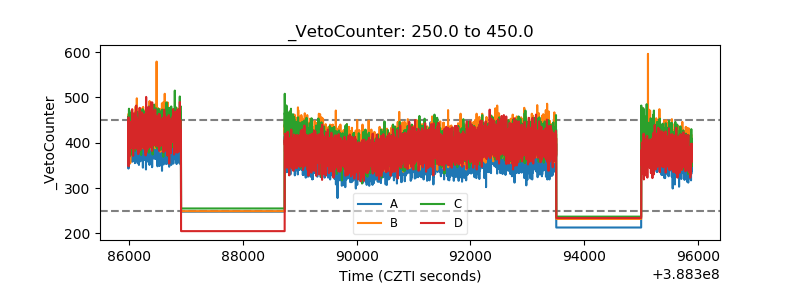 |