| Param | Original file | Final file |
|---|---|---|
| Filename | modeM0/AS1A11_097T07_9000005084_35511cztM0_level2.evt | modeM0/AS1A11_097T07_9000005084_35511cztM0_level2_quad_clean.evt |
| Size (bytes) | 425,825,280 | 53,755,200 |
| Size | 406.1 MB | 51.3 MB |
| Events in quadrant A | 2,618,694 | 320,886 |
| Events in quadrant B | 3,314,256 | 317,868 |
| Events in quadrant C | 3,880,418 | 314,986 |
| Events in quadrant D | 2,720,885 | 300,610 |
| Mode SS | |||
|---|---|---|---|
| Quadrant | BADHDUFLAG | Total packets | Discarded packets |
| A | 0 | 108 | 0 |
| B | 0 | 108 | 0 |
| C | 0 | 108 | 0 |
| D | 0 | 108 | 0 |
| Mode M0 | |||
|---|---|---|---|
| Quadrant | BADHDUFLAG | Total packets | Discarded packets |
| A | 0 | 11047 | 3 |
| B | 0 | 13276 | 2 |
| C | 0 | 14805 | 2 |
| D | 0 | 11621 | 2 |
| Mode M9 | |||
|---|---|---|---|
| Quadrant | BADHDUFLAG | Total packets | Discarded packets |
| A | 0 | 40 | 0 |
| B | 0 | 40 | 0 |
| C | 0 | 40 | 0 |
| D | 0 | 40 | 0 |
| Quadrant | Total seconds | Saturated seconds | Saturation percentage |
|---|---|---|---|
| A | 5335 | 10 | 0.187441% |
| B | 5335 | 148 | 2.774133% |
| C | 5335 | 298 | 5.585754% |
| D | 5335 | 47 | 0.880975% |
Noise dominated data is calculated using 1-second bins in cleaned event files. If a bin has >2000 counts, and if more than 50% of those come from <1% of pixels, then it is considered to be noise-dominated and hence unusable.
| Quadrant | # 1 sec bins | Bins with >0 counts | Bins with >2000 counts | High rate bins dominated by noise | Noise dominated (total time) | Noise dominated (detector-on time) | Marked lightcurve |
|---|---|---|---|---|---|---|---|
| A | 9221 | 5337 | 4 | 4 | 0.04% | 0.07% | 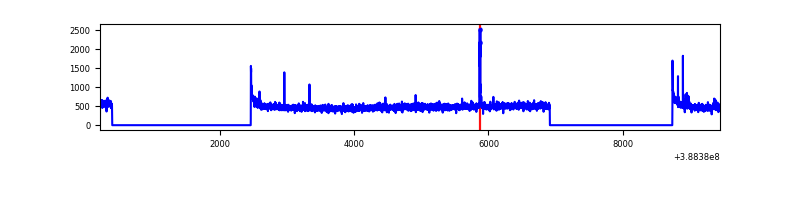 |
| B | 9221 | 5337 | 77 | 77 | 0.84% | 1.44% | 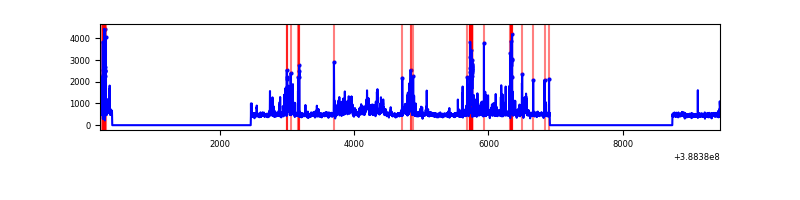 |
| C | 9221 | 5337 | 210 | 210 | 2.28% | 3.93% | 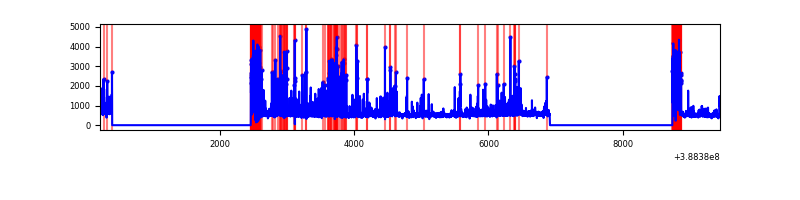 |
| D | 9221 | 5337 | 34 | 34 | 0.37% | 0.64% | 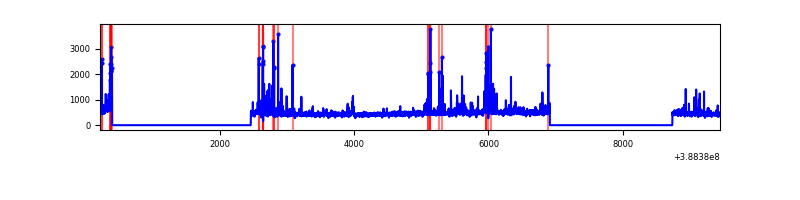 |
Top three noisy pixels from each quadrant. If the there are fewer than three noisy pixels in the level2.evt file, extra rows are filled as -1
| Pixel properties | Quadrant properties | ||||||
|---|---|---|---|---|---|---|---|
| Quadrant | DetID | PixID | Counts | Sigma | Mean | Median | Sigma |
| A | 10 | 83 | 133168 | 1040.49 | 628 | 616 | 127.4 |
| A | 9 | 143 | 25147 | 192.56 | 628 | 616 | 127.4 |
| A | 15 | 169 | 19249 | 146.26 | 628 | 616 | 127.4 |
| B | 5 | 236 | 471942 | 3921.83 | 617 | 602 | 120.2 |
| B | 5 | 172 | 281610 | 2338.15 | 617 | 602 | 120.2 |
| B | 5 | 200 | 85542 | 706.75 | 617 | 602 | 120.2 |
| C | 0 | 10 | 982232 | 7058.48 | 595 | 600 | 139.1 |
| C | 0 | 207 | 291856 | 2094.29 | 595 | 600 | 139.1 |
| C | 15 | 214 | 217540 | 1559.92 | 595 | 600 | 139.1 |
| D | 13 | 249 | 70079 | 467.91 | 607 | 590 | 148.5 |
| D | 8 | 195 | 56668 | 377.6 | 607 | 590 | 148.5 |
| D | 7 | 80 | 55923 | 372.59 | 607 | 590 | 148.5 |
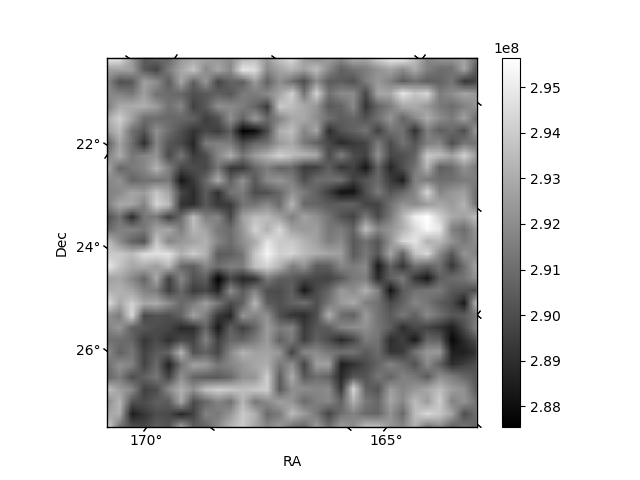
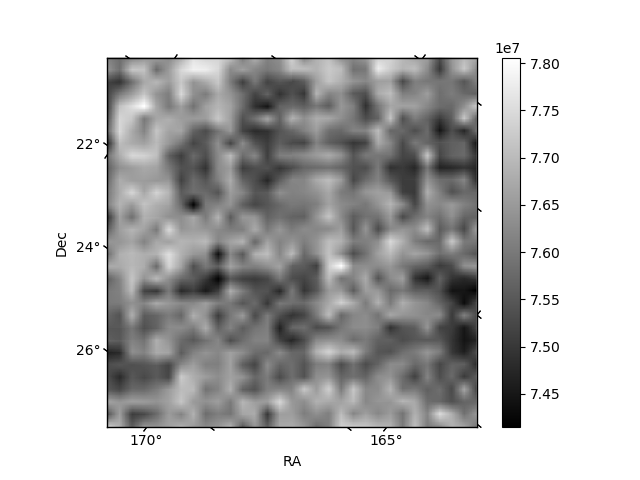
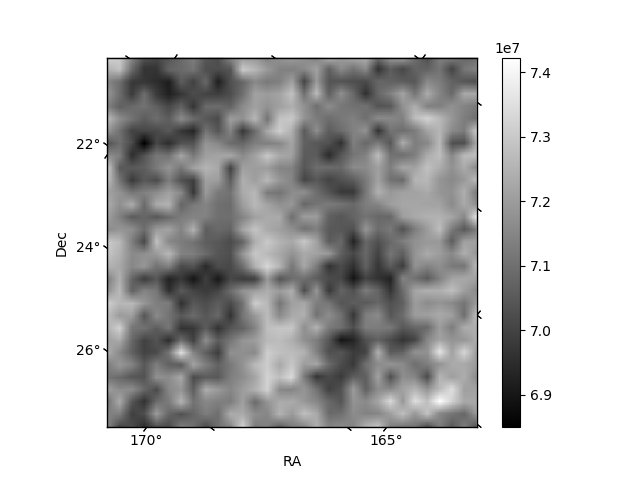
Histogram calculated using DETX and DETY for each event in the final _common_clean file
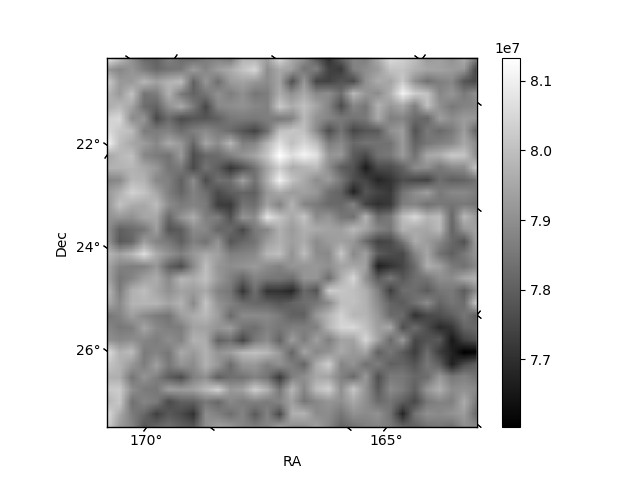
| Quadrant A | 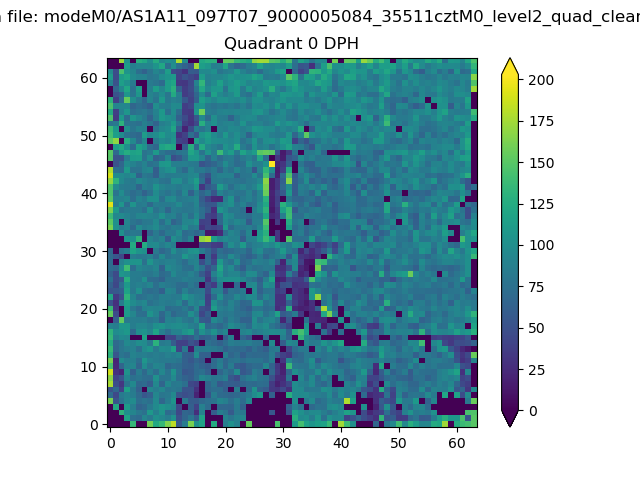 |
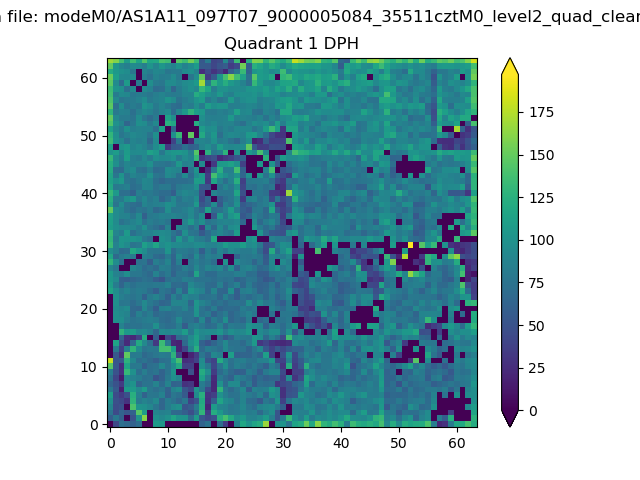 |
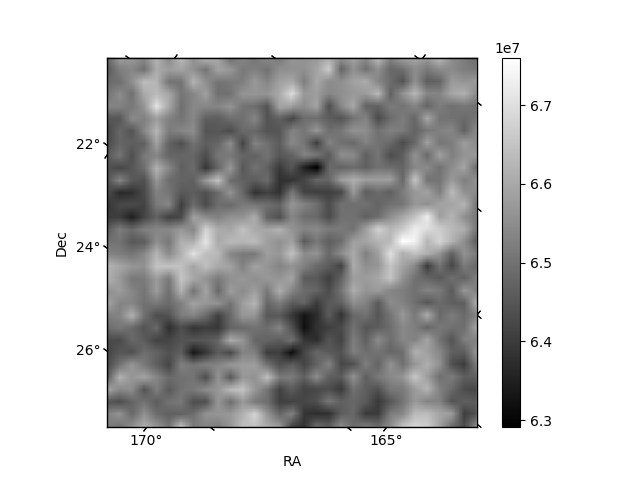
Quadrant B |
|---|---|---|---|
| Quadrant D |  |
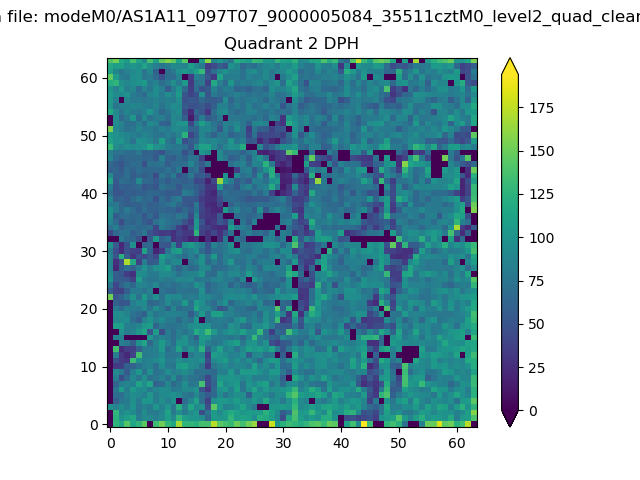 |
Quadrant C |
| Plot type | Count rate plots | Images |
|---|---|---|
| Comparison with Poisson distribution Blue bars denote a histogram of data divided into 1 sec bins. Red curve is a Poisson curve with rate = median count rate of data. |
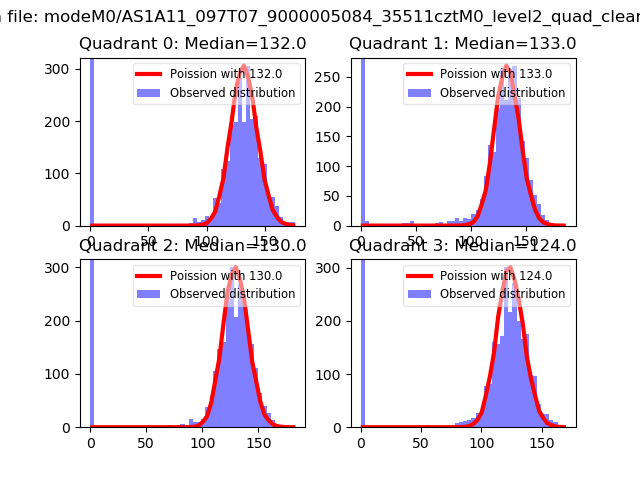 |
 |
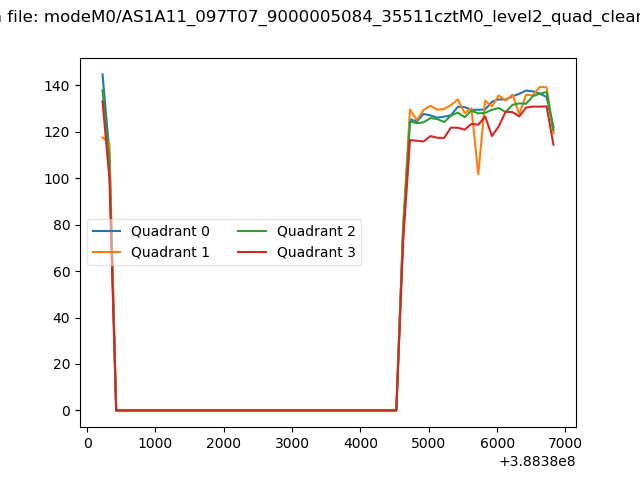
| Quadrant-wise count rates Data is divided into 100 sec bins |
 |
|
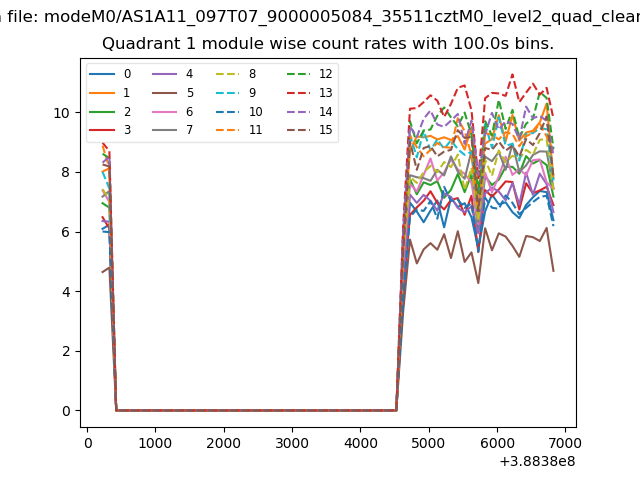
| Module-wise count rates for Quadrant A Data is divided into 100 sec bins |
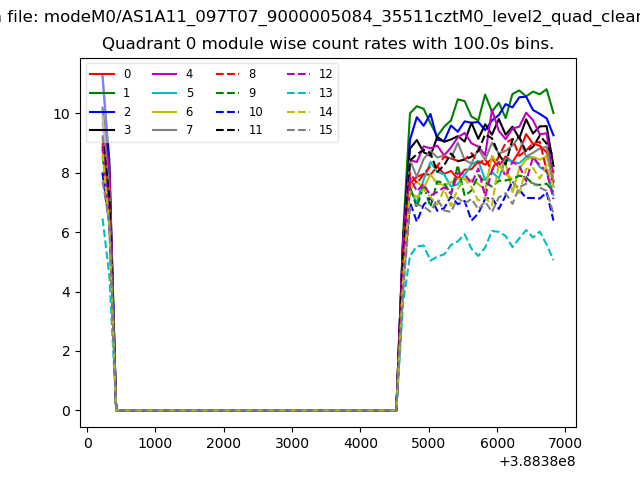 |
 |
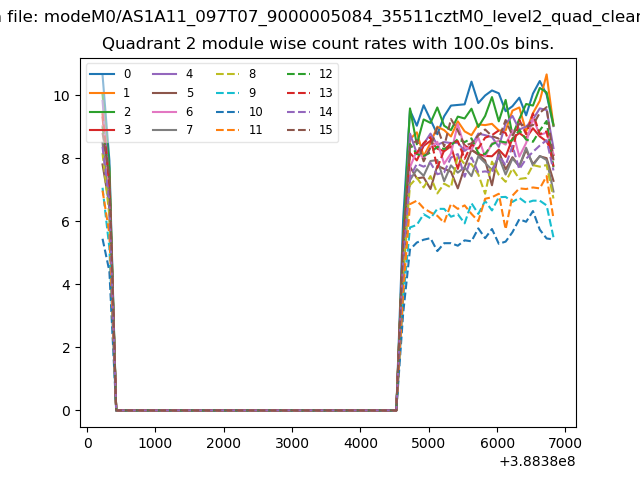
| Module-wise count rates for Quadrant B Data is divided into 100 sec bins |
 |
 |
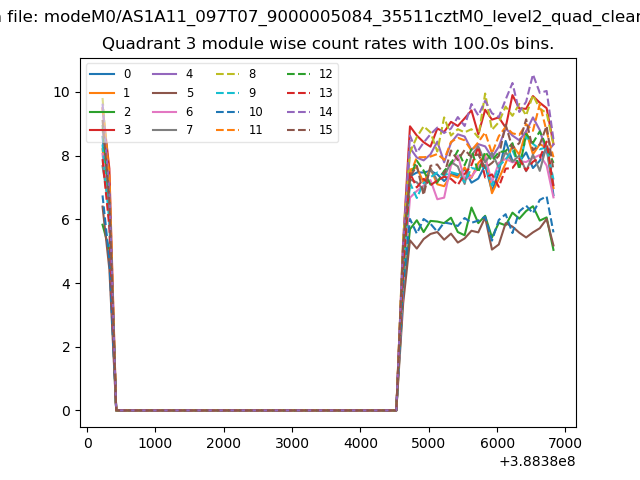
| Module-wise count rates for Quadrant C Data is divided into 100 sec bins |
 |
 |
| Module-wise count rates for Quadrant D Data is divided into 100 sec bins |
 |
 |
| Parameter | Plot |
|---|---|
| CZT HV Monitor | 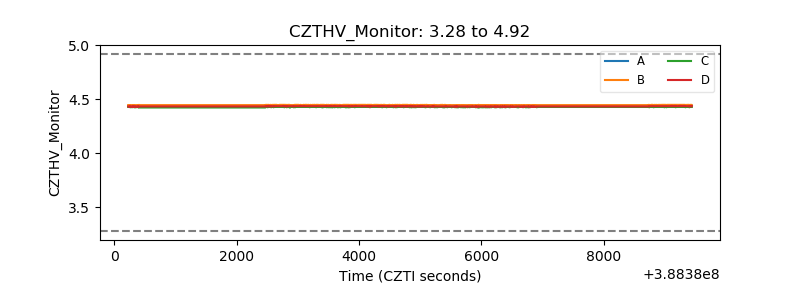 |
| D_VDD | 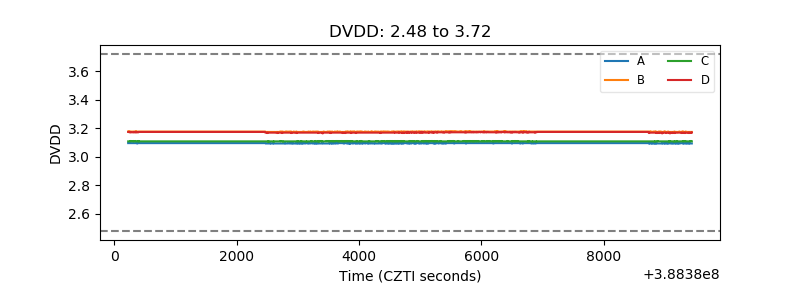 |
| Temperature 1 | 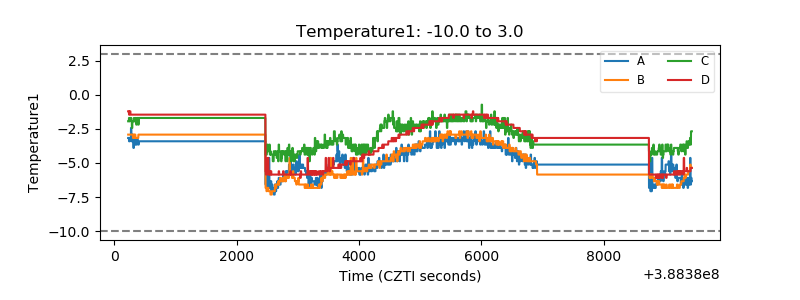 |
| Veto HV Monitor | 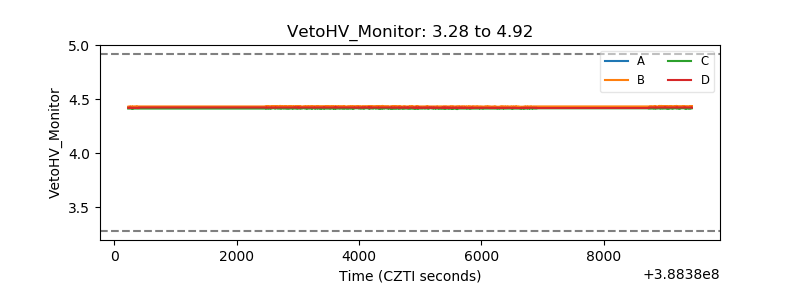 |
| Veto LLD | 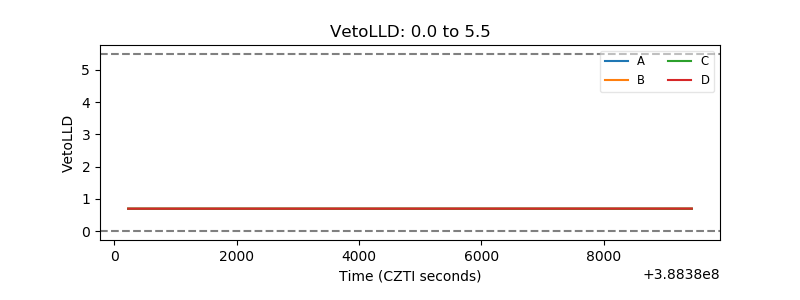 |
| Alpha Counter |  |
| _CPM_Rate | 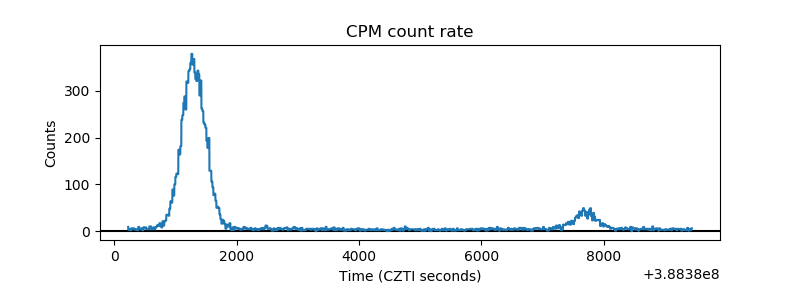 |
| CZT Counter | 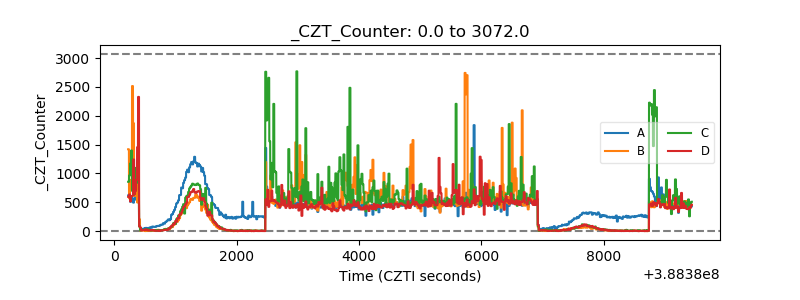 |
| +2.5 Volts monitor | 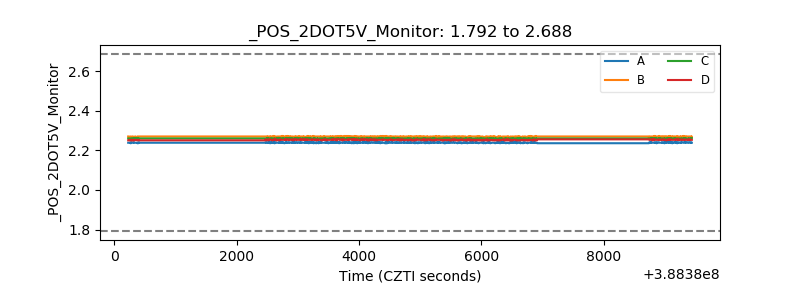 |
| +5 Volts monitor | 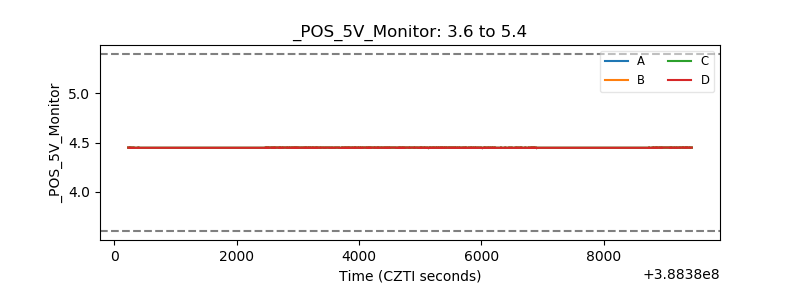 |
| _ROLL_ROT | 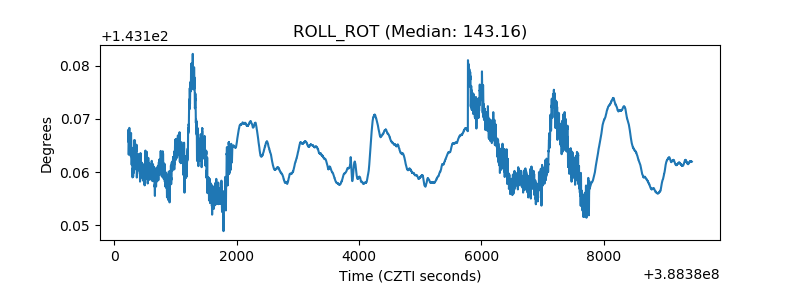 |
| _Roll_DEC | 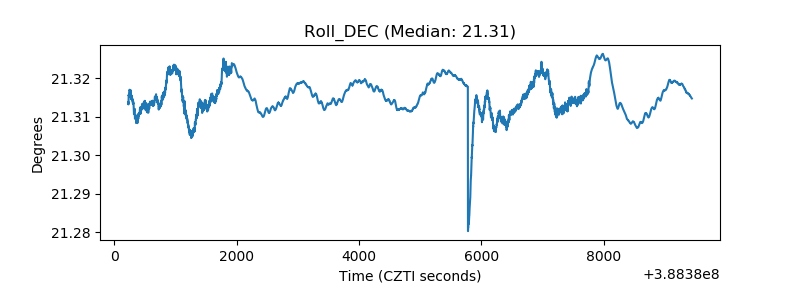 |
| _Roll_RA | 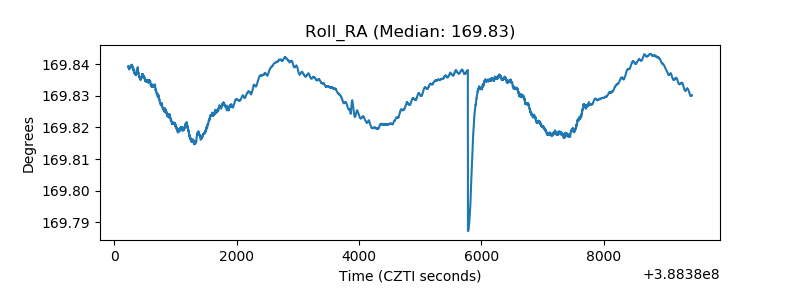 |
| Veto Counter | 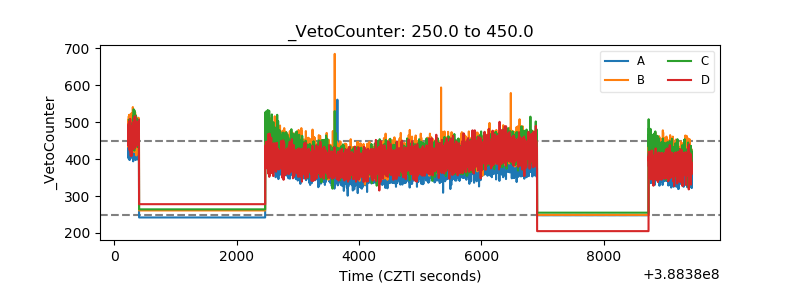 |