| Param | Original file | Final file |
|---|---|---|
| Filename | modeM0/AS1A11_097T07_9000005084_35510cztM0_level2.evt | modeM0/AS1A11_097T07_9000005084_35510cztM0_level2_quad_clean.evt |
| Size (bytes) | 435,159,360 | 46,261,440 |
| Size | 415.0 MB | 44.1 MB |
| Events in quadrant A | 2,445,116 | 272,392 |
| Events in quadrant B | 2,676,996 | 275,922 |
| Events in quadrant C | 4,967,049 | 251,573 |
| Events in quadrant D | 2,753,494 | 252,983 |
| Mode SS | |||
|---|---|---|---|
| Quadrant | BADHDUFLAG | Total packets | Discarded packets |
| A | 0 | 100 | 0 |
| B | 0 | 100 | 0 |
| C | 0 | 100 | 0 |
| D | 0 | 100 | 0 |
| Mode M0 | |||
|---|---|---|---|
| Quadrant | BADHDUFLAG | Total packets | Discarded packets |
| A | 0 | 10238 | 3 |
| B | 0 | 11027 | 2 |
| C | 0 | 18152 | 2 |
| D | 0 | 11418 | 2 |
| Mode M9 | |||
|---|---|---|---|
| Quadrant | BADHDUFLAG | Total packets | Discarded packets |
| A | 0 | 30 | 0 |
| B | 0 | 30 | 0 |
| C | 0 | 30 | 0 |
| D | 0 | 31 | 0 |
| Quadrant | Total seconds | Saturated seconds | Saturation percentage |
|---|---|---|---|
| A | 4955 | 8 | 0.161453% |
| B | 4955 | 83 | 1.675076% |
| C | 4955 | 515 | 10.393542% |
| D | 4955 | 68 | 1.372351% |
Noise dominated data is calculated using 1-second bins in cleaned event files. If a bin has >2000 counts, and if more than 50% of those come from <1% of pixels, then it is considered to be noise-dominated and hence unusable.
| Quadrant | # 1 sec bins | Bins with >0 counts | Bins with >2000 counts | High rate bins dominated by noise | Noise dominated (total time) | Noise dominated (detector-on time) | Marked lightcurve |
|---|---|---|---|---|---|---|---|
| A | 7018 | 4956 | 0 | 0 | 0.00% | 0.00% | 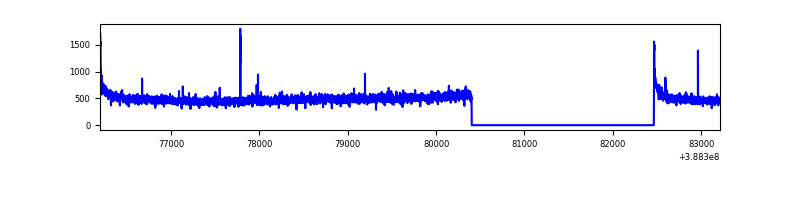 |
| B | 7018 | 4956 | 33 | 33 | 0.47% | 0.67% | 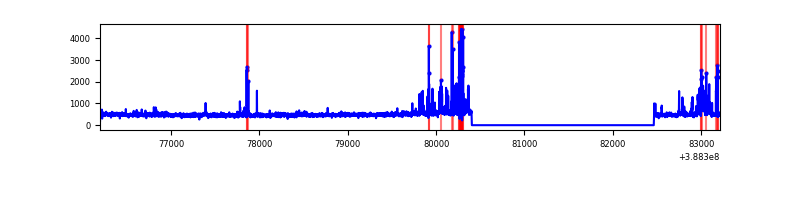 |
| C | 7018 | 4956 | 390 | 390 | 5.56% | 7.87% | 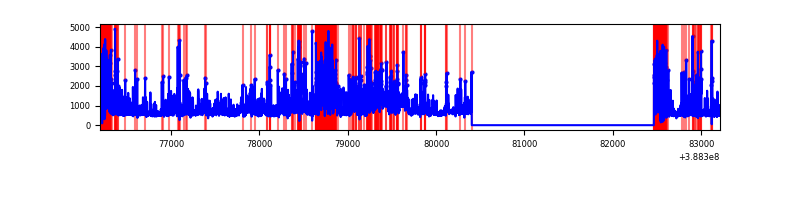 |
| D | 7018 | 4956 | 52 | 52 | 0.74% | 1.05% | 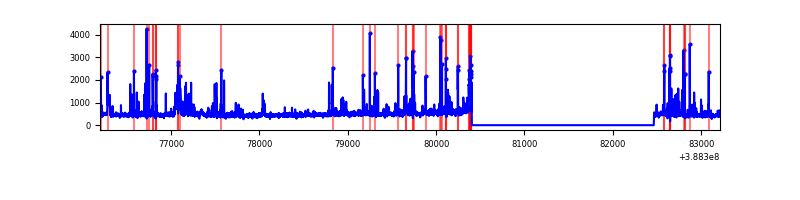 |
Top three noisy pixels from each quadrant. If the there are fewer than three noisy pixels in the level2.evt file, extra rows are filled as -1
| Pixel properties | Quadrant properties | ||||||
|---|---|---|---|---|---|---|---|
| Quadrant | DetID | PixID | Counts | Sigma | Mean | Median | Sigma |
| A | 10 | 83 | 128874 | 1075.75 | 592 | 581 | 119.3 |
| A | 15 | 169 | 19383 | 157.66 | 592 | 581 | 119.3 |
| A | 13 | 254 | 7652 | 59.29 | 592 | 581 | 119.3 |
| B | 5 | 172 | 168378 | 1492.3 | 587 | 572 | 112.4 |
| B | 5 | 236 | 154778 | 1371.35 | 587 | 572 | 112.4 |
| B | 0 | 219 | 19270 | 166.28 | 587 | 572 | 112.4 |
| C | 0 | 10 | 1066954 | 8348.05 | 550 | 555 | 127.7 |
| C | 0 | 239 | 1048269 | 8201.78 | 550 | 555 | 127.7 |
| C | 0 | 207 | 392402 | 3067.48 | 550 | 555 | 127.7 |
| D | 7 | 80 | 232590 | 1675.38 | 566 | 552 | 138.5 |
| D | 13 | 249 | 114450 | 822.38 | 566 | 552 | 138.5 |
| D | 8 | 195 | 57550 | 411.54 | 566 | 552 | 138.5 |
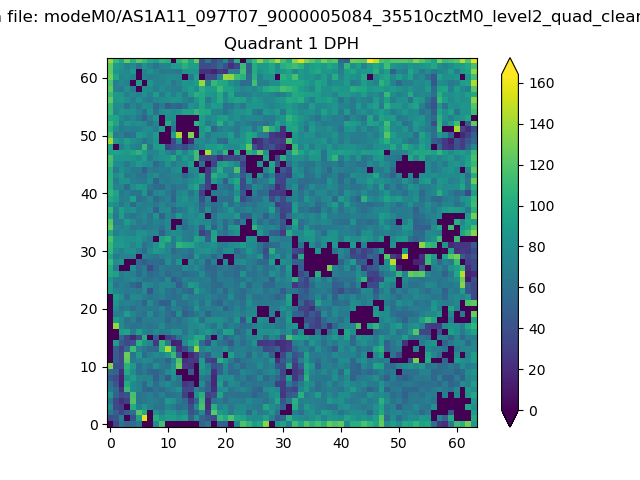
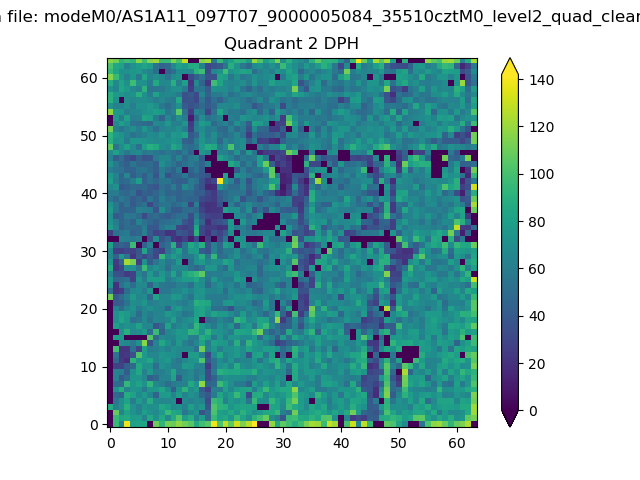
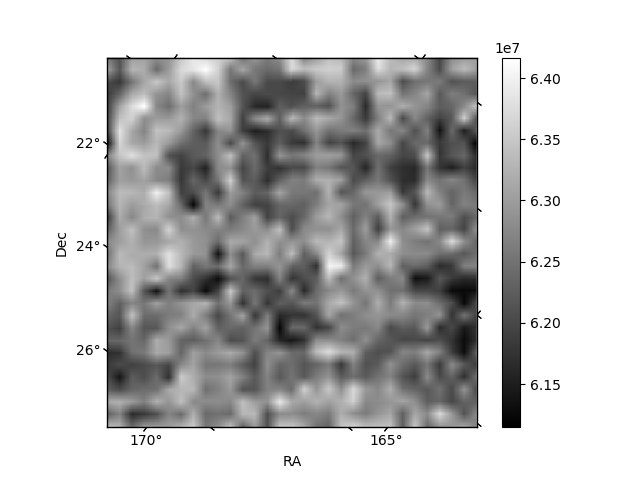
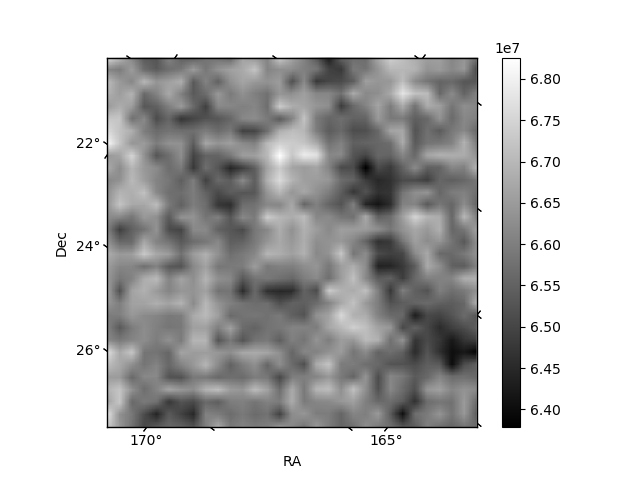
Histogram calculated using DETX and DETY for each event in the final _common_clean file
| Quadrant A |  |
 |
Quadrant B |
|---|---|---|---|
| Quadrant D |  |
 |
Quadrant C |
| Plot type | Count rate plots | Images |
|---|---|---|
| Comparison with Poisson distribution Blue bars denote a histogram of data divided into 1 sec bins. Red curve is a Poisson curve with rate = median count rate of data. |
 |
 |
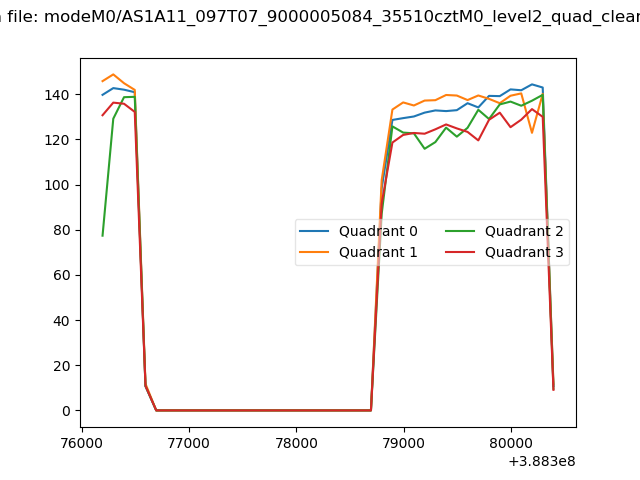
| Quadrant-wise count rates Data is divided into 100 sec bins |
 |
|
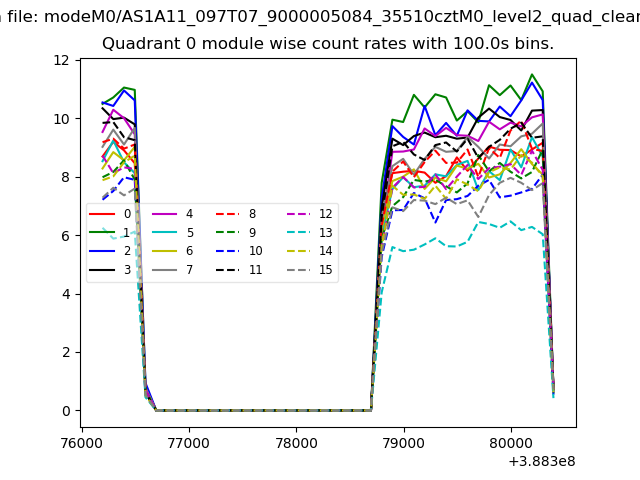
| Module-wise count rates for Quadrant A Data is divided into 100 sec bins |
 |
 |
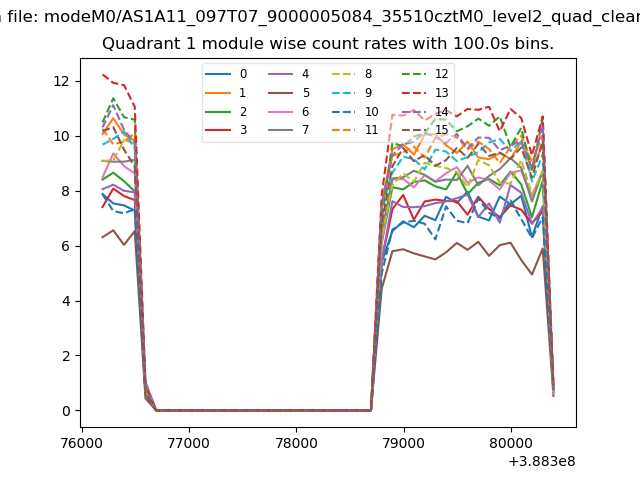
| Module-wise count rates for Quadrant B Data is divided into 100 sec bins |
 |
 |
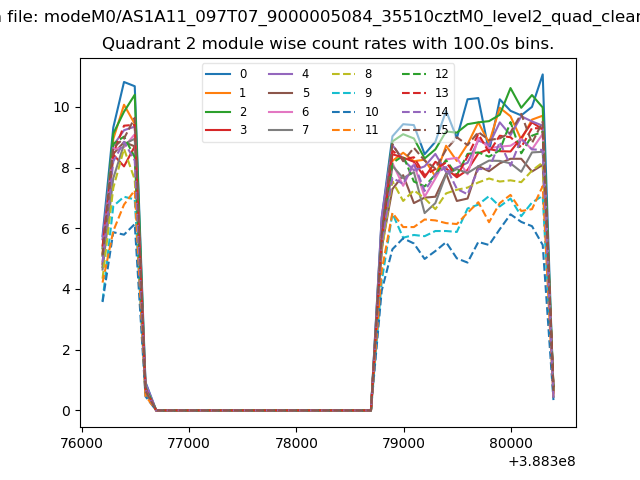
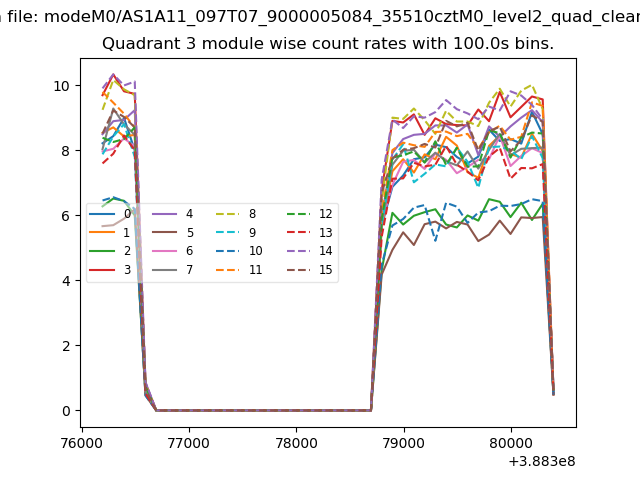
| Module-wise count rates for Quadrant C Data is divided into 100 sec bins |
 |
 |
| Module-wise count rates for Quadrant D Data is divided into 100 sec bins |
 |
 |
| Parameter | Plot |
|---|---|
| CZT HV Monitor | 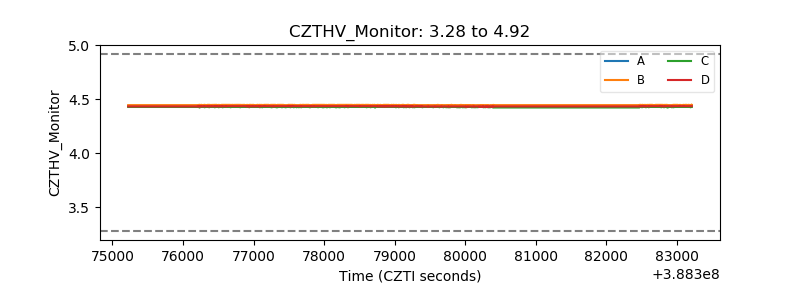 |
| D_VDD |  |
| Temperature 1 | 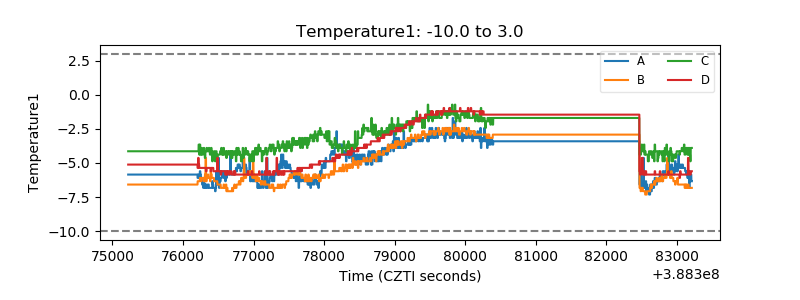 |
| Veto HV Monitor | 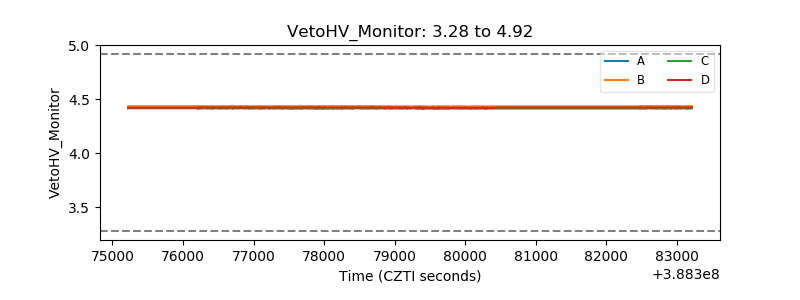 |
| Veto LLD | 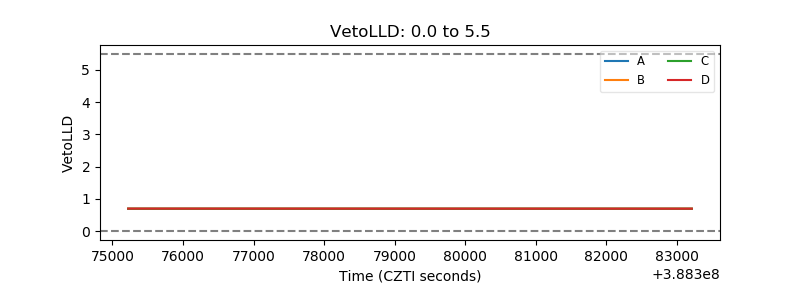 |
| Alpha Counter | 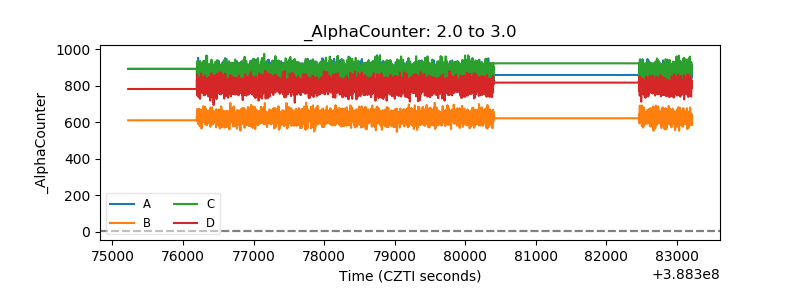 |
| _CPM_Rate | 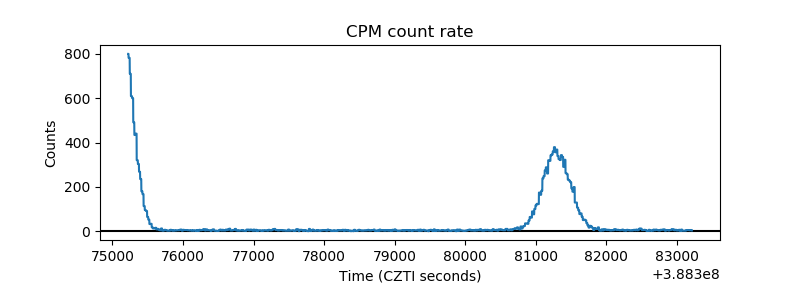 |
| CZT Counter | 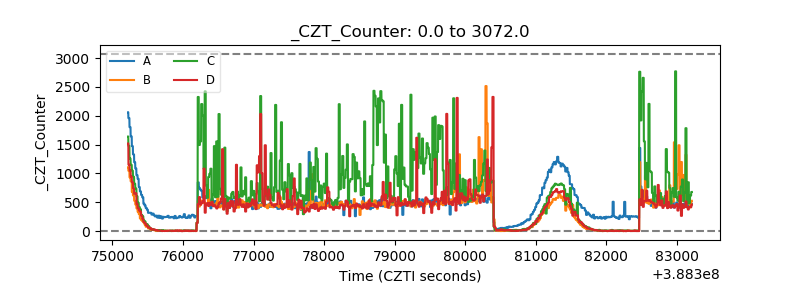 |
| +2.5 Volts monitor |  |
| +5 Volts monitor | 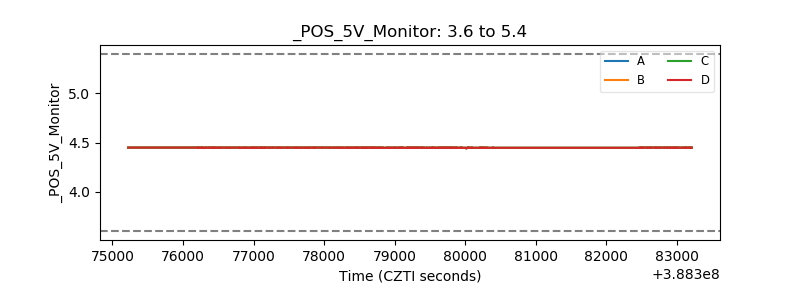 |
| _ROLL_ROT | 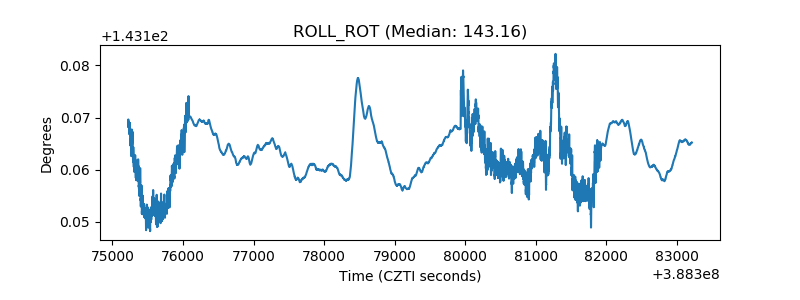 |
| _Roll_DEC | 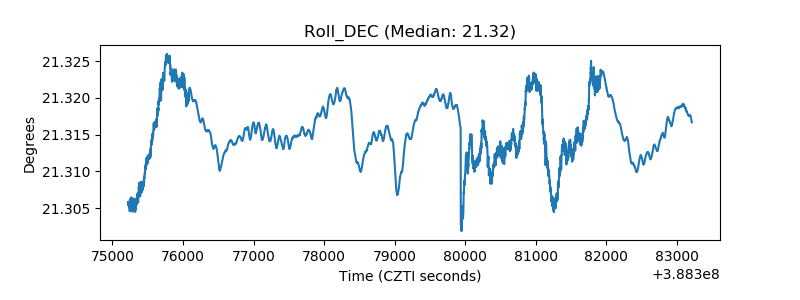 |
| _Roll_RA | 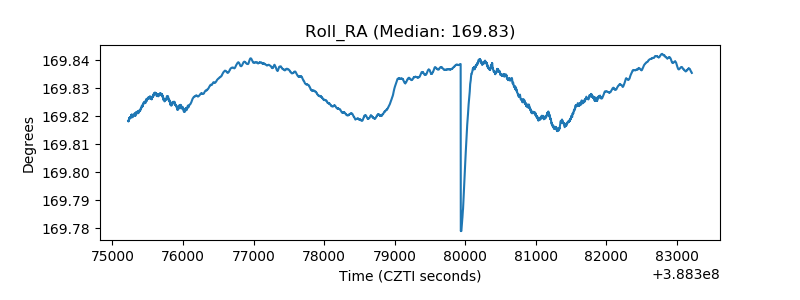 |
| Veto Counter | 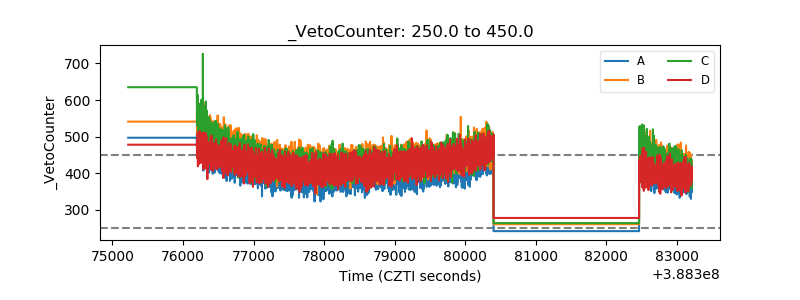 |