| Param | Original file | Final file |
|---|---|---|
| Filename | modeM0/AS1A11_097T07_9000005084_35509cztM0_level2.evt | modeM0/AS1A11_097T07_9000005084_35509cztM0_level2_quad_clean.evt |
| Size (bytes) | 392,463,360 | 54,109,440 |
| Size | 374.3 MB | 51.6 MB |
| Events in quadrant A | 2,450,994 | 332,383 |
| Events in quadrant B | 2,469,544 | 343,238 |
| Events in quadrant C | 3,447,739 | 311,070 |
| Events in quadrant D | 3,186,576 | 309,842 |
| Mode SS | |||
|---|---|---|---|
| Quadrant | BADHDUFLAG | Total packets | Discarded packets |
| A | 0 | 100 | 0 |
| B | 0 | 100 | 0 |
| C | 0 | 100 | 0 |
| D | 0 | 100 | 0 |
| Mode M0 | |||
|---|---|---|---|
| Quadrant | BADHDUFLAG | Total packets | Discarded packets |
| A | 0 | 10140 | 3 |
| B | 0 | 10215 | 2 |
| C | 0 | 13245 | 2 |
| D | 0 | 12643 | 2 |
| Mode M9 | |||
|---|---|---|---|
| Quadrant | BADHDUFLAG | Total packets | Discarded packets |
| A | 0 | 35 | 0 |
| B | 0 | 35 | 0 |
| C | 0 | 35 | 0 |
| D | 0 | 36 | 0 |
| Quadrant | Total seconds | Saturated seconds | Saturation percentage |
|---|---|---|---|
| A | 4864 | 5 | 0.102796% |
| B | 4864 | 7 | 0.143914% |
| C | 4864 | 232 | 4.769737% |
| D | 4864 | 164 | 3.371711% |
Noise dominated data is calculated using 1-second bins in cleaned event files. If a bin has >2000 counts, and if more than 50% of those come from <1% of pixels, then it is considered to be noise-dominated and hence unusable.
| Quadrant | # 1 sec bins | Bins with >0 counts | Bins with >2000 counts | High rate bins dominated by noise | Noise dominated (total time) | Noise dominated (detector-on time) | Marked lightcurve |
|---|---|---|---|---|---|---|---|
| A | 7018 | 4865 | 0 | 0 | 0.00% | 0.00% | 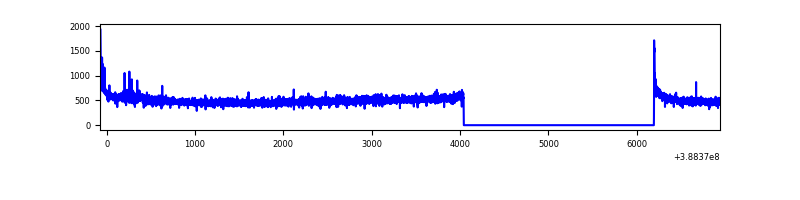 |
| B | 7018 | 4865 | 2 | 2 | 0.03% | 0.04% | 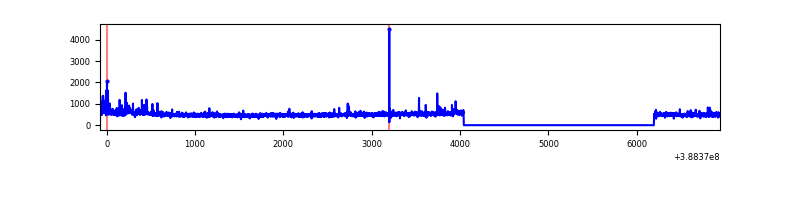 |
| C | 7018 | 4865 | 169 | 169 | 2.41% | 3.47% | 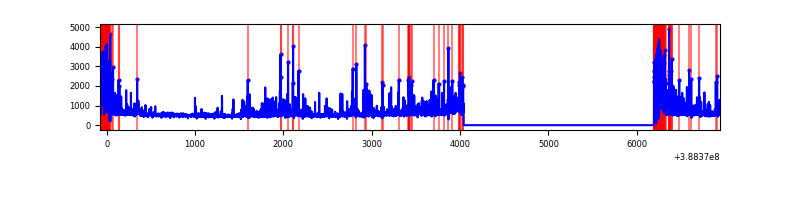 |
| D | 7018 | 4865 | 144 | 144 | 2.05% | 2.96% | 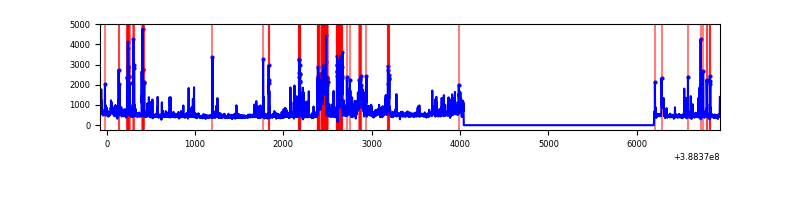 |
Top three noisy pixels from each quadrant. If the there are fewer than three noisy pixels in the level2.evt file, extra rows are filled as -1
| Pixel properties | Quadrant properties | ||||||
|---|---|---|---|---|---|---|---|
| Quadrant | DetID | PixID | Counts | Sigma | Mean | Median | Sigma |
| A | 10 | 83 | 125180 | 1042.54 | 596 | 586 | 119.5 |
| A | 15 | 169 | 15006 | 120.66 | 596 | 586 | 119.5 |
| A | 13 | 254 | 6505 | 49.52 | 596 | 586 | 119.5 |
| B | 5 | 236 | 76124 | 664.55 | 596 | 582 | 113.7 |
| B | 5 | 172 | 16921 | 143.74 | 596 | 582 | 113.7 |
| B | 12 | 111 | 13817 | 116.43 | 596 | 582 | 113.7 |
| C | 0 | 10 | 779620 | 5939.78 | 565 | 571 | 131.2 |
| C | 0 | 207 | 209896 | 1595.98 | 565 | 571 | 131.2 |
| C | 15 | 214 | 199511 | 1516.8 | 565 | 571 | 131.2 |
| D | 7 | 80 | 460203 | 3283.23 | 567 | 554 | 140.0 |
| D | 12 | 6 | 332016 | 2367.6 | 567 | 554 | 140.0 |
| D | 13 | 249 | 79107 | 561.1 | 567 | 554 | 140.0 |
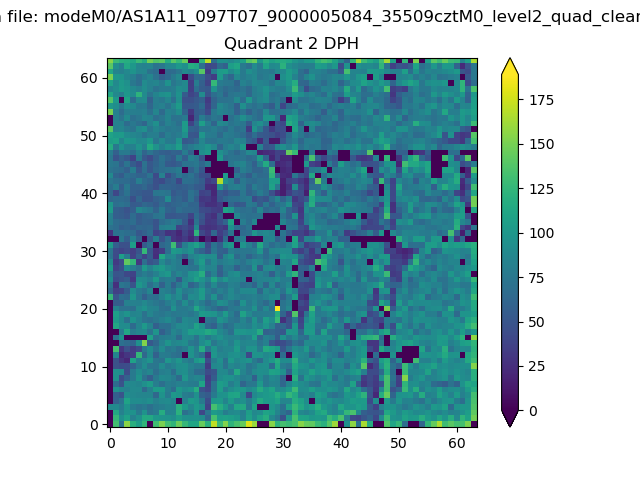
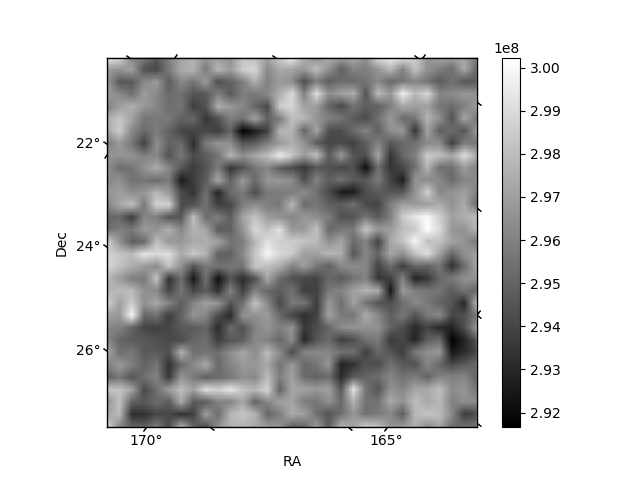
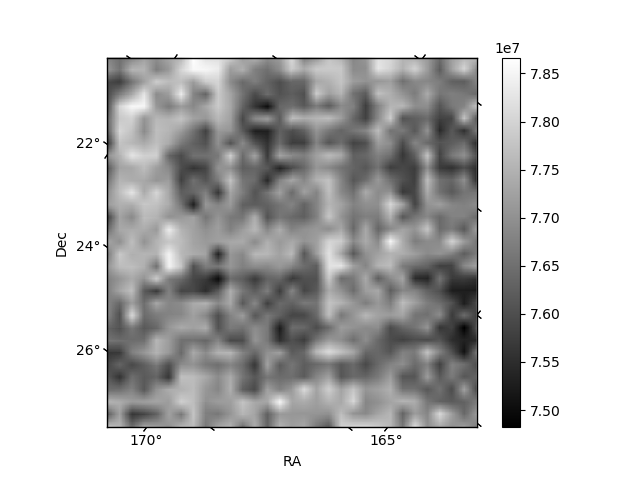
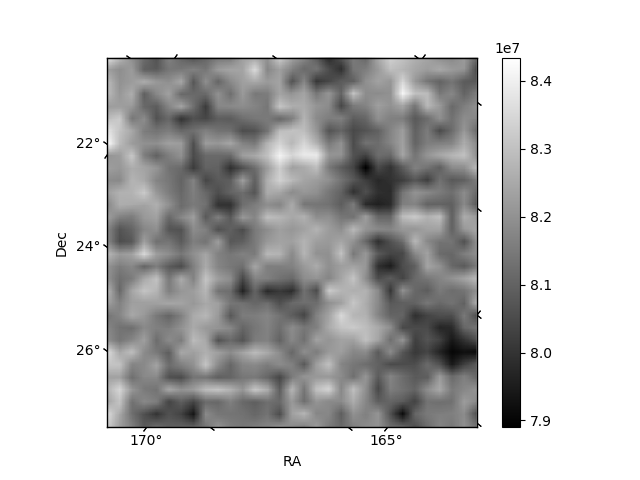
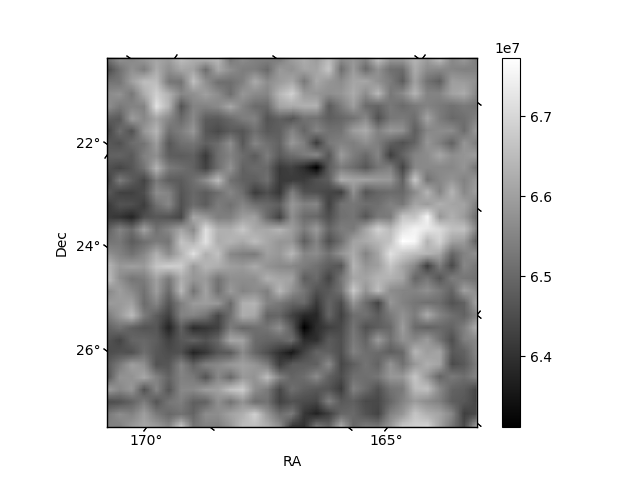
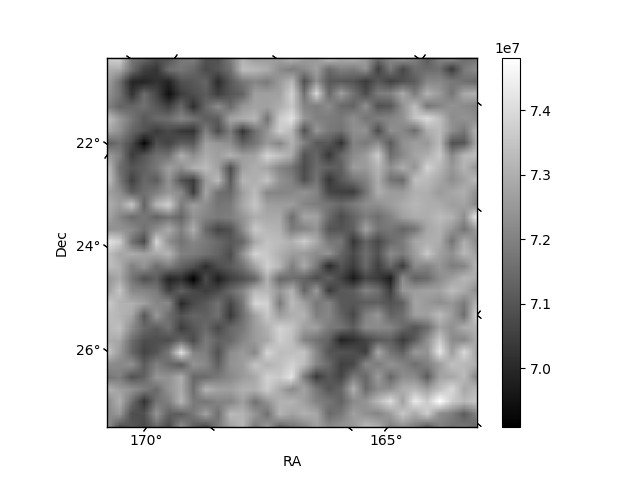
Histogram calculated using DETX and DETY for each event in the final _common_clean file
| Quadrant A | 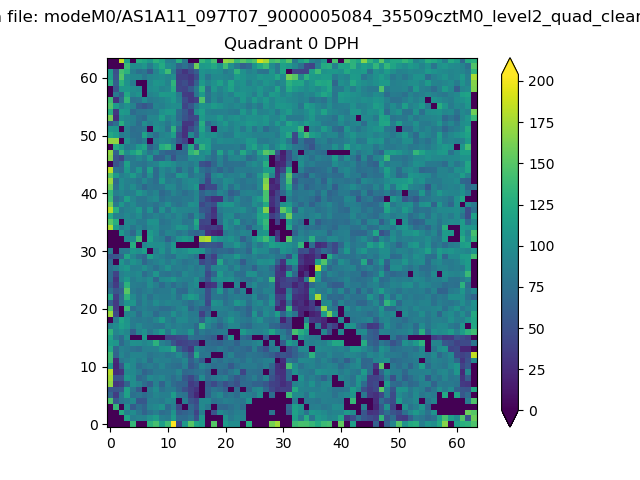 |
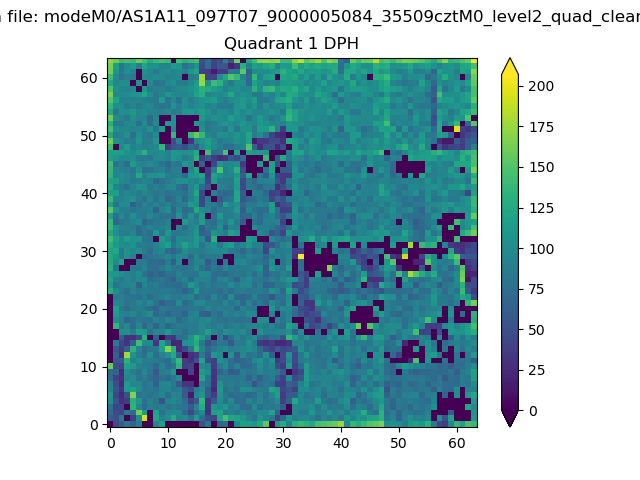 |
Quadrant B |
|---|---|---|---|
| Quadrant D | 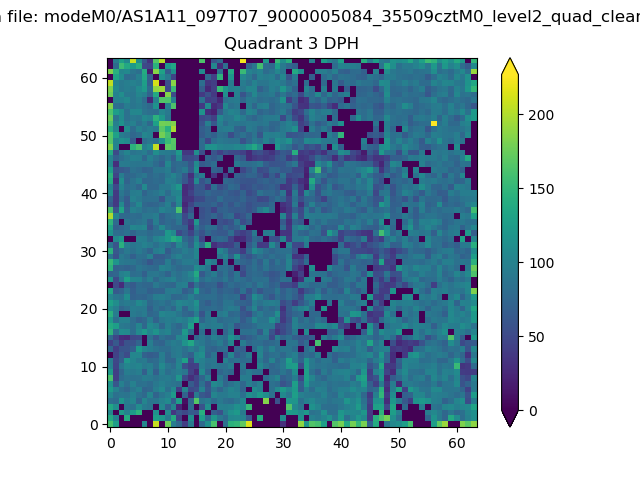 |
 |
Quadrant C |
| Plot type | Count rate plots | Images |
|---|---|---|
| Comparison with Poisson distribution Blue bars denote a histogram of data divided into 1 sec bins. Red curve is a Poisson curve with rate = median count rate of data. |
 |
 |
| Quadrant-wise count rates Data is divided into 100 sec bins |
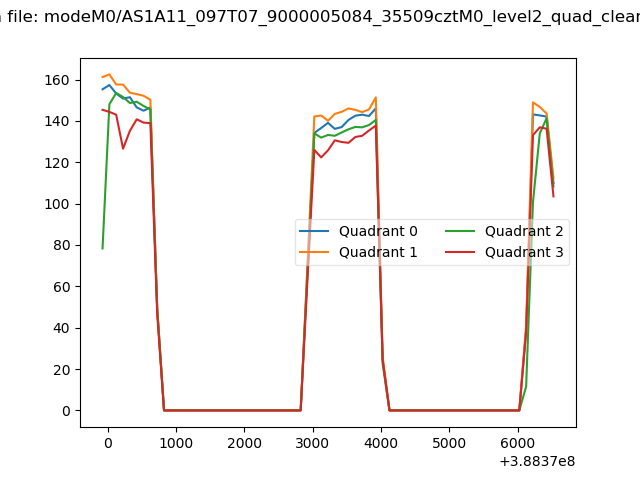 |
|
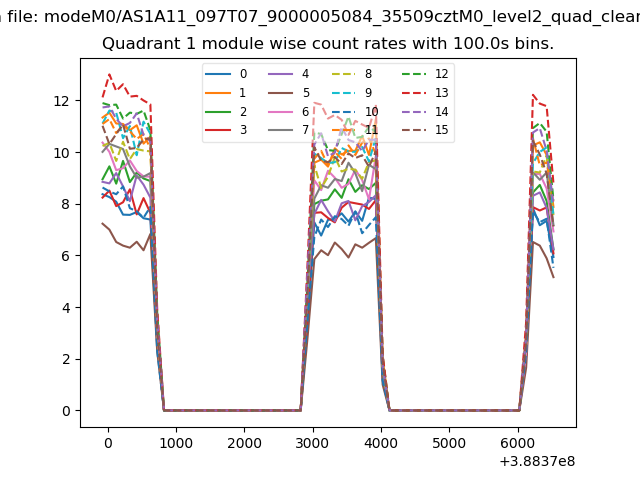
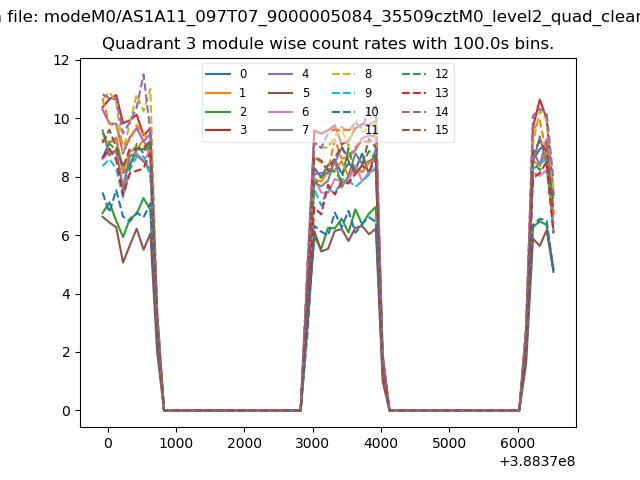
| Module-wise count rates for Quadrant A Data is divided into 100 sec bins |
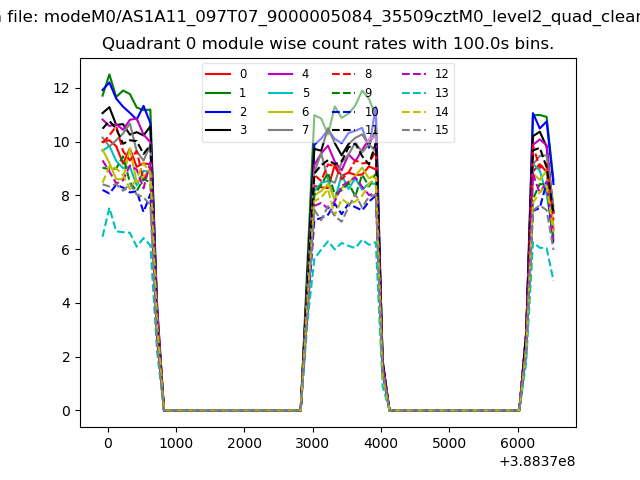 |
 |
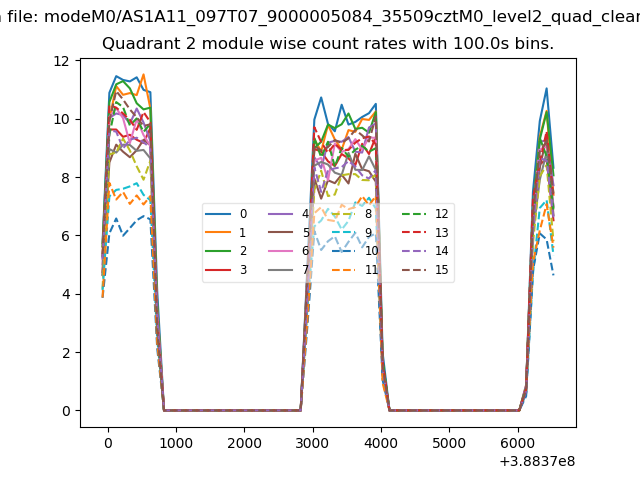
| Module-wise count rates for Quadrant B Data is divided into 100 sec bins |
 |
 |
| Module-wise count rates for Quadrant C Data is divided into 100 sec bins |
 |
 |
| Module-wise count rates for Quadrant D Data is divided into 100 sec bins |
 |
 |
| Parameter | Plot |
|---|---|
| CZT HV Monitor | 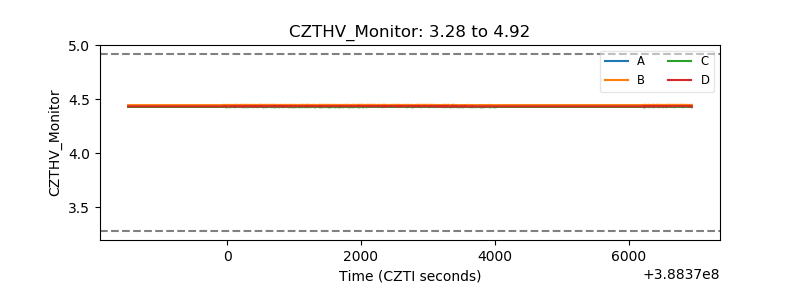 |
| D_VDD | 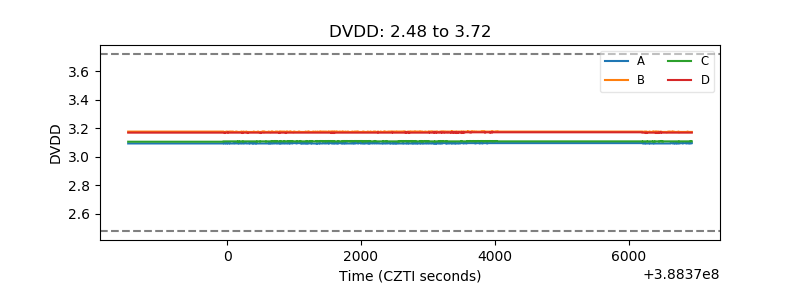 |
| Temperature 1 | 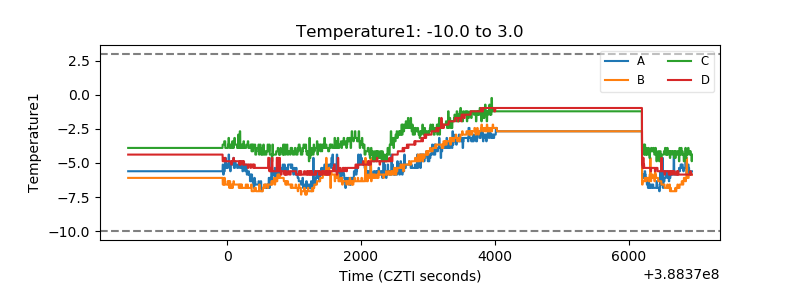 |
| Veto HV Monitor | 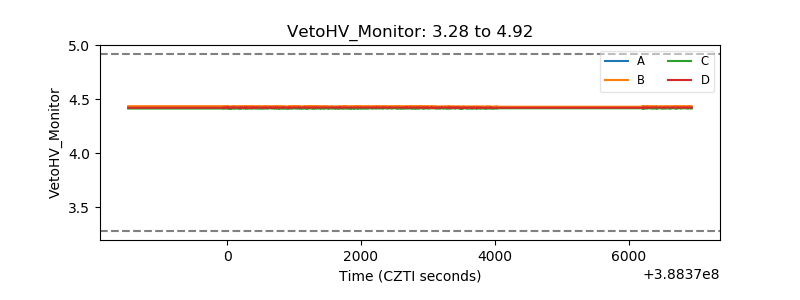 |
| Veto LLD | 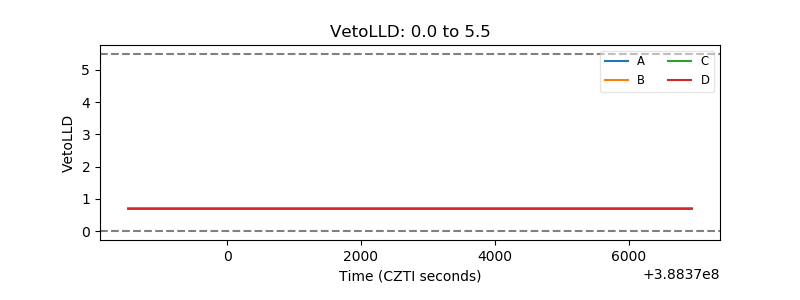 |
| Alpha Counter | 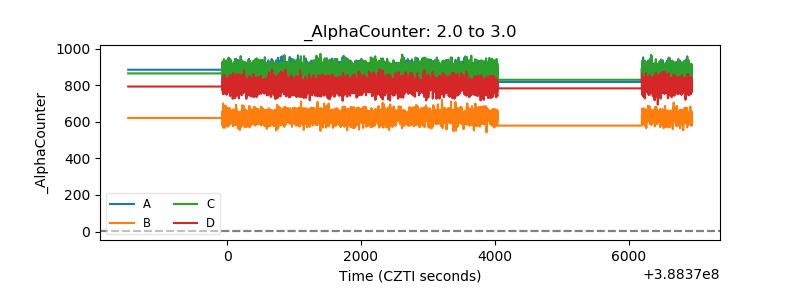 |
| _CPM_Rate | 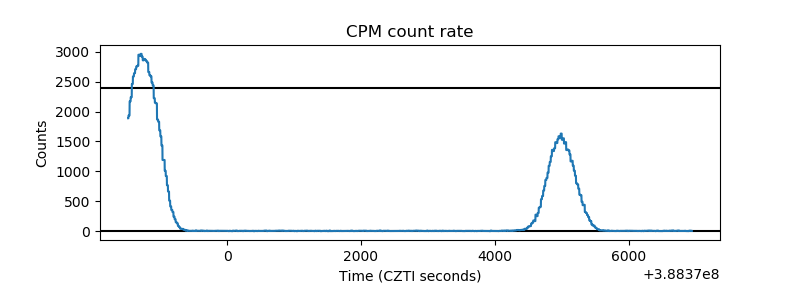 |
| CZT Counter | 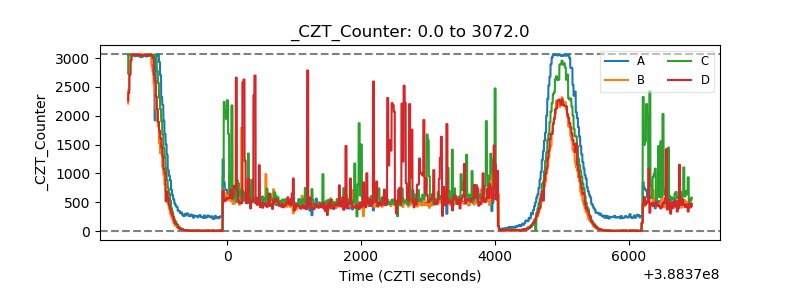 |
| +2.5 Volts monitor | 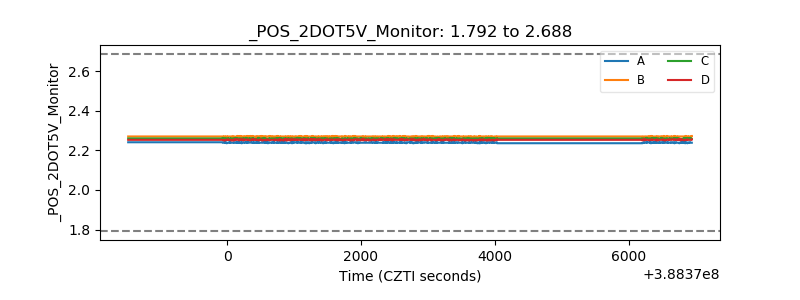 |
| +5 Volts monitor | 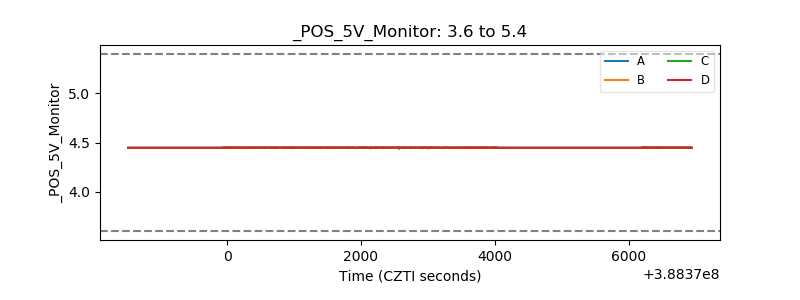 |
| _ROLL_ROT | 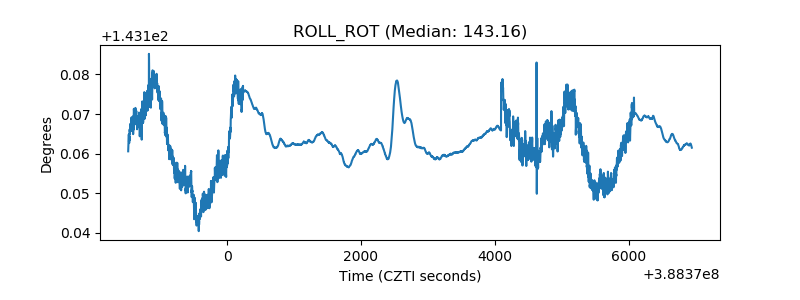 |
| _Roll_DEC | 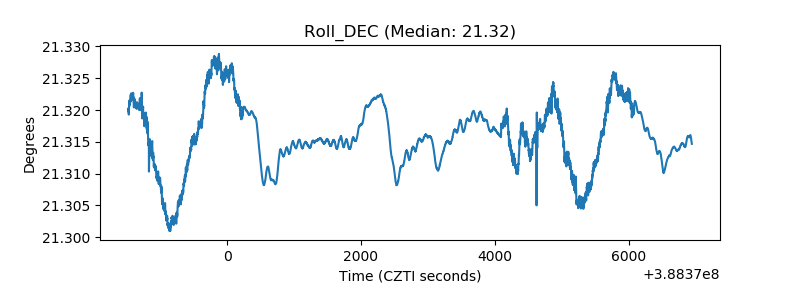 |
| _Roll_RA | 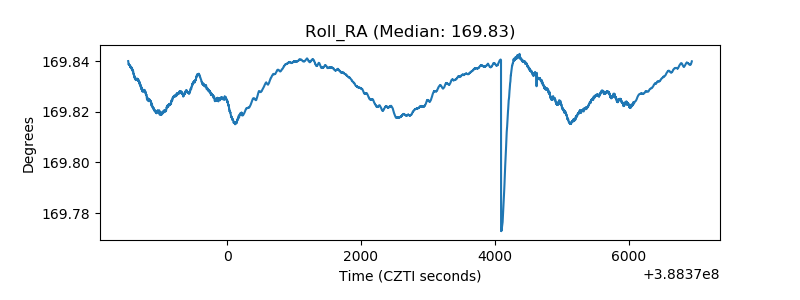 |
| Veto Counter | 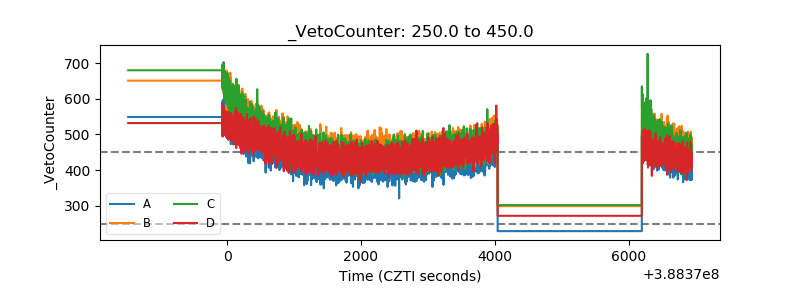 |