| Param | Original file | Final file |
|---|---|---|
| Filename | modeM0/AS1A11_097T07_9000005084_35508cztM0_level2.evt | modeM0/AS1A11_097T07_9000005084_35508cztM0_level2_quad_clean.evt |
| Size (bytes) | 393,816,960 | 61,588,800 |
| Size | 375.6 MB | 58.7 MB |
| Events in quadrant A | 2,477,935 | 392,059 |
| Events in quadrant B | 2,835,423 | 401,361 |
| Events in quadrant C | 3,239,545 | 373,952 |
| Events in quadrant D | 3,045,128 | 358,067 |
| Mode SS | |||
|---|---|---|---|
| Quadrant | BADHDUFLAG | Total packets | Discarded packets |
| A | 0 | 98 | 0 |
| B | 0 | 98 | 0 |
| C | 0 | 98 | 0 |
| D | 0 | 98 | 0 |
| Mode M0 | |||
|---|---|---|---|
| Quadrant | BADHDUFLAG | Total packets | Discarded packets |
| A | 0 | 10238 | 3 |
| B | 0 | 11335 | 2 |
| C | 0 | 12611 | 2 |
| D | 0 | 12177 | 2 |
| Mode M9 | |||
|---|---|---|---|
| Quadrant | BADHDUFLAG | Total packets | Discarded packets |
| A | 0 | 37 | 0 |
| B | 0 | 37 | 0 |
| C | 0 | 37 | 0 |
| D | 0 | 38 | 0 |
| Quadrant | Total seconds | Saturated seconds | Saturation percentage |
|---|---|---|---|
| A | 4836 | 7 | 0.144748% |
| B | 4836 | 83 | 1.716294% |
| C | 4836 | 196 | 4.052936% |
| D | 4836 | 113 | 2.336642% |
Noise dominated data is calculated using 1-second bins in cleaned event files. If a bin has >2000 counts, and if more than 50% of those come from <1% of pixels, then it is considered to be noise-dominated and hence unusable.
| Quadrant | # 1 sec bins | Bins with >0 counts | Bins with >2000 counts | High rate bins dominated by noise | Noise dominated (total time) | Noise dominated (detector-on time) | Marked lightcurve |
|---|---|---|---|---|---|---|---|
| A | 6928 | 4837 | 1 | 1 | 0.01% | 0.02% | 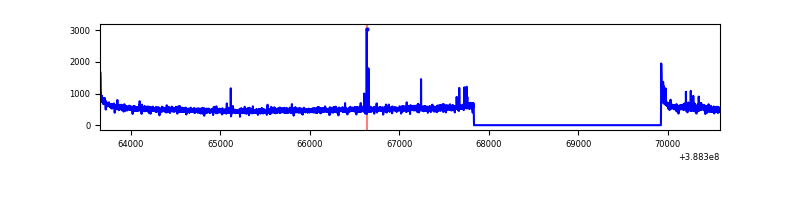 |
| B | 6928 | 4837 | 54 | 54 | 0.78% | 1.12% | 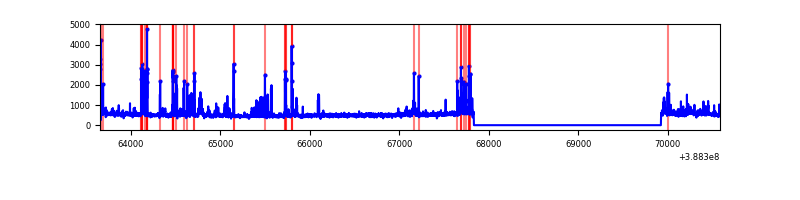 |
| C | 6928 | 4837 | 136 | 136 | 1.96% | 2.81% | 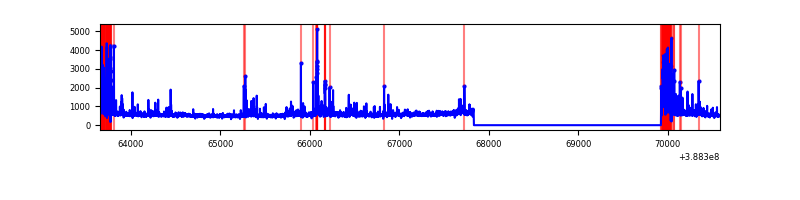 |
| D | 6928 | 4837 | 94 | 94 | 1.36% | 1.94% | 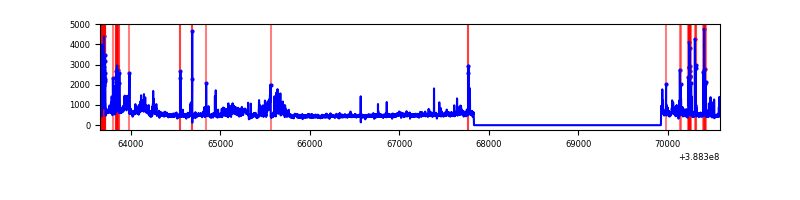 |
Top three noisy pixels from each quadrant. If the there are fewer than three noisy pixels in the level2.evt file, extra rows are filled as -1
| Pixel properties | Quadrant properties | ||||||
|---|---|---|---|---|---|---|---|
| Quadrant | DetID | PixID | Counts | Sigma | Mean | Median | Sigma |
| A | 10 | 83 | 124315 | 1026.34 | 600 | 590 | 120.5 |
| A | 15 | 169 | 24739 | 200.32 | 600 | 590 | 120.5 |
| A | 13 | 6 | 7598 | 58.13 | 600 | 590 | 120.5 |
| B | 5 | 172 | 237067 | 2081.21 | 600 | 586 | 113.6 |
| B | 5 | 236 | 135420 | 1186.64 | 600 | 586 | 113.6 |
| B | 4 | 232 | 32854 | 283.98 | 600 | 586 | 113.6 |
| C | 0 | 10 | 511069 | 3843.19 | 573 | 578 | 132.8 |
| C | 15 | 214 | 197239 | 1480.55 | 573 | 578 | 132.8 |
| C | 0 | 207 | 110273 | 825.83 | 573 | 578 | 132.8 |
| D | 7 | 80 | 437674 | 3116.9 | 571 | 557 | 140.2 |
| D | 10 | 118 | 132922 | 943.84 | 571 | 557 | 140.2 |
| D | 12 | 6 | 111596 | 791.77 | 571 | 557 | 140.2 |
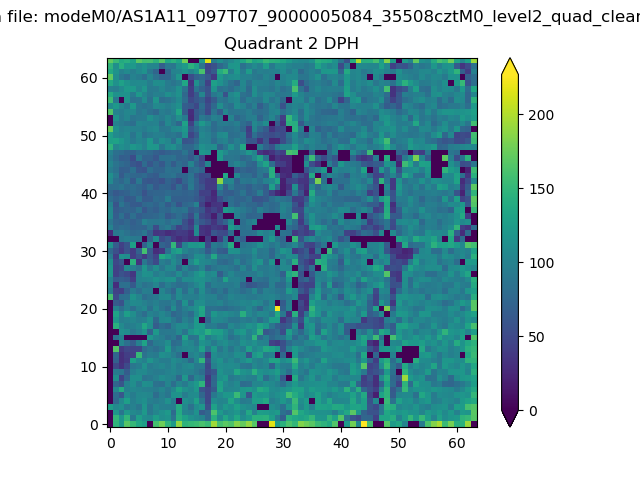
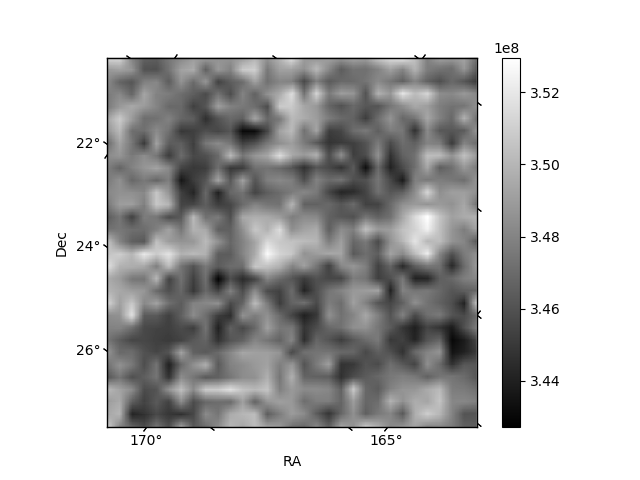
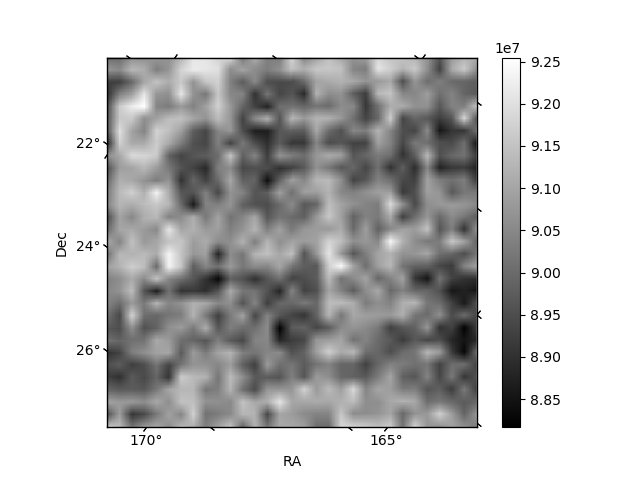
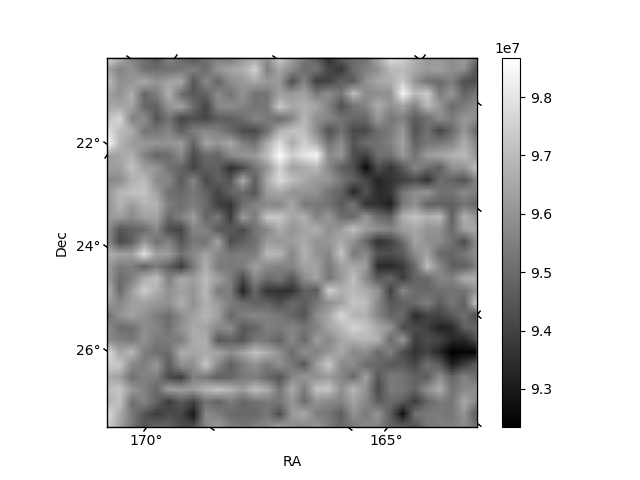
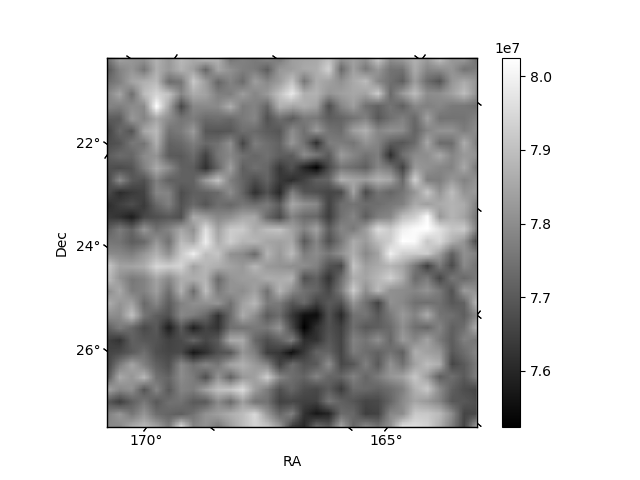
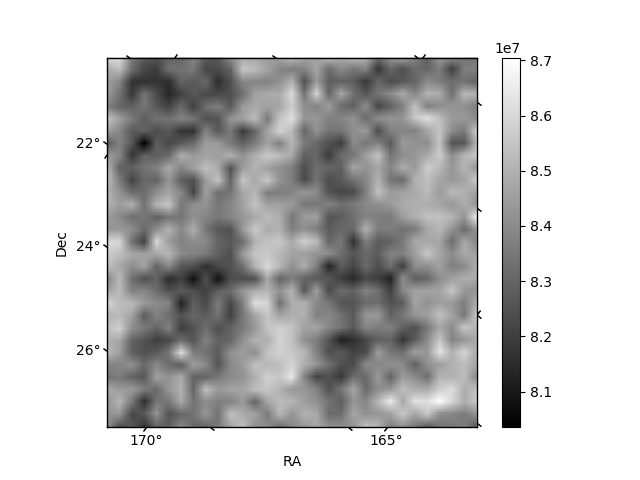
Histogram calculated using DETX and DETY for each event in the final _common_clean file
| Quadrant A | 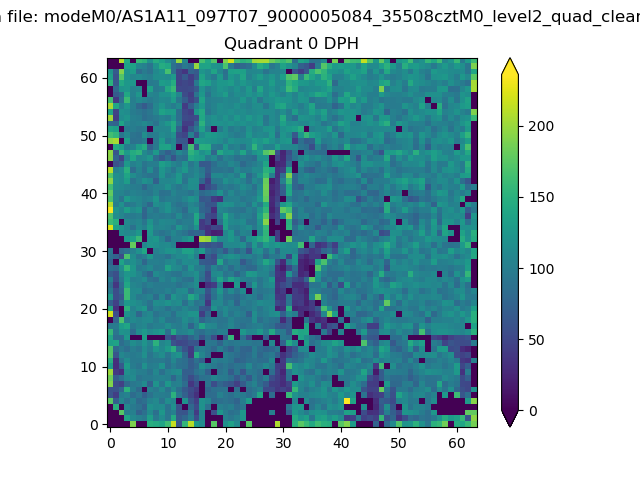 |
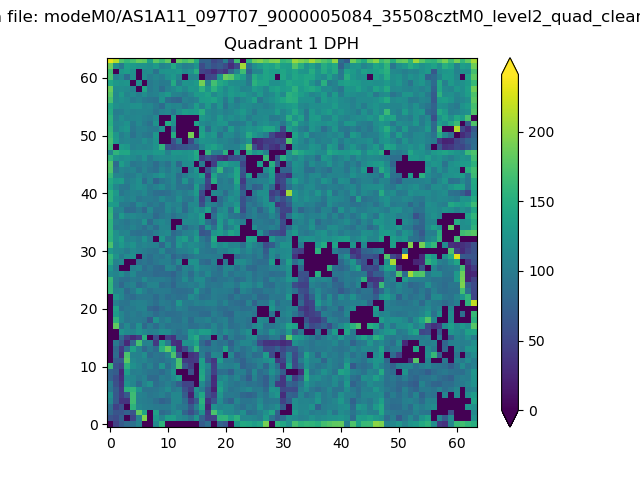 |
Quadrant B |
|---|---|---|---|
| Quadrant D | 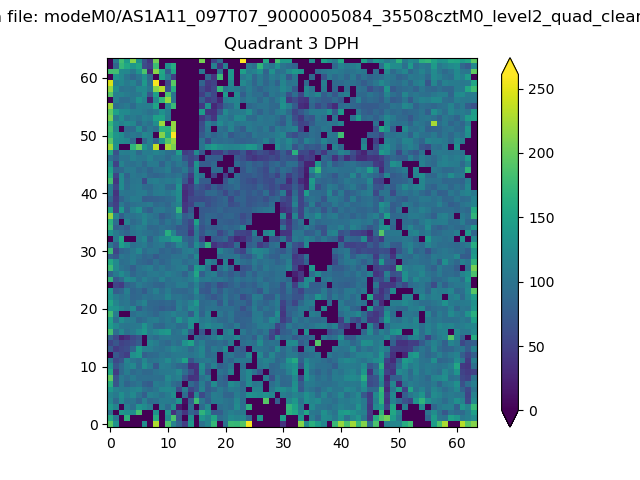 |
 |
Quadrant C |
| Plot type | Count rate plots | Images |
|---|---|---|
| Comparison with Poisson distribution Blue bars denote a histogram of data divided into 1 sec bins. Red curve is a Poisson curve with rate = median count rate of data. |
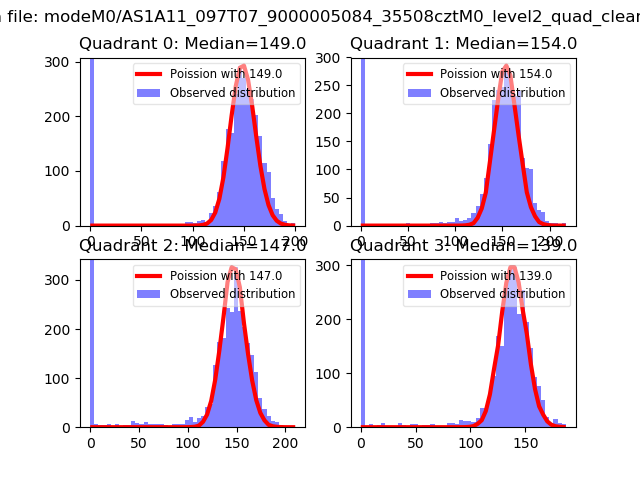 |
 |
| Quadrant-wise count rates Data is divided into 100 sec bins |
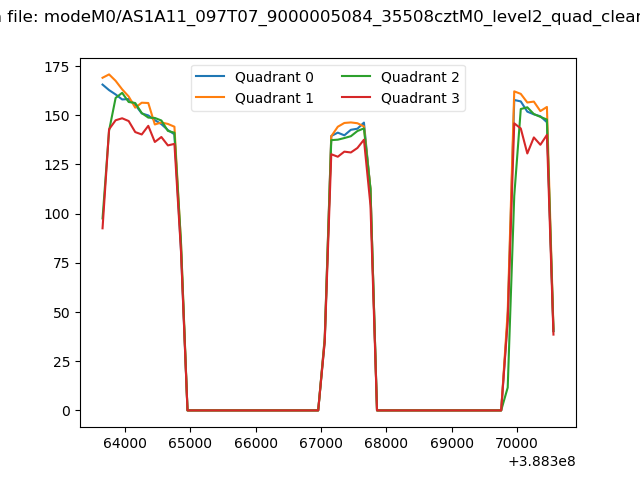 |
|
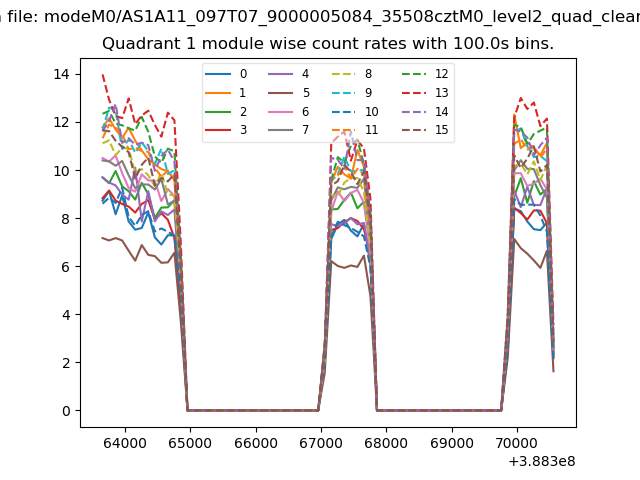
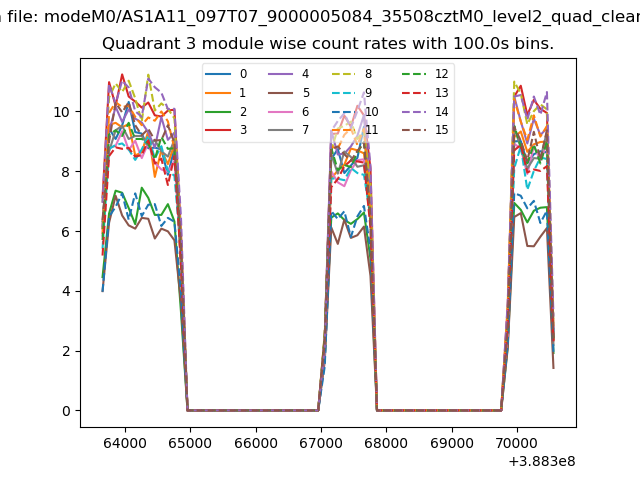
| Module-wise count rates for Quadrant A Data is divided into 100 sec bins |
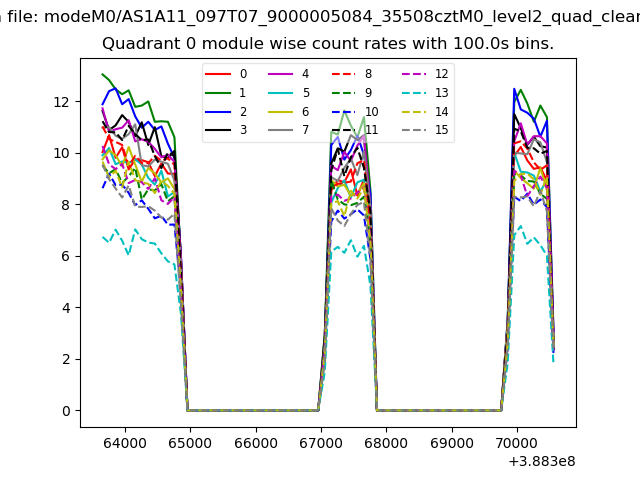 |
 |
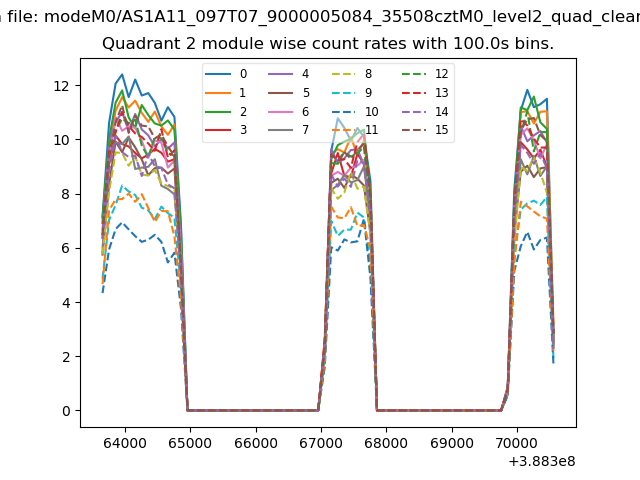
| Module-wise count rates for Quadrant B Data is divided into 100 sec bins |
 |
 |
| Module-wise count rates for Quadrant C Data is divided into 100 sec bins |
 |
 |
| Module-wise count rates for Quadrant D Data is divided into 100 sec bins |
 |
 |
| Parameter | Plot |
|---|---|
| CZT HV Monitor | 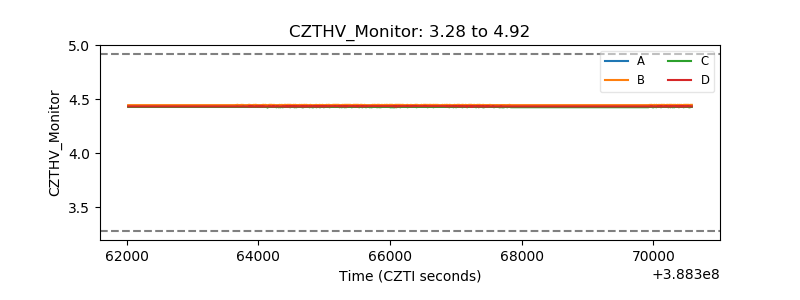 |
| D_VDD | 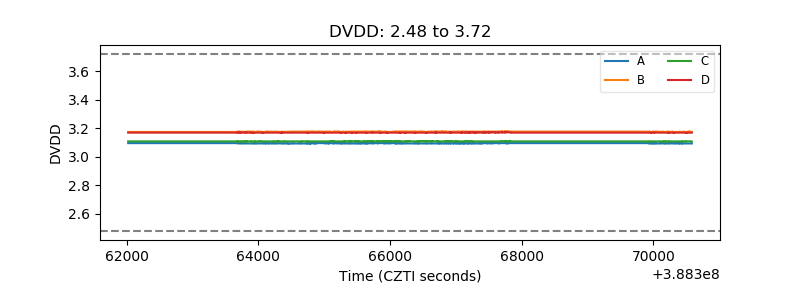 |
| Temperature 1 | 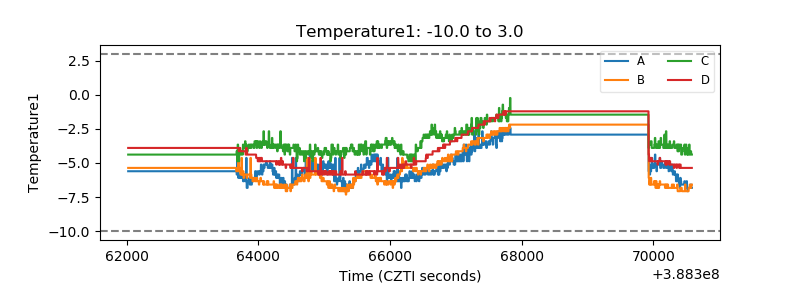 |
| Veto HV Monitor | 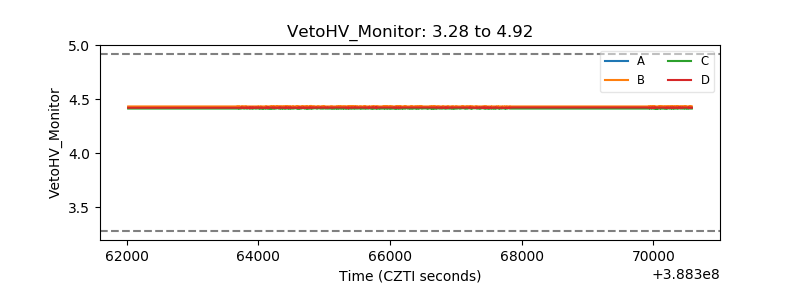 |
| Veto LLD | 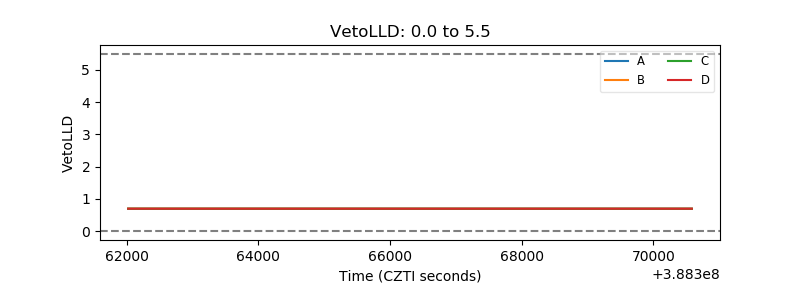 |
| Alpha Counter | 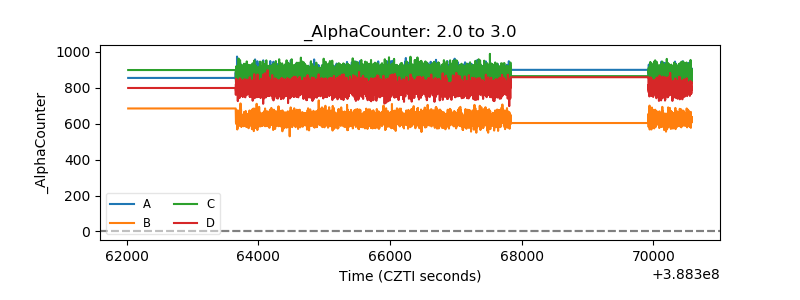 |
| _CPM_Rate | 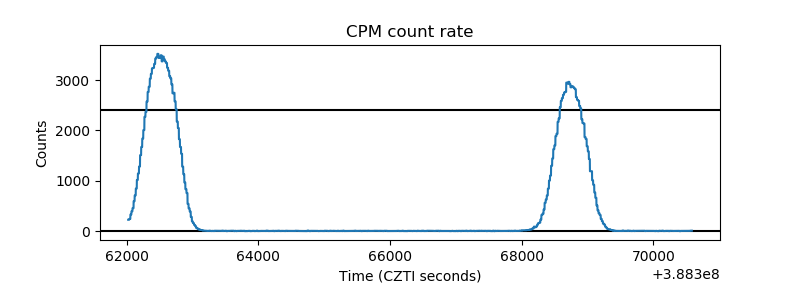 |
| CZT Counter | 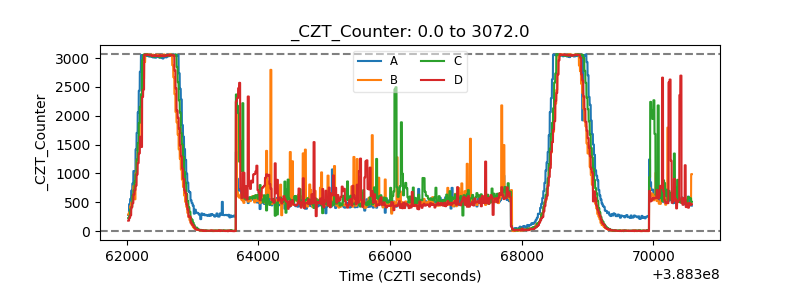 |
| +2.5 Volts monitor | 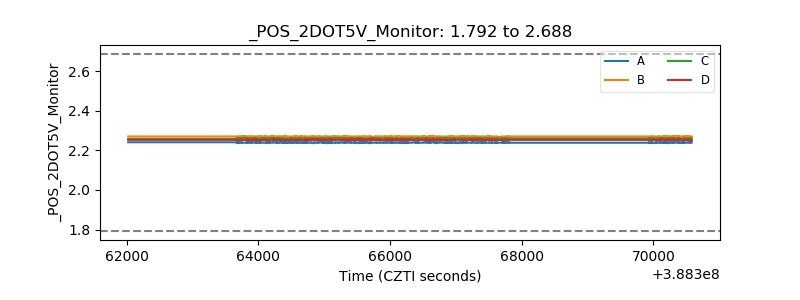 |
| +5 Volts monitor | 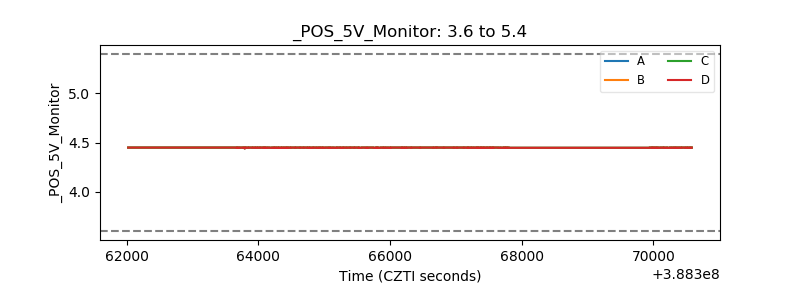 |
| _ROLL_ROT | 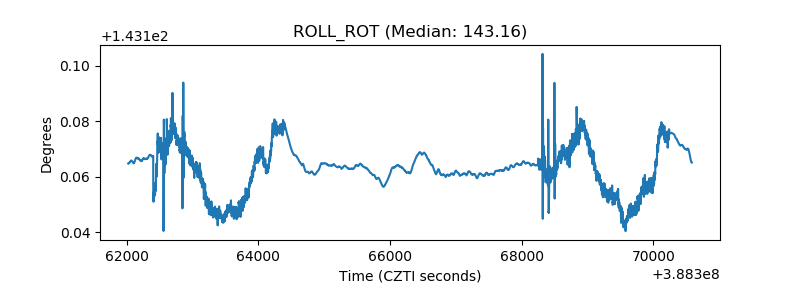 |
| _Roll_DEC | 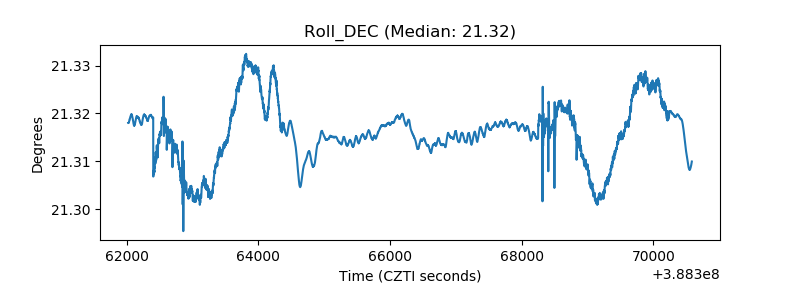 |
| _Roll_RA | 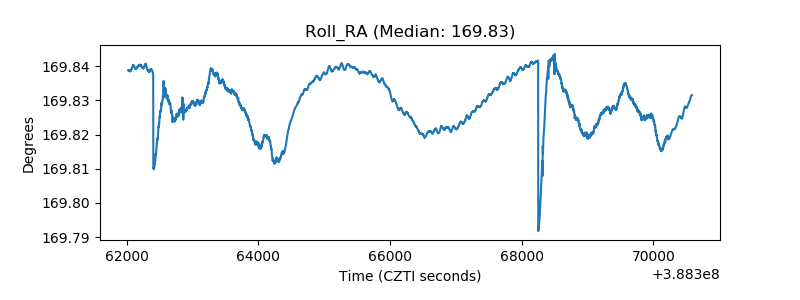 |
| Veto Counter | 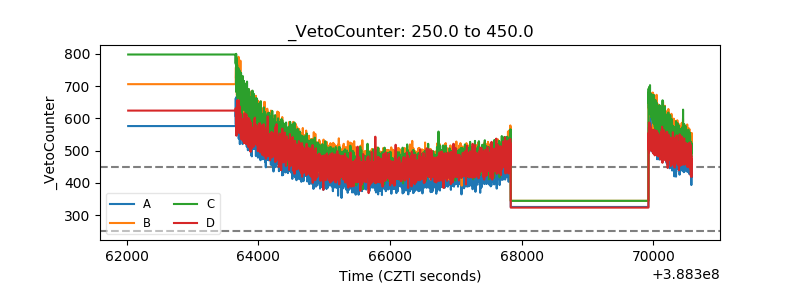 |