| Param | Original file | Final file |
|---|---|---|
| Filename | modeM0/AS1A11_097T22_9000005082_35505cztM0_level2.evt | modeM0/AS1A11_097T22_9000005082_35505cztM0_level2_quad_clean.evt |
| Size (bytes) | 372,594,240 | 84,087,360 |
| Size | 355.3 MB | 80.2 MB |
| Events in quadrant A | 2,410,788 | 550,801 |
| Events in quadrant B | 3,033,980 | 551,024 |
| Events in quadrant C | 2,637,199 | 571,734 |
| Events in quadrant D | 2,874,758 | 535,251 |
| Mode M9 | |||
|---|---|---|---|
| Quadrant | BADHDUFLAG | Total packets | Discarded packets |
| A | 0 | 19 | 0 |
| B | 0 | 19 | 0 |
| C | 0 | 19 | 0 |
| D | 0 | 20 | 0 |
| Mode M0 | |||
|---|---|---|---|
| Quadrant | BADHDUFLAG | Total packets | Discarded packets |
| A | 0 | 10495 | 2 |
| B | 0 | 12237 | 2 |
| C | 0 | 10799 | 2 |
| D | 0 | 11993 | 2 |
| Mode SS | |||
|---|---|---|---|
| Quadrant | BADHDUFLAG | Total packets | Discarded packets |
| A | 0 | 98 | 0 |
| B | 0 | 98 | 0 |
| C | 0 | 98 | 0 |
| D | 0 | 98 | 0 |
| Quadrant | Total seconds | Saturated seconds | Saturation percentage |
|---|---|---|---|
| A | 4808 | 61 | 1.268719% |
| B | 4808 | 256 | 5.324459% |
| C | 4808 | 91 | 1.892679% |
| D | 4808 | 159 | 3.306988% |
Noise dominated data is calculated using 1-second bins in cleaned event files. If a bin has >2000 counts, and if more than 50% of those come from <1% of pixels, then it is considered to be noise-dominated and hence unusable.
| Quadrant | # 1 sec bins | Bins with >0 counts | Bins with >2000 counts | High rate bins dominated by noise | Noise dominated (total time) | Noise dominated (detector-on time) | Marked lightcurve |
|---|---|---|---|---|---|---|---|
| A | 6570 | 4809 | 47 | 47 | 0.72% | 0.98% | 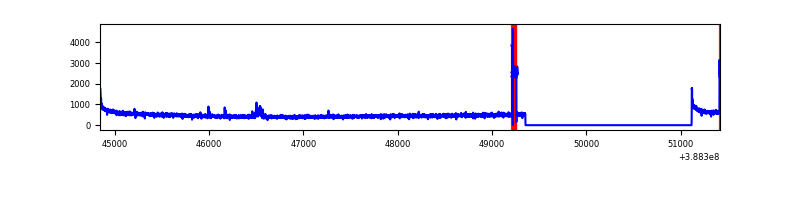 |
| B | 6570 | 4809 | 175 | 175 | 2.66% | 3.64% | 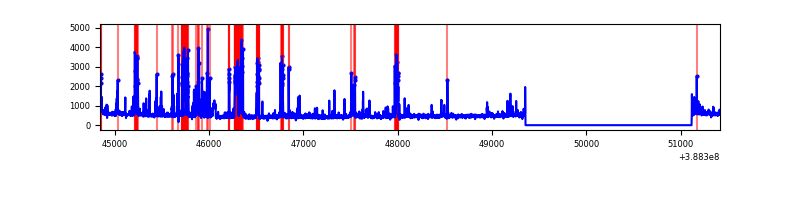 |
| C | 6570 | 4809 | 54 | 54 | 0.82% | 1.12% | 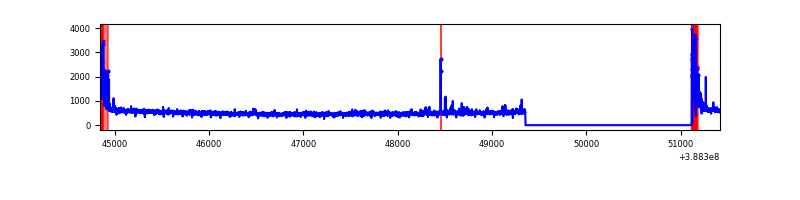 |
| D | 6570 | 4809 | 104 | 104 | 1.58% | 2.16% | 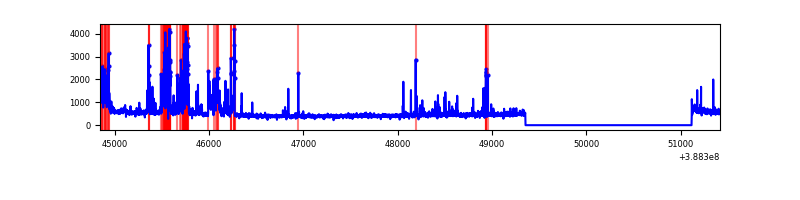 |
Top three noisy pixels from each quadrant. If the there are fewer than three noisy pixels in the level2.evt file, extra rows are filled as -1
| Pixel properties | Quadrant properties | ||||||
|---|---|---|---|---|---|---|---|
| Quadrant | DetID | PixID | Counts | Sigma | Mean | Median | Sigma |
| A | 15 | 169 | 165180 | 1487.89 | 546 | 536 | 110.7 |
| A | 10 | 83 | 125960 | 1133.46 | 546 | 536 | 110.7 |
| A | 13 | 254 | 7790 | 65.55 | 546 | 536 | 110.7 |
| B | 5 | 172 | 534547 | 5166.32 | 543 | 531 | 103.4 |
| B | 5 | 200 | 236969 | 2287.41 | 543 | 531 | 103.4 |
| B | 5 | 236 | 68438 | 656.96 | 543 | 531 | 103.4 |
| C | 0 | 10 | 251417 | 1982.95 | 549 | 554 | 126.5 |
| C | 15 | 214 | 199654 | 1573.79 | 549 | 554 | 126.5 |
| C | 14 | 67 | 34776 | 270.51 | 549 | 554 | 126.5 |
| D | 10 | 199 | 168868 | 1306.54 | 538 | 525 | 128.8 |
| D | 11 | 255 | 152241 | 1177.5 | 538 | 525 | 128.8 |
| D | 10 | 118 | 116446 | 899.69 | 538 | 525 | 128.8 |
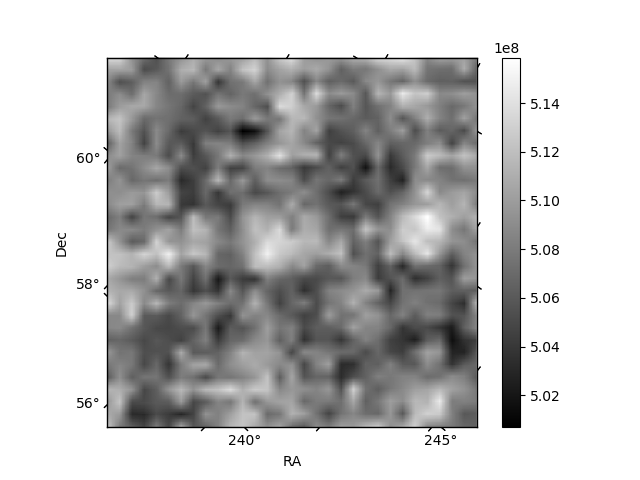
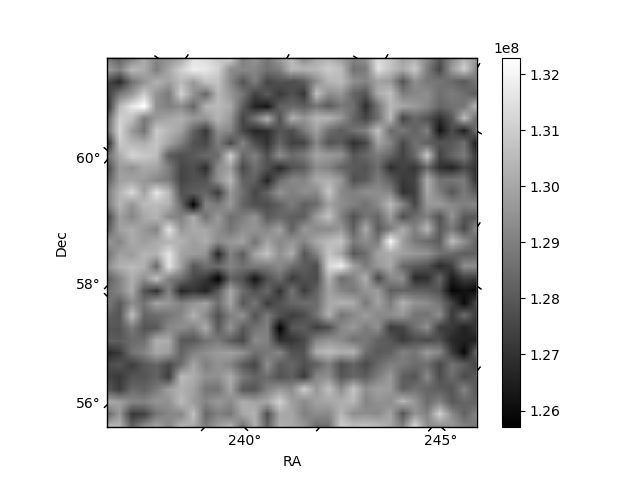
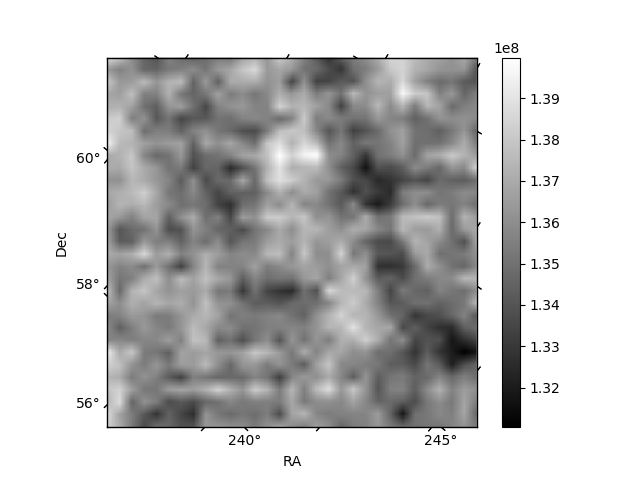
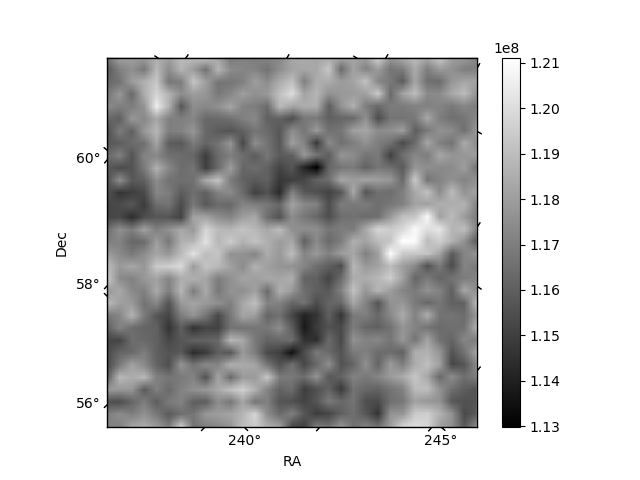
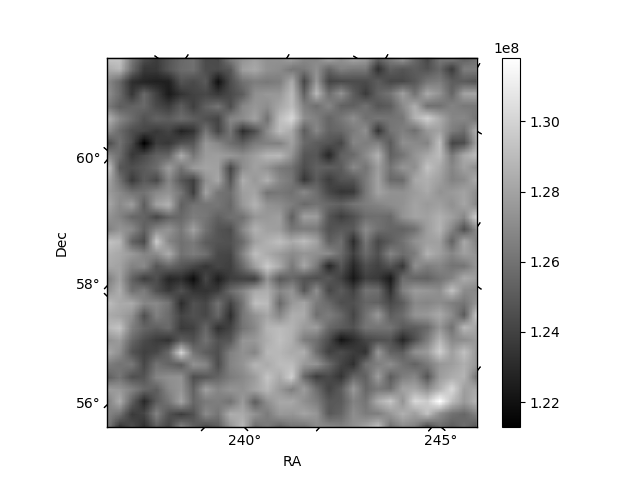
Histogram calculated using DETX and DETY for each event in the final _common_clean file
| Quadrant A | 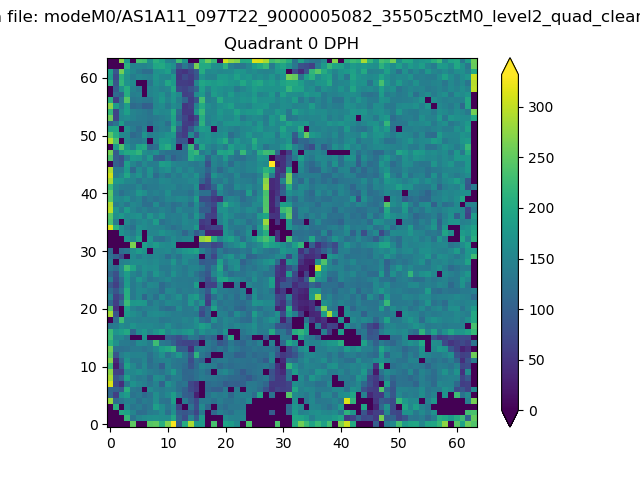 |
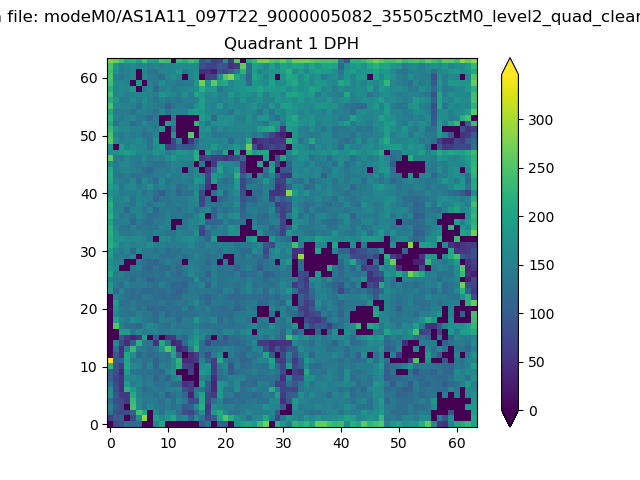 |
Quadrant B |
|---|---|---|---|
| Quadrant D | 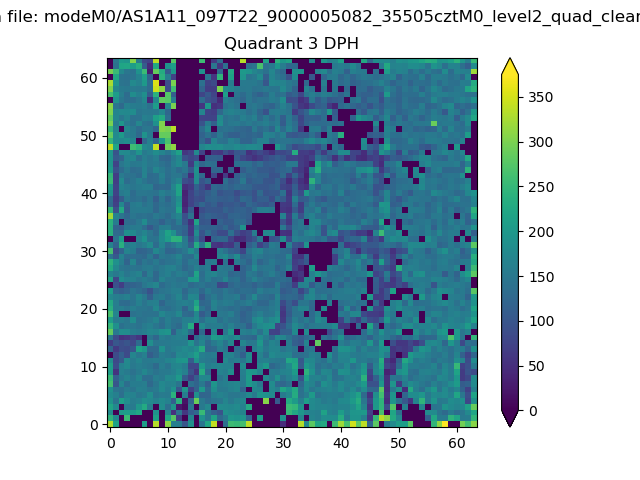 |
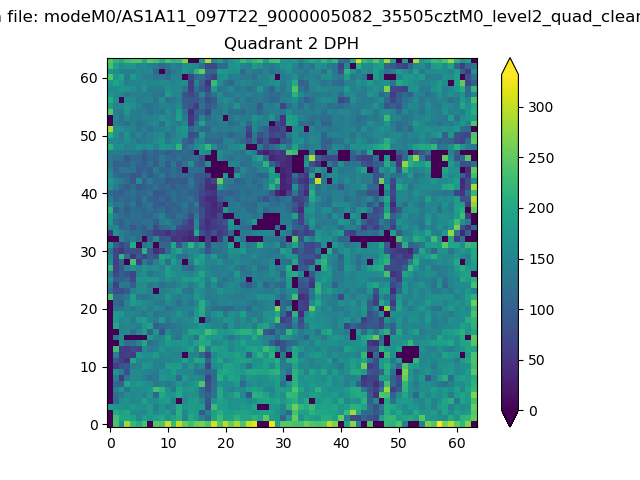 |
Quadrant C |
| Plot type | Count rate plots | Images |
|---|---|---|
| Comparison with Poisson distribution Blue bars denote a histogram of data divided into 1 sec bins. Red curve is a Poisson curve with rate = median count rate of data. |
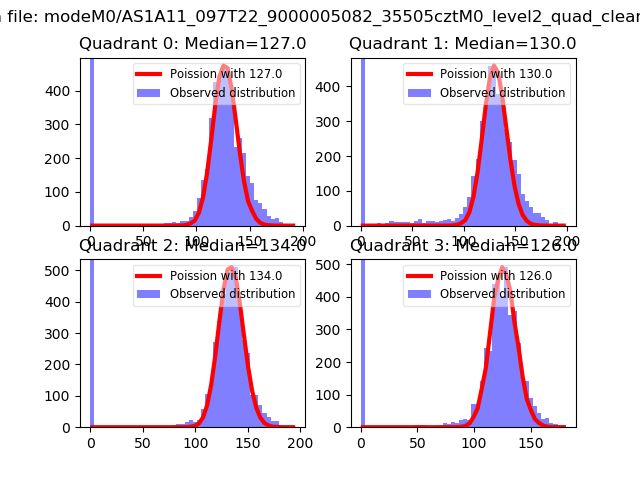 |
 |
| Quadrant-wise count rates Data is divided into 100 sec bins |
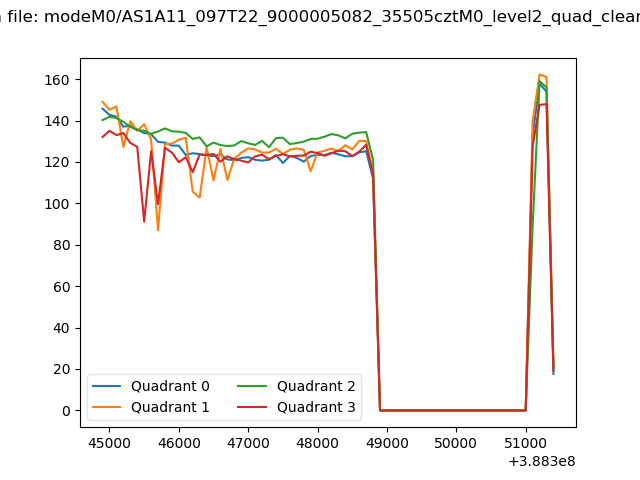 |
|
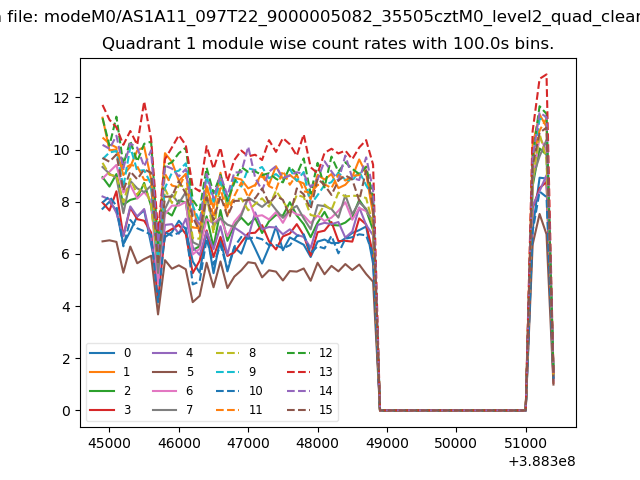
| Module-wise count rates for Quadrant A Data is divided into 100 sec bins |
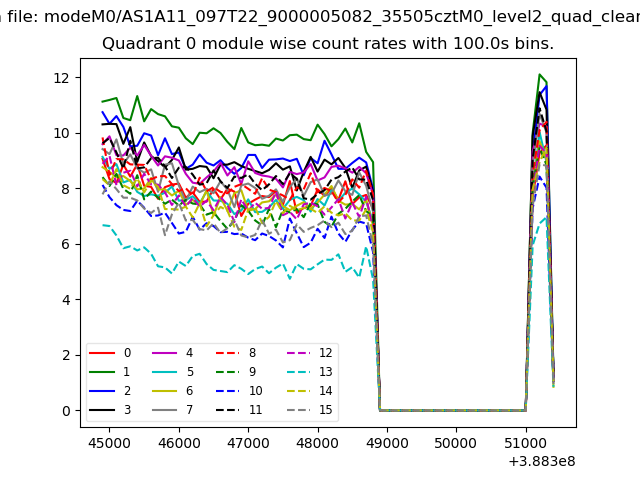 |
 |
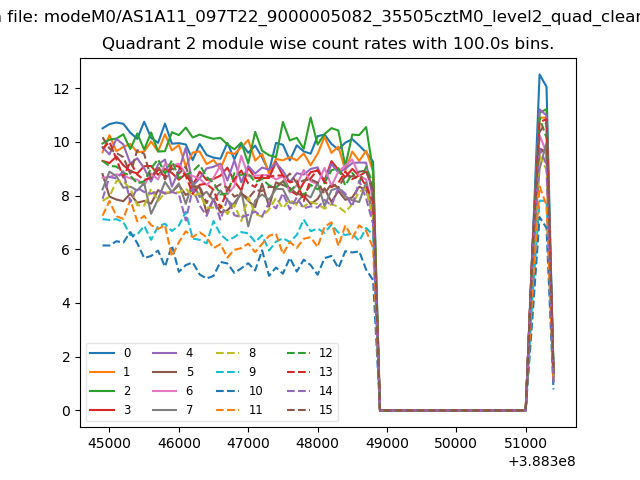
| Module-wise count rates for Quadrant B Data is divided into 100 sec bins |
 |
 |
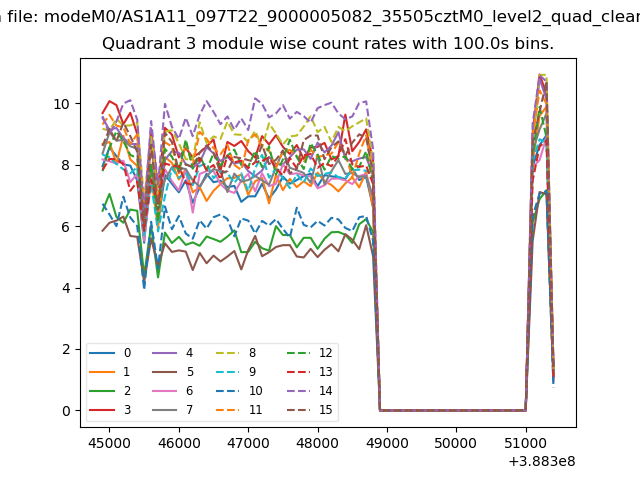
| Module-wise count rates for Quadrant C Data is divided into 100 sec bins |
 |
 |
| Module-wise count rates for Quadrant D Data is divided into 100 sec bins |
 |
 |
| Parameter | Plot |
|---|---|
| CZT HV Monitor |  |
| D_VDD | 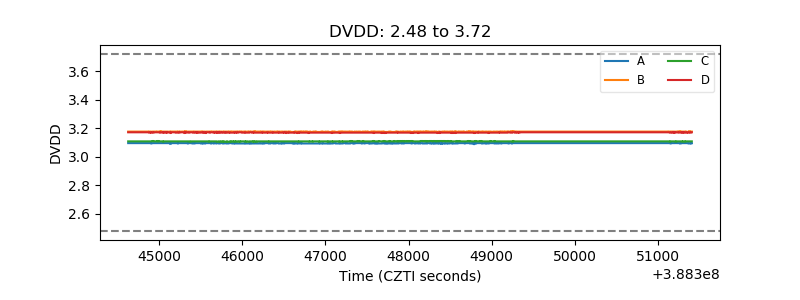 |
| Temperature 1 | 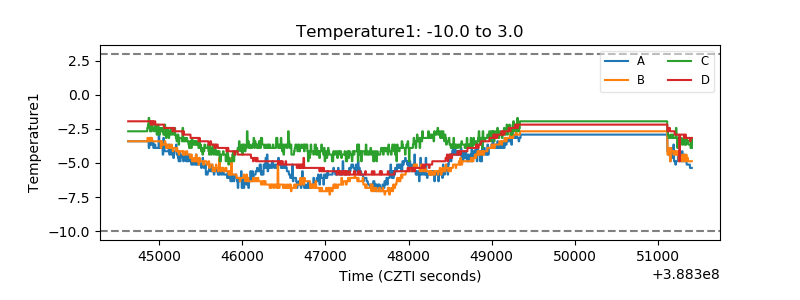 |
| Veto HV Monitor | 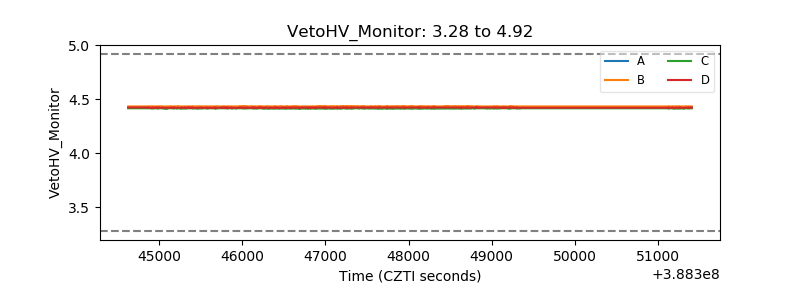 |
| Veto LLD | 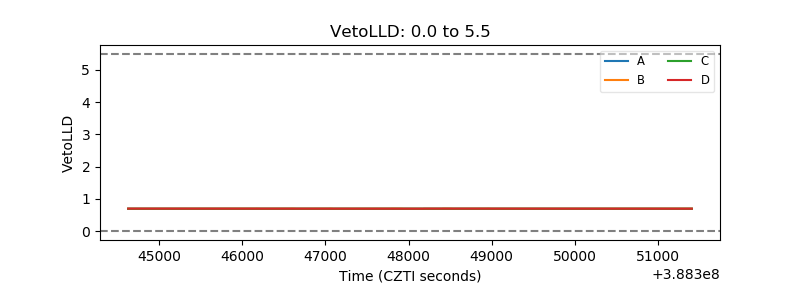 |
| Alpha Counter | 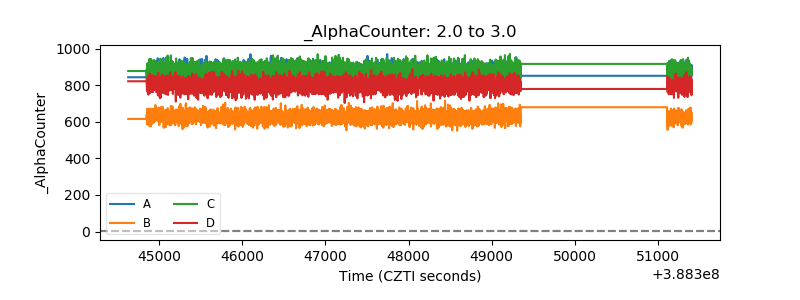 |
| _CPM_Rate | 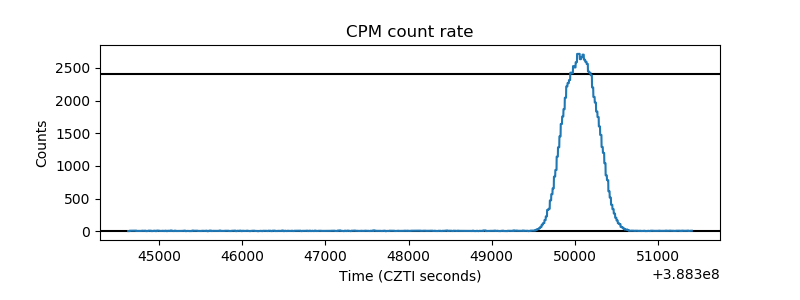 |
| CZT Counter | 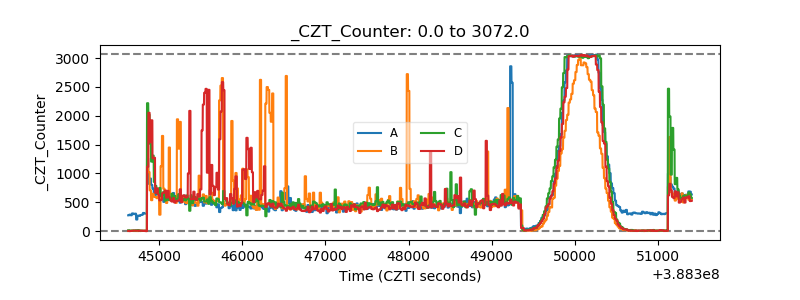 |
| +2.5 Volts monitor | 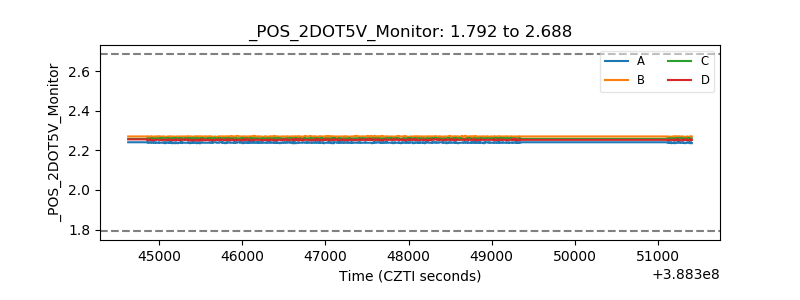 |
| +5 Volts monitor | 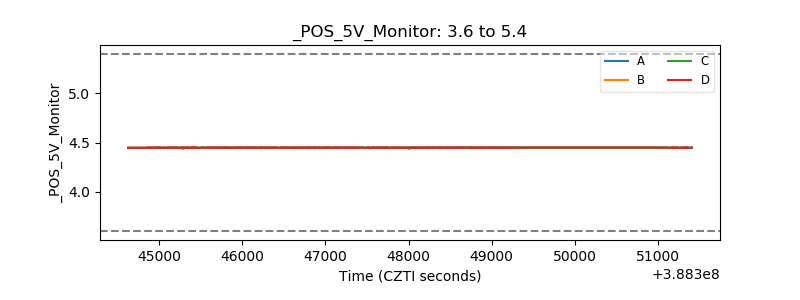 |
| _ROLL_ROT | 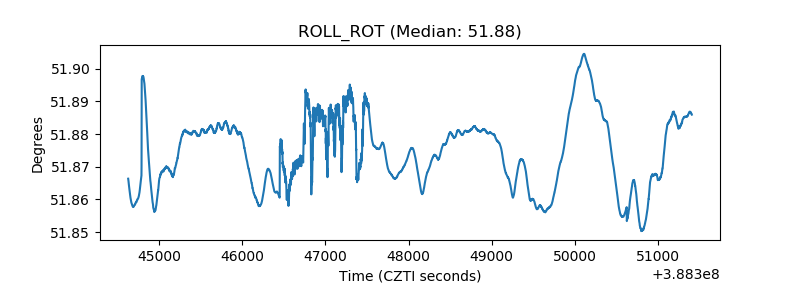 |
| _Roll_DEC | 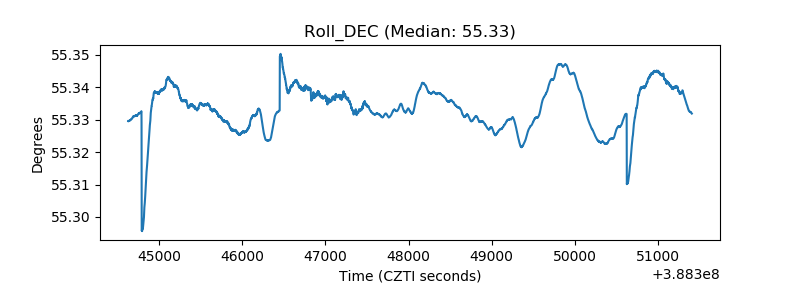 |
| _Roll_RA | 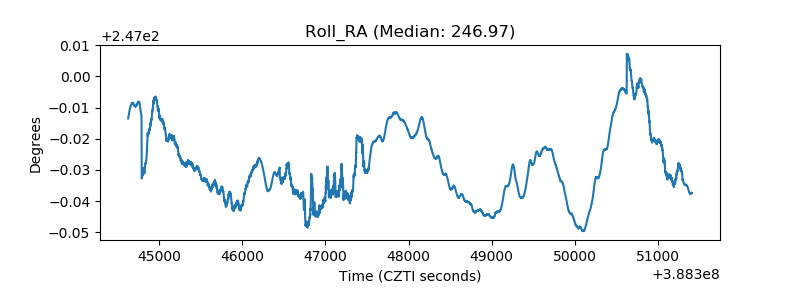 |
| Veto Counter | 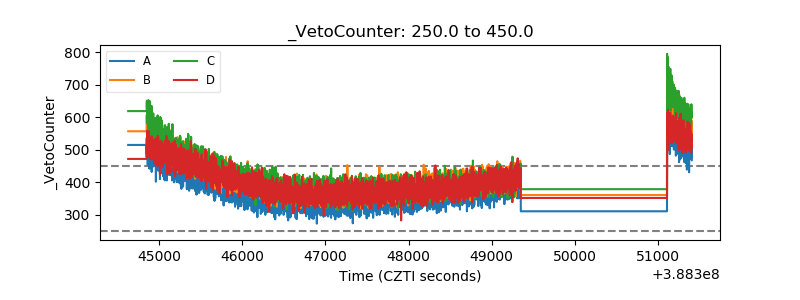 |