| Param | Original file | Final file |
|---|---|---|
| Filename | modeM0/AS1A11_097T22_9000005082_35498cztM0_level2.evt | modeM0/AS1A11_097T22_9000005082_35498cztM0_level2_quad_clean.evt |
| Size (bytes) | 514,108,800 | 68,086,080 |
| Size | 490.3 MB | 64.9 MB |
| Events in quadrant A | 4,730,421 | 380,015 |
| Events in quadrant B | 4,313,919 | 420,748 |
| Events in quadrant C | 3,103,457 | 436,725 |
| Events in quadrant D | 3,027,802 | 417,769 |
| Mode M9 | |||
|---|---|---|---|
| Quadrant | BADHDUFLAG | Total packets | Discarded packets |
| A | 0 | 20 | 0 |
| B | 0 | 20 | 0 |
| C | 0 | 20 | 0 |
| D | 0 | 21 | 0 |
| Mode M0 | |||
|---|---|---|---|
| Quadrant | BADHDUFLAG | Total packets | Discarded packets |
| A | 0 | 17877 | 3 |
| B | 0 | 16616 | 2 |
| C | 0 | 12595 | 2 |
| D | 0 | 12952 | 2 |
| Mode SS | |||
|---|---|---|---|
| Quadrant | BADHDUFLAG | Total packets | Discarded packets |
| A | 0 | 116 | 0 |
| B | 0 | 116 | 0 |
| C | 0 | 116 | 0 |
| D | 0 | 116 | 0 |
| Quadrant | Total seconds | Saturated seconds | Saturation percentage |
|---|---|---|---|
| A | 5808 | 732 | 12.603306% |
| B | 5808 | 549 | 9.452479% |
| C | 5808 | 62 | 1.067493% |
| D | 5808 | 83 | 1.429063% |
Noise dominated data is calculated using 1-second bins in cleaned event files. If a bin has >2000 counts, and if more than 50% of those come from <1% of pixels, then it is considered to be noise-dominated and hence unusable.
| Quadrant | # 1 sec bins | Bins with >0 counts | Bins with >2000 counts | High rate bins dominated by noise | Noise dominated (total time) | Noise dominated (detector-on time) | Marked lightcurve |
|---|---|---|---|---|---|---|---|
| A | 7181 | 5809 | 663 | 663 | 9.23% | 11.41% | 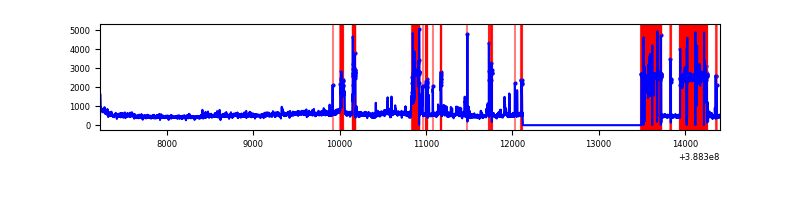 |
| B | 7181 | 5809 | 399 | 399 | 5.56% | 6.87% | 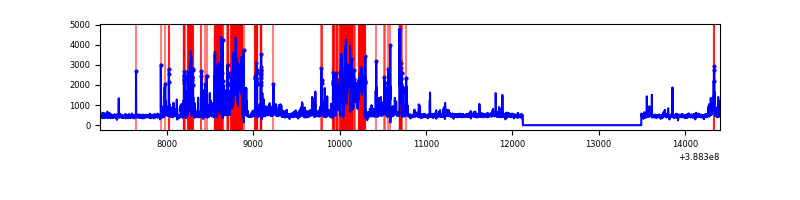 |
| C | 7181 | 5809 | 52 | 52 | 0.72% | 0.90% | 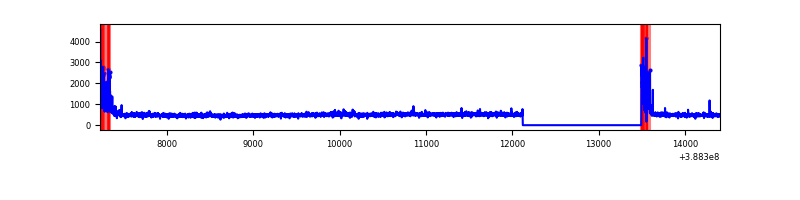 |
| D | 7181 | 5809 | 76 | 76 | 1.06% | 1.31% | 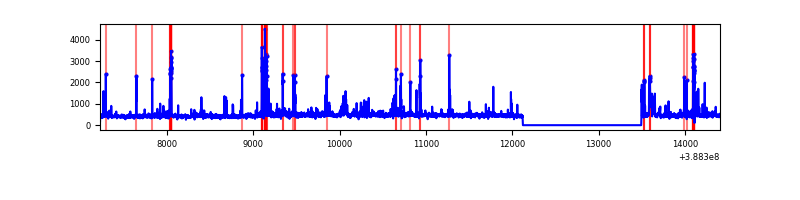 |
Top three noisy pixels from each quadrant. If the there are fewer than three noisy pixels in the level2.evt file, extra rows are filled as -1
| Pixel properties | Quadrant properties | ||||||
|---|---|---|---|---|---|---|---|
| Quadrant | DetID | PixID | Counts | Sigma | Mean | Median | Sigma |
| A | 15 | 169 | 2326867 | 19401.64 | 594 | 582 | 119.9 |
| A | 10 | 83 | 104290 | 864.94 | 594 | 582 | 119.9 |
| A | 13 | 254 | 7550 | 58.11 | 594 | 582 | 119.9 |
| B | 5 | 236 | 1169295 | 9541.2 | 635 | 617 | 122.5 |
| B | 5 | 172 | 470137 | 3833.21 | 635 | 617 | 122.5 |
| B | 0 | 219 | 100805 | 817.94 | 635 | 617 | 122.5 |
| C | 0 | 10 | 257764 | 1699.44 | 646 | 650 | 151.3 |
| C | 15 | 214 | 244564 | 1612.19 | 646 | 650 | 151.3 |
| C | 14 | 67 | 38283 | 248.74 | 646 | 650 | 151.3 |
| D | 7 | 80 | 135487 | 860.86 | 641 | 623 | 156.7 |
| D | 13 | 249 | 95720 | 607.02 | 641 | 623 | 156.7 |
| D | 7 | 223 | 88906 | 563.53 | 641 | 623 | 156.7 |
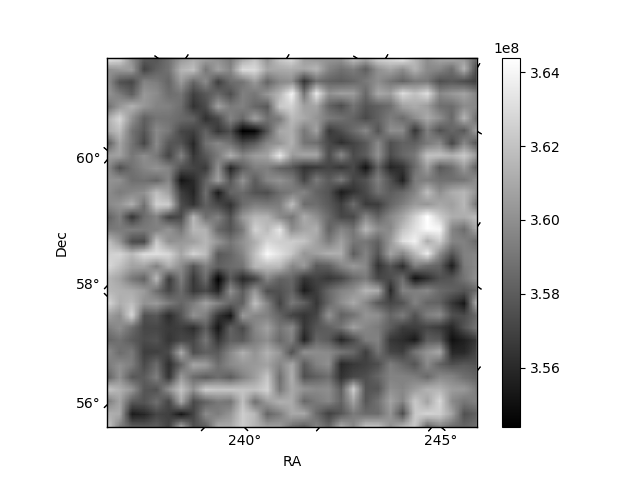
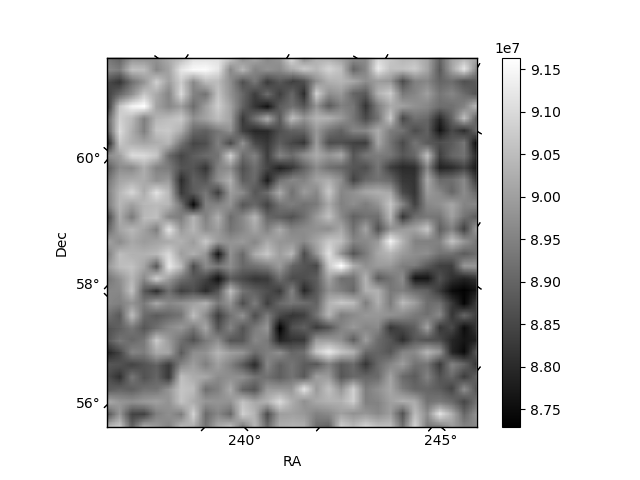
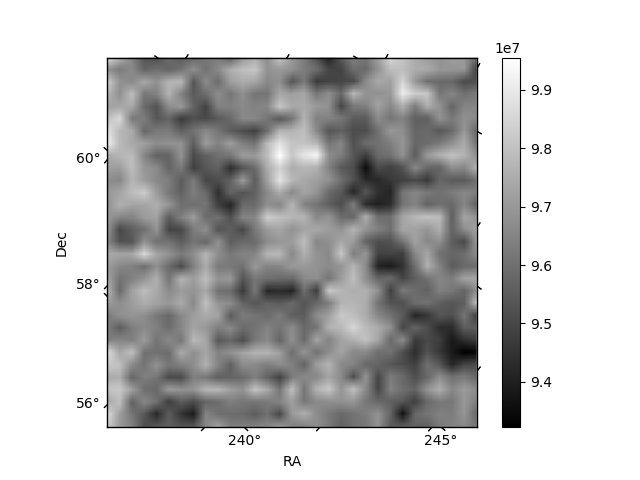
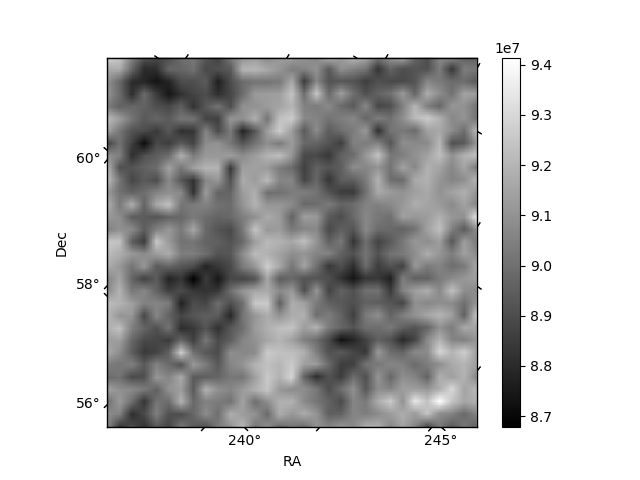
Histogram calculated using DETX and DETY for each event in the final _common_clean file
| Quadrant A | 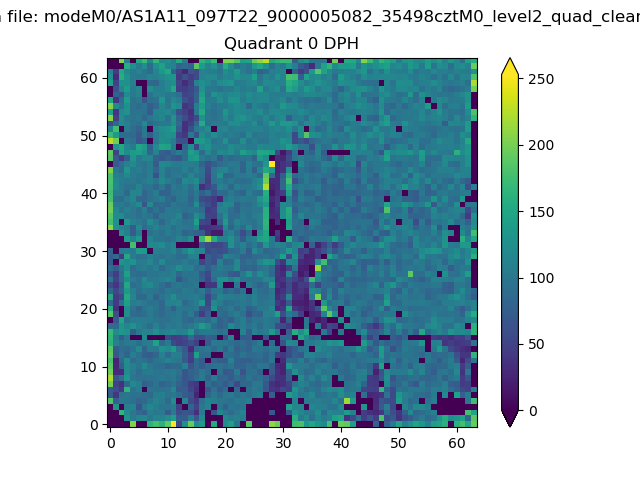 |
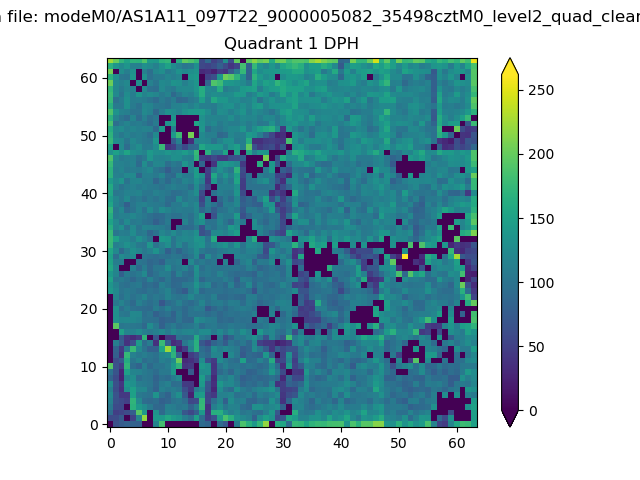 |
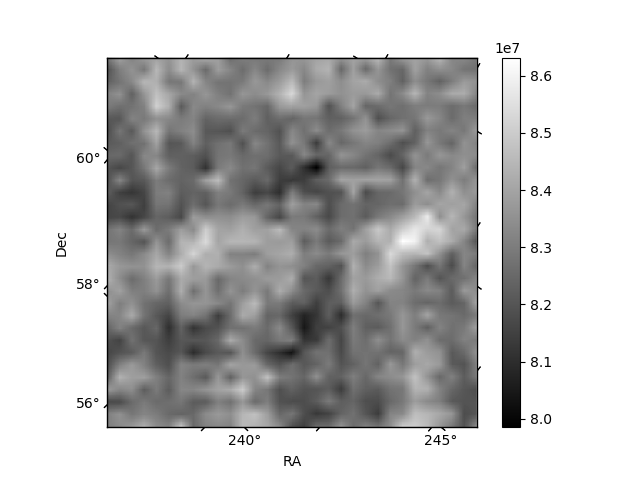
Quadrant B |
|---|---|---|---|
| Quadrant D | 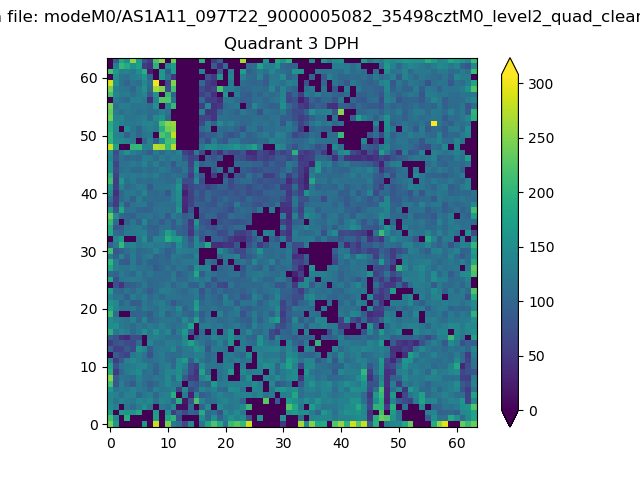 |
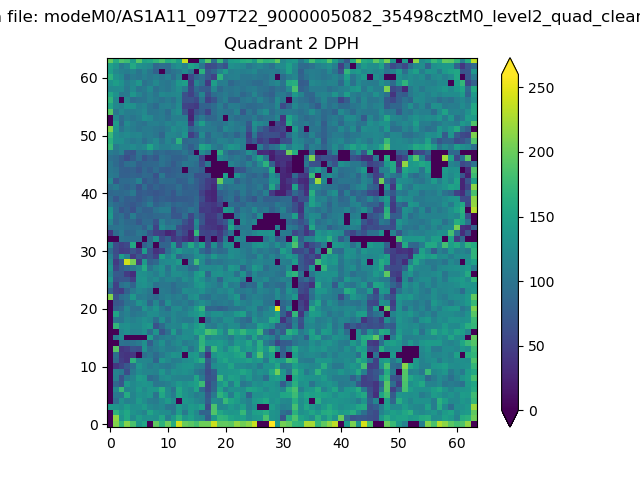 |
Quadrant C |
| Plot type | Count rate plots | Images |
|---|---|---|
| Comparison with Poisson distribution Blue bars denote a histogram of data divided into 1 sec bins. Red curve is a Poisson curve with rate = median count rate of data. |
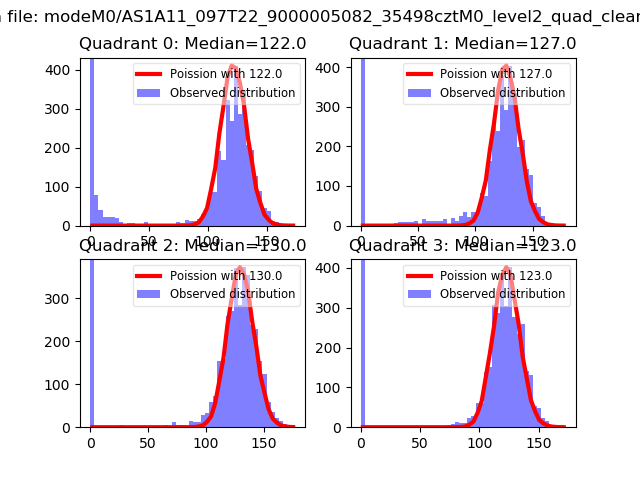 |
 |
| Quadrant-wise count rates Data is divided into 100 sec bins |
 |
|
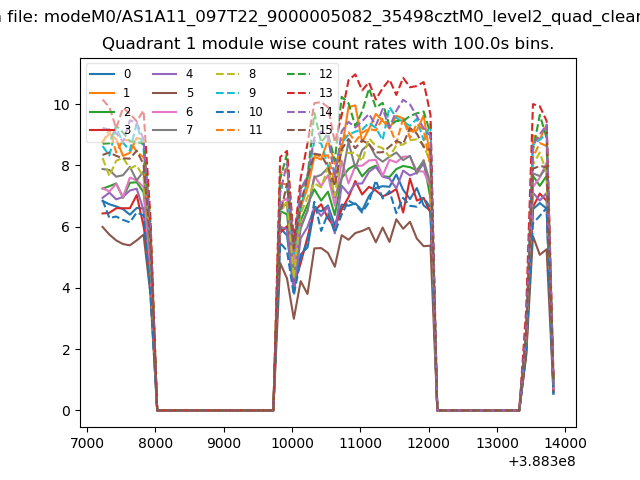
| Module-wise count rates for Quadrant A Data is divided into 100 sec bins |
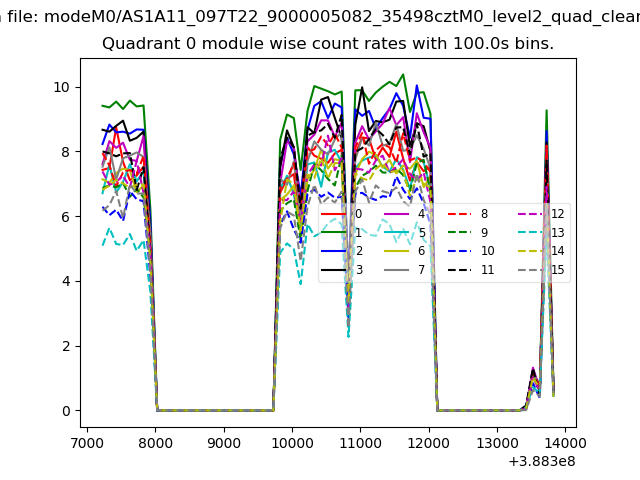 |
 |
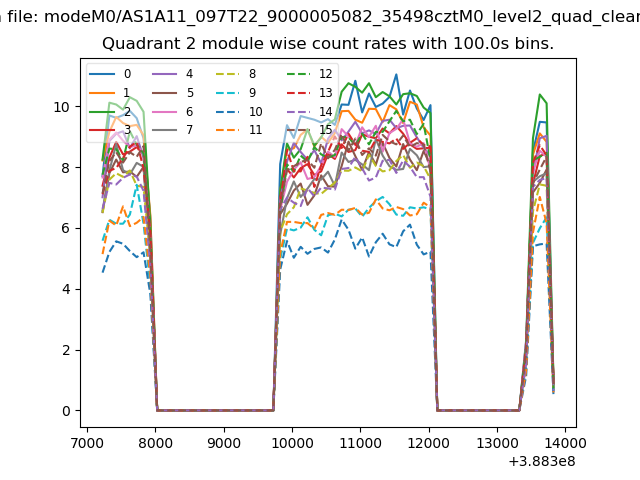
| Module-wise count rates for Quadrant B Data is divided into 100 sec bins |
 |
 |
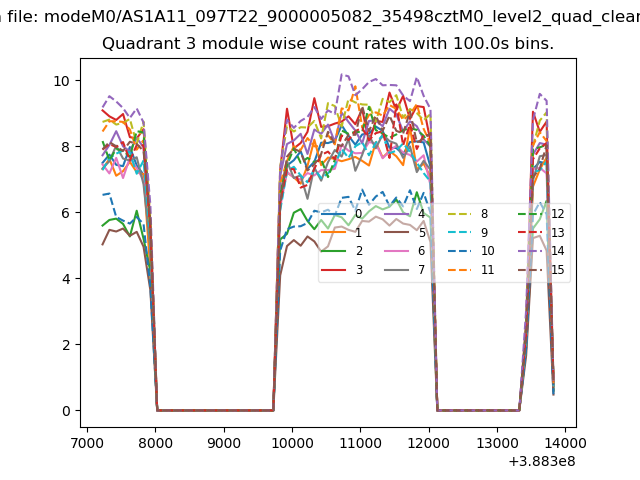
| Module-wise count rates for Quadrant C Data is divided into 100 sec bins |
 |
 |
| Module-wise count rates for Quadrant D Data is divided into 100 sec bins |
 |
 |
| Parameter | Plot |
|---|---|
| CZT HV Monitor | 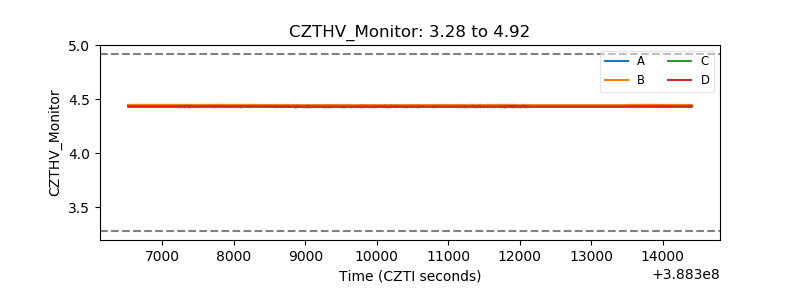 |
| D_VDD | 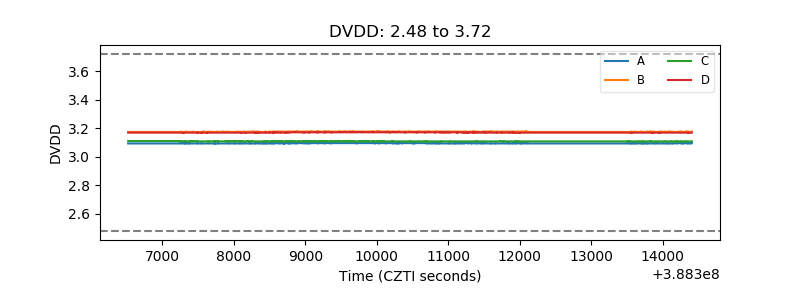 |
| Temperature 1 | 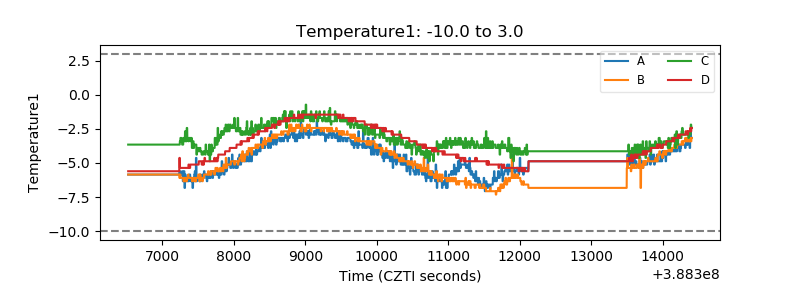 |
| Veto HV Monitor | 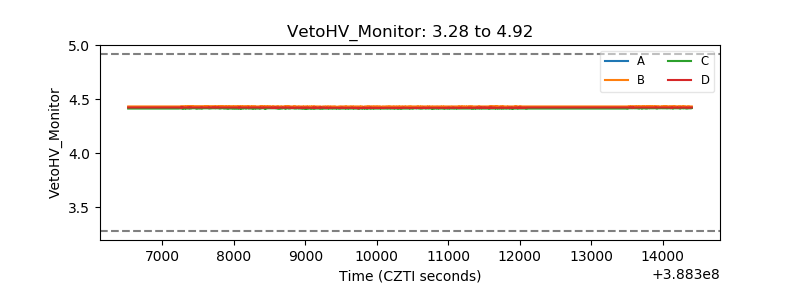 |
| Veto LLD | 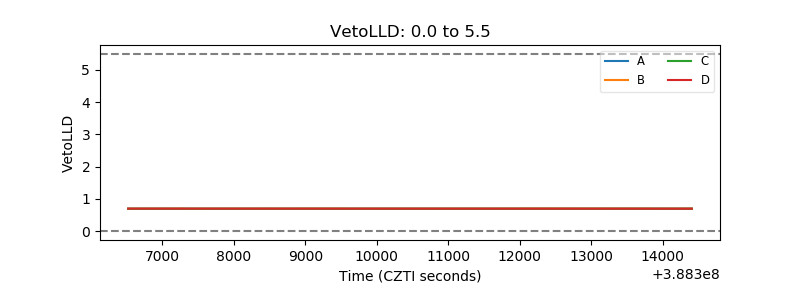 |
| Alpha Counter | 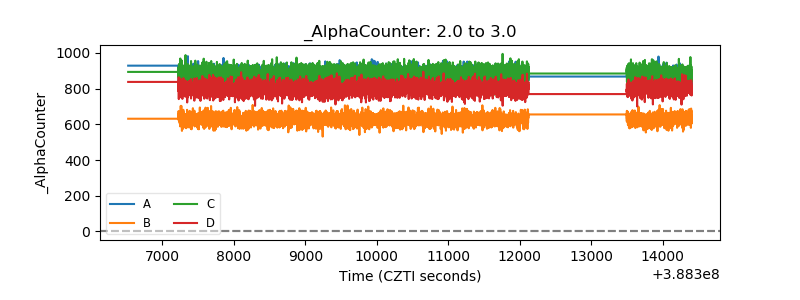 |
| _CPM_Rate | 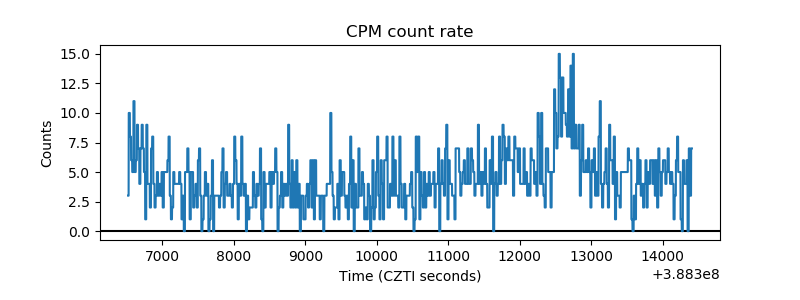 |
| CZT Counter | 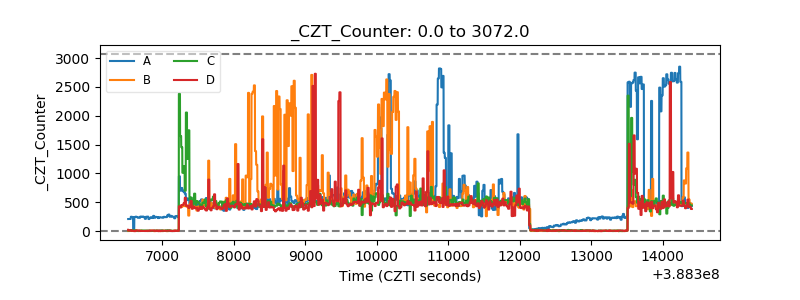 |
| +2.5 Volts monitor | 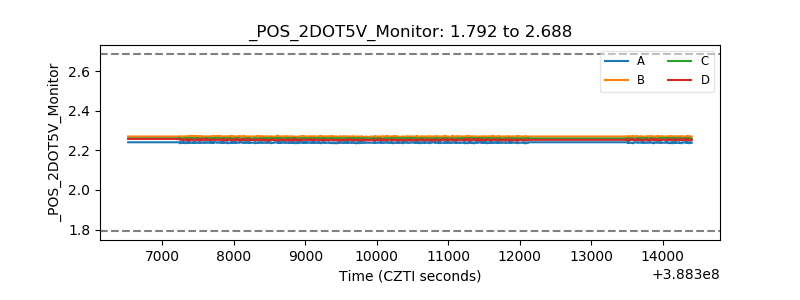 |
| +5 Volts monitor | 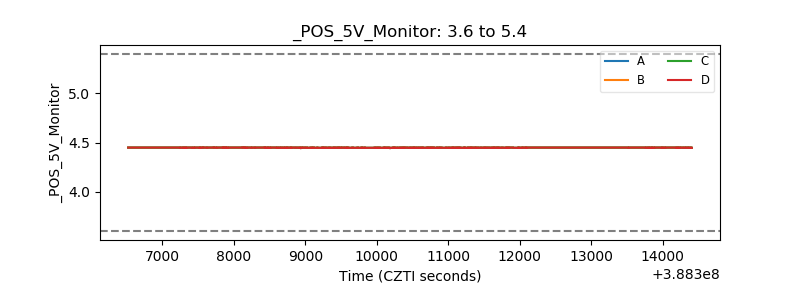 |
| _ROLL_ROT | 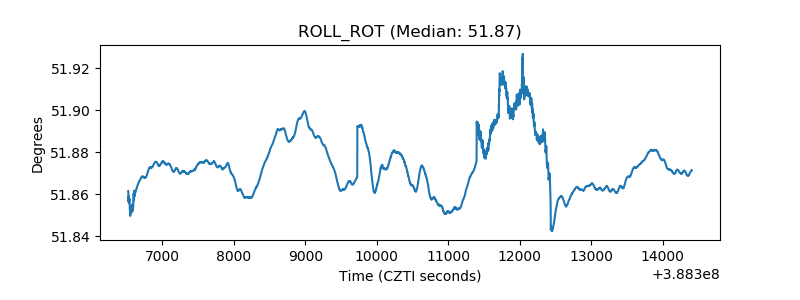 |
| _Roll_DEC | 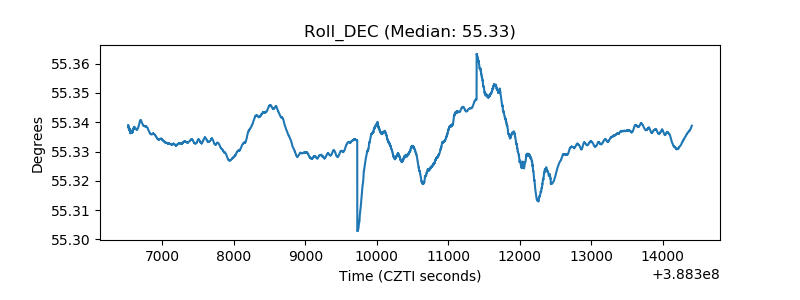 |
| _Roll_RA | 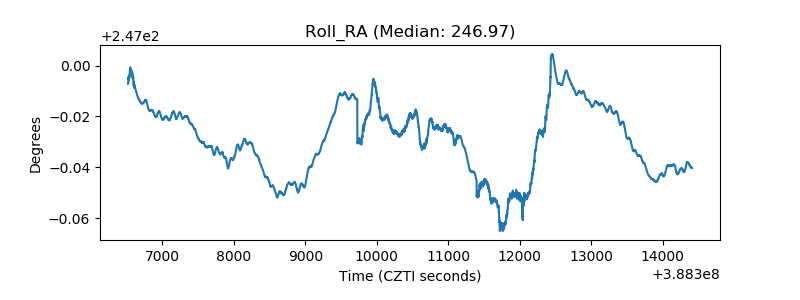 |
| Veto Counter | 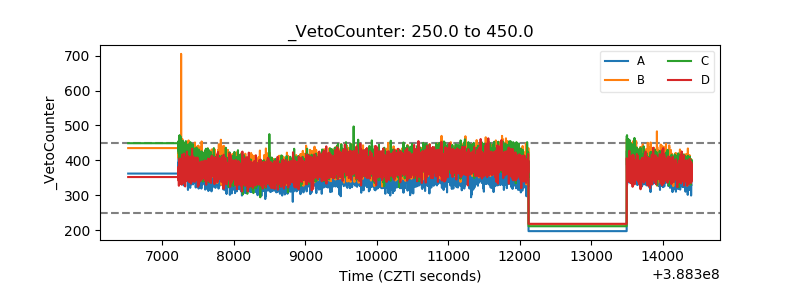 |