| Param | Original file | Final file |
|---|---|---|
| Filename | modeM0/AS1A11_097T22_9000005082_35494cztM0_level2.evt | modeM0/AS1A11_097T22_9000005082_35494cztM0_level2_quad_clean.evt |
| Size (bytes) | 427,213,440 | 71,732,160 |
| Size | 407.4 MB | 68.4 MB |
| Events in quadrant A | 2,659,848 | 444,209 |
| Events in quadrant B | 3,228,217 | 476,486 |
| Events in quadrant C | 3,581,932 | 463,283 |
| Events in quadrant D | 3,137,005 | 445,927 |
| Mode M9 | |||
|---|---|---|---|
| Quadrant | BADHDUFLAG | Total packets | Discarded packets |
| A | 0 | 37 | 0 |
| B | 0 | 37 | 0 |
| C | 0 | 37 | 0 |
| D | 0 | 38 | 0 |
| Mode M0 | |||
|---|---|---|---|
| Quadrant | BADHDUFLAG | Total packets | Discarded packets |
| A | 0 | 10793 | 3 |
| B | 0 | 12731 | 2 |
| C | 0 | 13714 | 2 |
| D | 0 | 12762 | 2 |
| Mode SS | |||
|---|---|---|---|
| Quadrant | BADHDUFLAG | Total packets | Discarded packets |
| A | 0 | 98 | 0 |
| B | 0 | 98 | 0 |
| C | 0 | 98 | 0 |
| D | 0 | 98 | 0 |
| Quadrant | Total seconds | Saturated seconds | Saturation percentage |
|---|---|---|---|
| A | 4881 | 78 | 1.598033% |
| B | 4881 | 253 | 5.183364% |
| C | 4881 | 263 | 5.388240% |
| D | 4881 | 196 | 4.015571% |
Noise dominated data is calculated using 1-second bins in cleaned event files. If a bin has >2000 counts, and if more than 50% of those come from <1% of pixels, then it is considered to be noise-dominated and hence unusable.
| Quadrant | # 1 sec bins | Bins with >0 counts | Bins with >2000 counts | High rate bins dominated by noise | Noise dominated (total time) | Noise dominated (detector-on time) | Marked lightcurve |
|---|---|---|---|---|---|---|---|
| A | 7033 | 4882 | 18 | 18 | 0.26% | 0.37% | 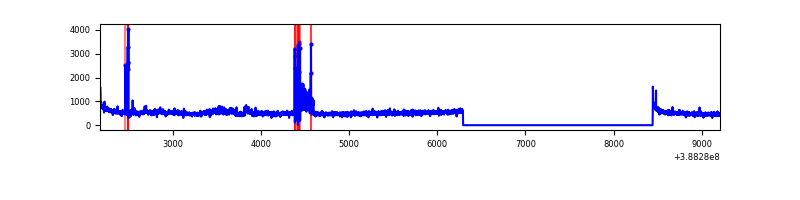 |
| B | 7033 | 4882 | 131 | 131 | 1.86% | 2.68% | 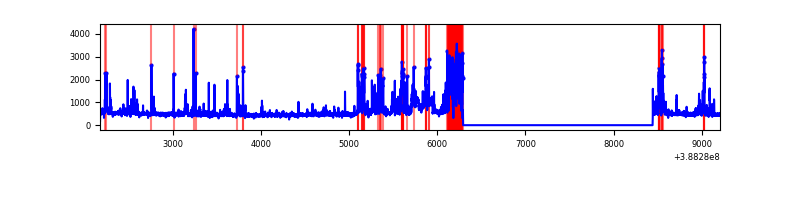 |
| C | 7033 | 4882 | 195 | 195 | 2.77% | 3.99% | 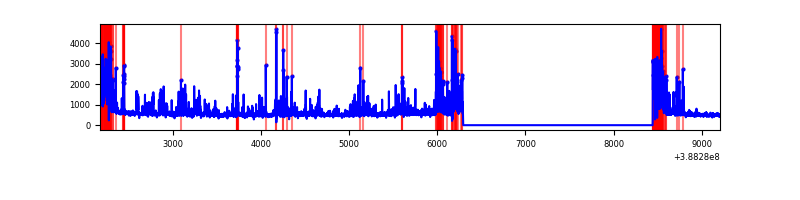 |
| D | 7033 | 4882 | 169 | 169 | 2.40% | 3.46% | 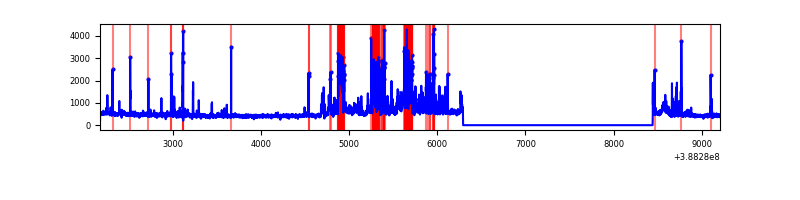 |
Top three noisy pixels from each quadrant. If the there are fewer than three noisy pixels in the level2.evt file, extra rows are filled as -1
| Pixel properties | Quadrant properties | ||||||
|---|---|---|---|---|---|---|---|
| Quadrant | DetID | PixID | Counts | Sigma | Mean | Median | Sigma |
| A | 15 | 169 | 298646 | 2613.51 | 576 | 567 | 114.1 |
| A | 10 | 83 | 126110 | 1100.74 | 576 | 567 | 114.1 |
| A | 13 | 254 | 7499 | 60.78 | 576 | 567 | 114.1 |
| B | 5 | 172 | 654773 | 6078.44 | 577 | 565 | 107.6 |
| B | 5 | 236 | 147533 | 1365.52 | 577 | 565 | 107.6 |
| B | 5 | 200 | 118706 | 1097.68 | 577 | 565 | 107.6 |
| C | 0 | 10 | 567101 | 4420.29 | 562 | 568 | 128.2 |
| C | 0 | 207 | 295146 | 2298.4 | 562 | 568 | 128.2 |
| C | 1 | 23 | 293978 | 2289.29 | 562 | 568 | 128.2 |
| D | 7 | 80 | 793589 | 6019.53 | 555 | 541 | 131.7 |
| D | 13 | 249 | 77427 | 583.59 | 555 | 541 | 131.7 |
| D | 10 | 199 | 33300 | 248.65 | 555 | 541 | 131.7 |
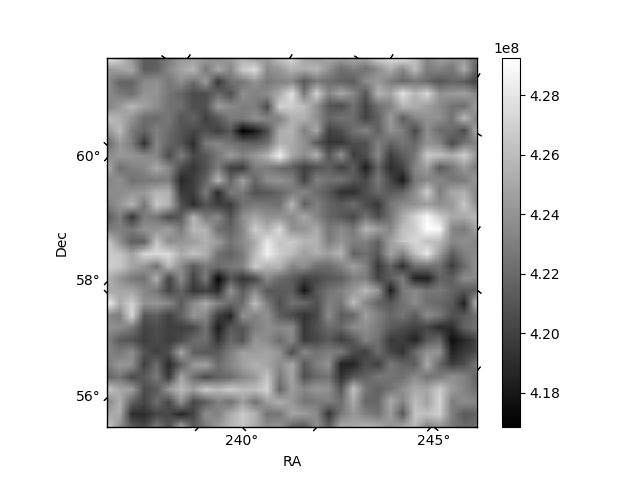
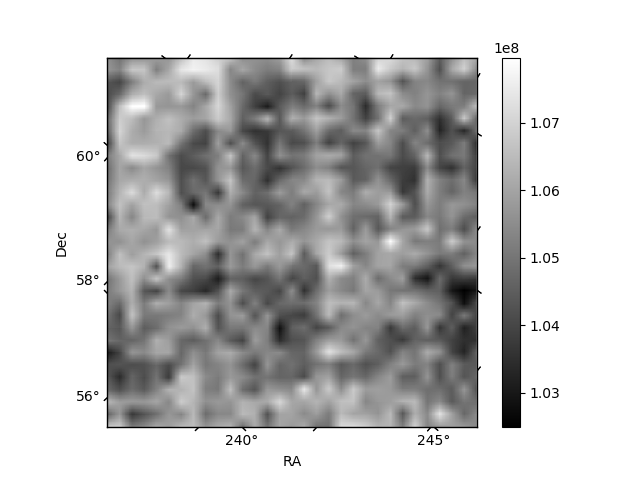
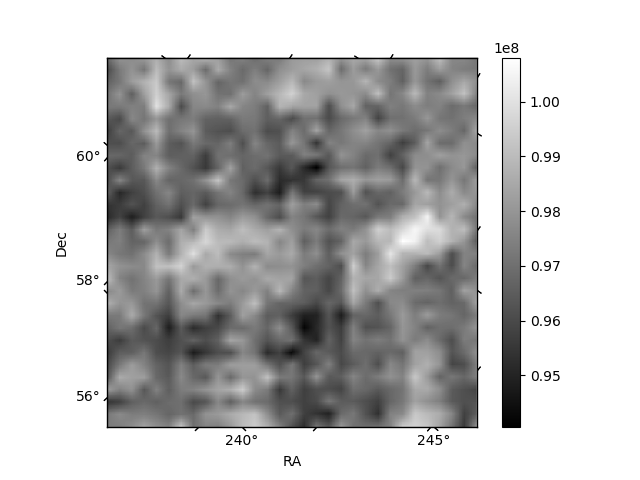
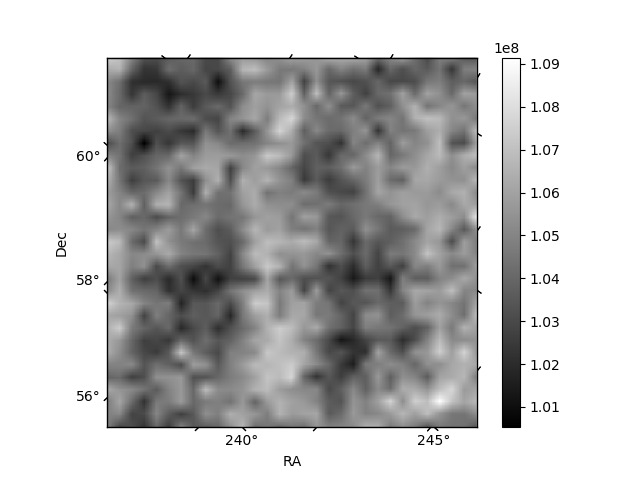
Histogram calculated using DETX and DETY for each event in the final _common_clean file
| Quadrant A | 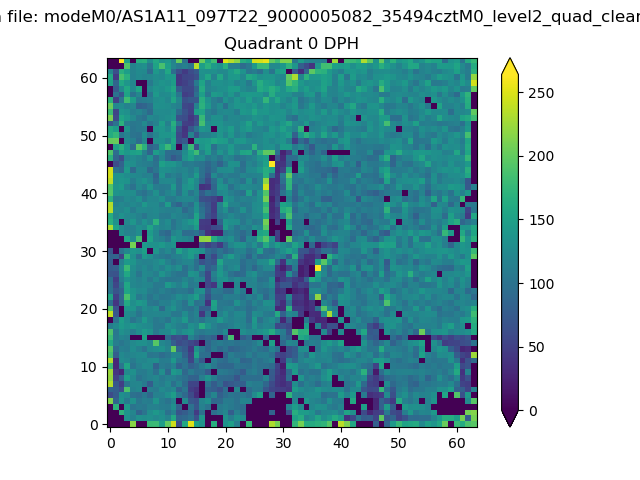 |
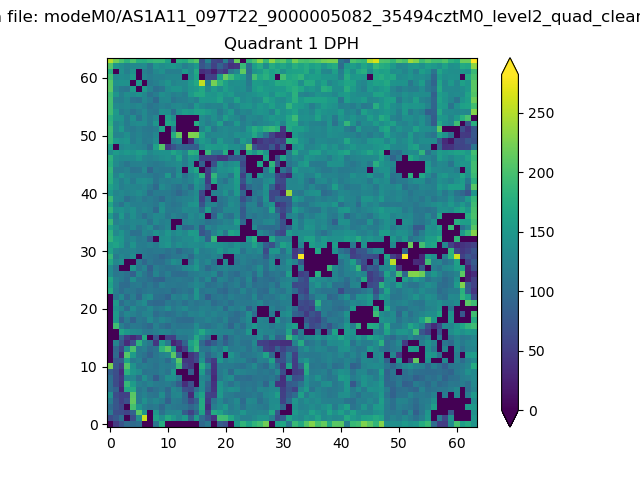 |
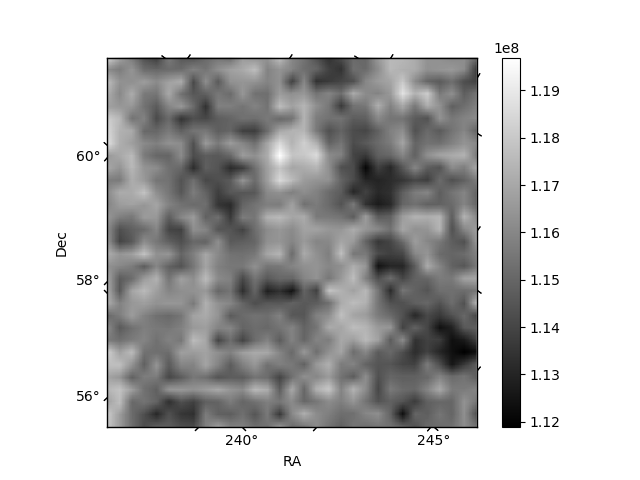
Quadrant B |
|---|---|---|---|
| Quadrant D | 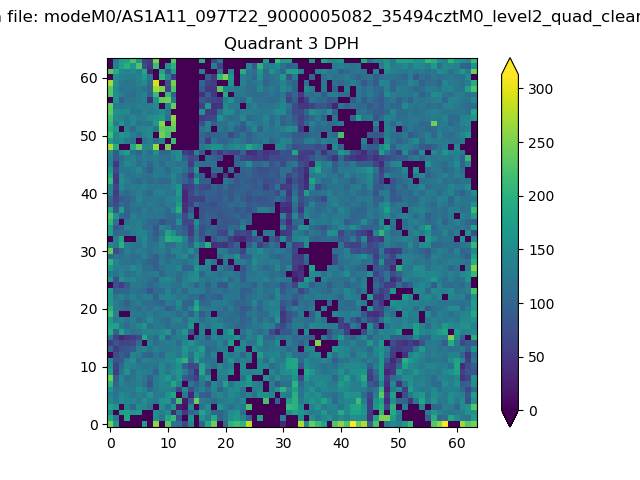 |
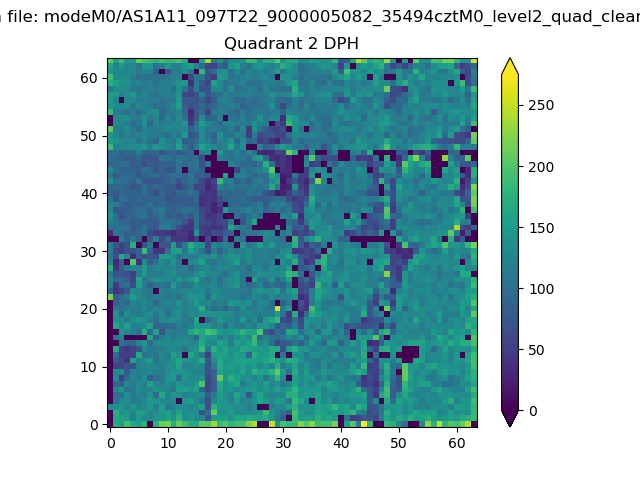 |
Quadrant C |
| Plot type | Count rate plots | Images |
|---|---|---|
| Comparison with Poisson distribution Blue bars denote a histogram of data divided into 1 sec bins. Red curve is a Poisson curve with rate = median count rate of data. |
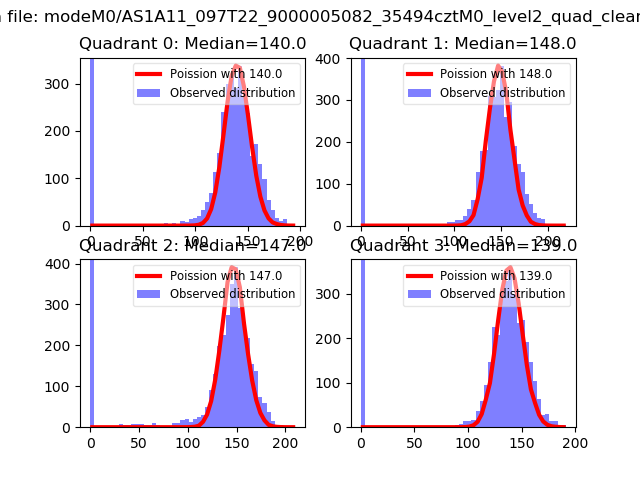 |
 |
| Quadrant-wise count rates Data is divided into 100 sec bins |
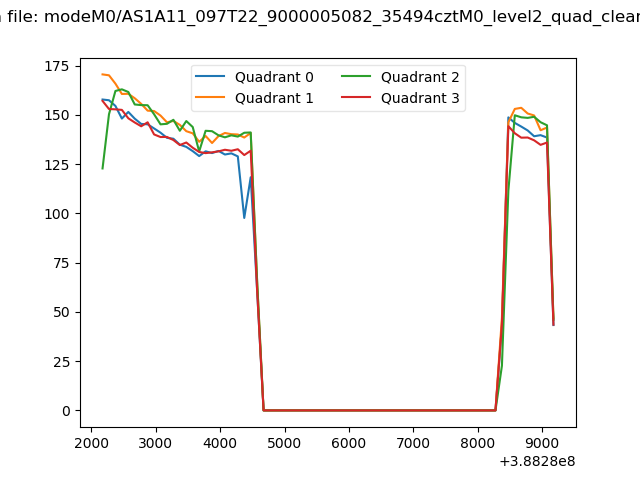 |
|
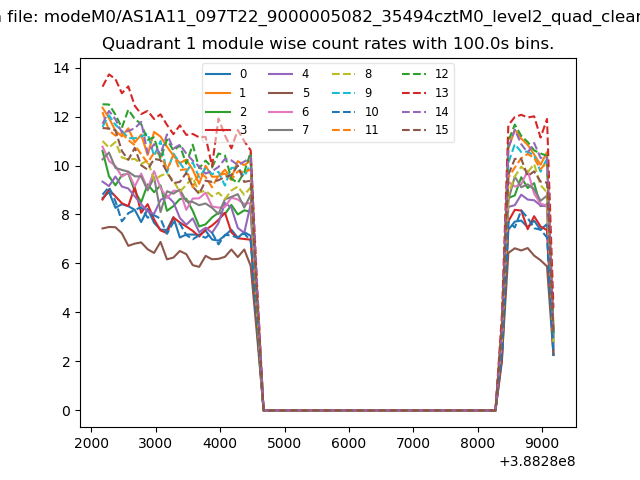
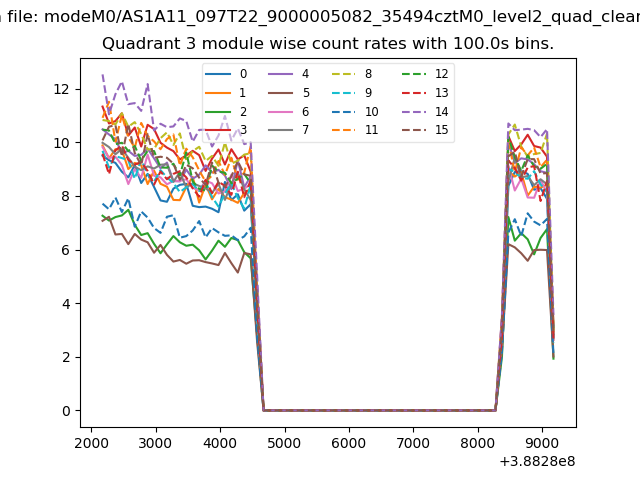
| Module-wise count rates for Quadrant A Data is divided into 100 sec bins |
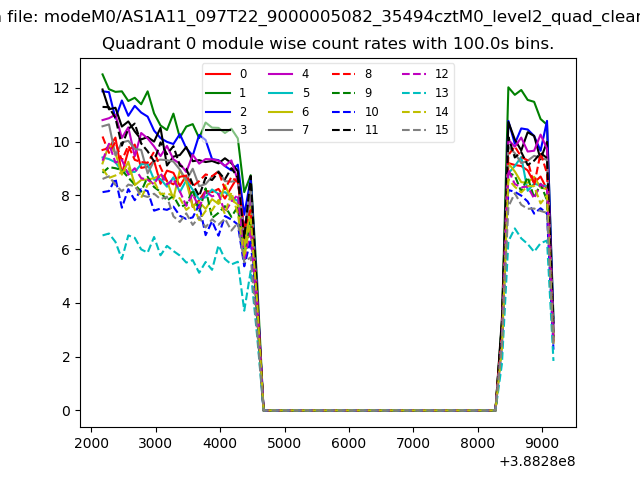 |
 |
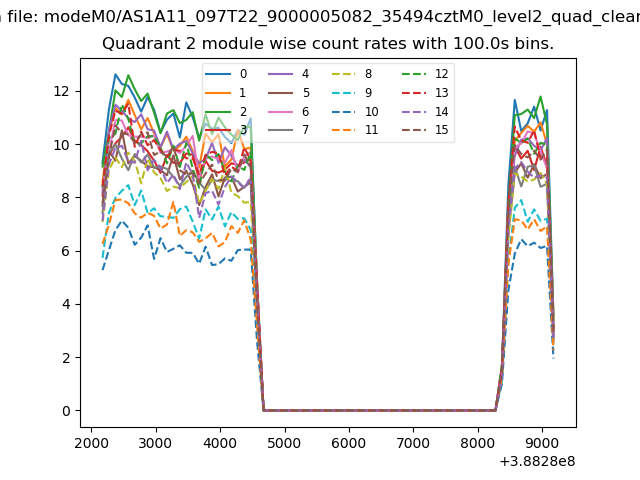
| Module-wise count rates for Quadrant B Data is divided into 100 sec bins |
 |
 |
| Module-wise count rates for Quadrant C Data is divided into 100 sec bins |
 |
 |
| Module-wise count rates for Quadrant D Data is divided into 100 sec bins |
 |
 |
| Parameter | Plot |
|---|---|
| CZT HV Monitor | 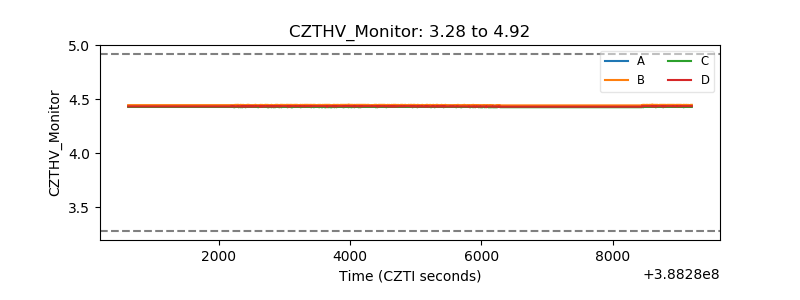 |
| D_VDD | 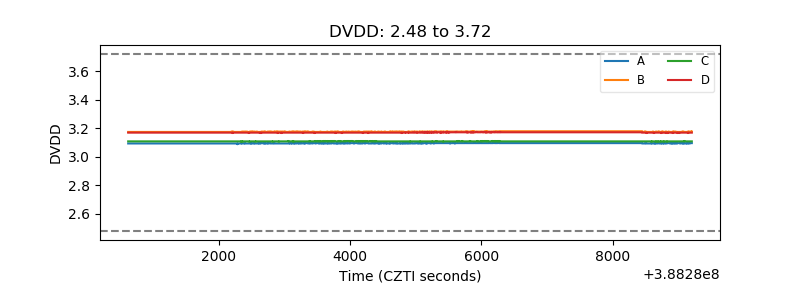 |
| Temperature 1 | 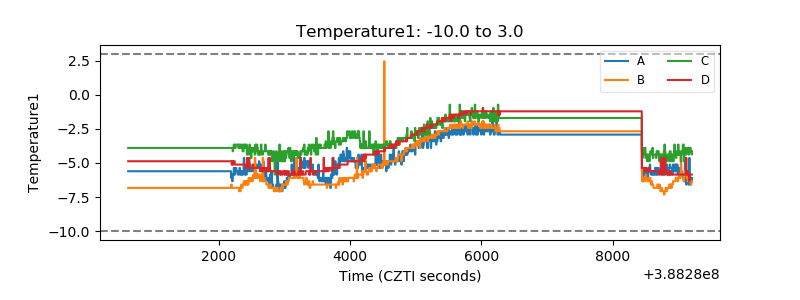 |
| Veto HV Monitor | 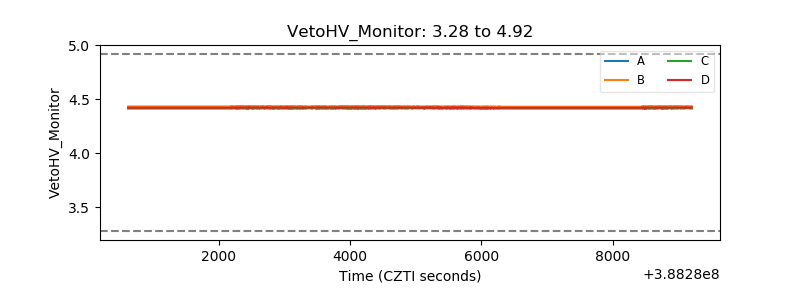 |
| Veto LLD | 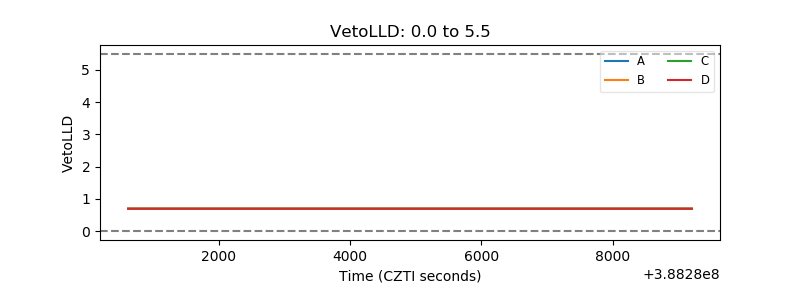 |
| Alpha Counter | 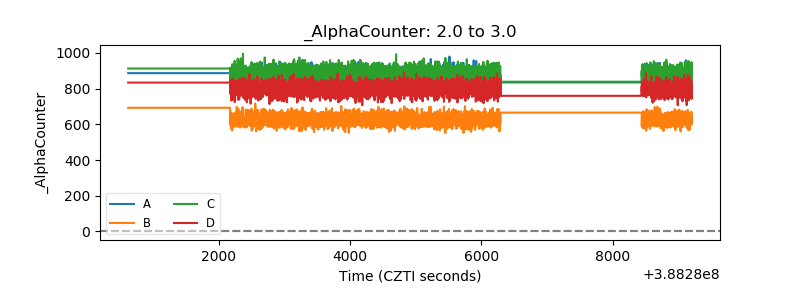 |
| _CPM_Rate | 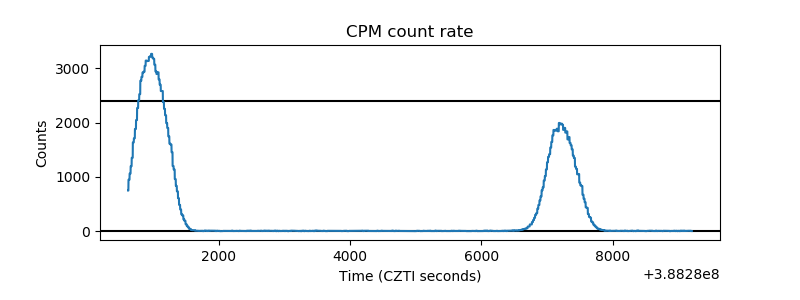 |
| CZT Counter | 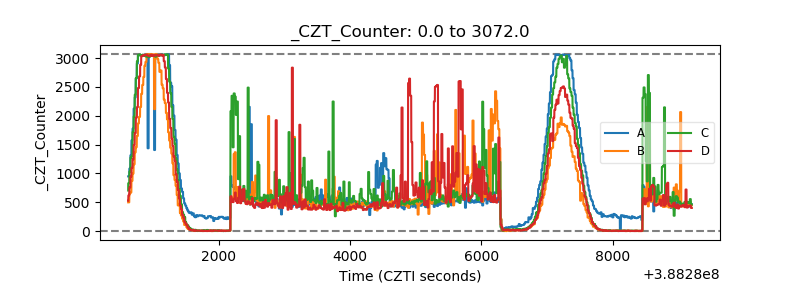 |
| +2.5 Volts monitor | 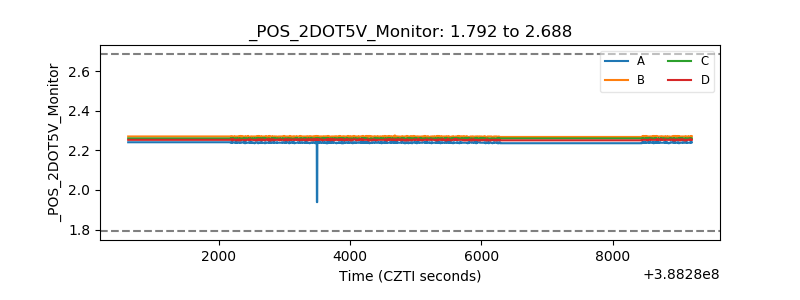 |
| +5 Volts monitor | 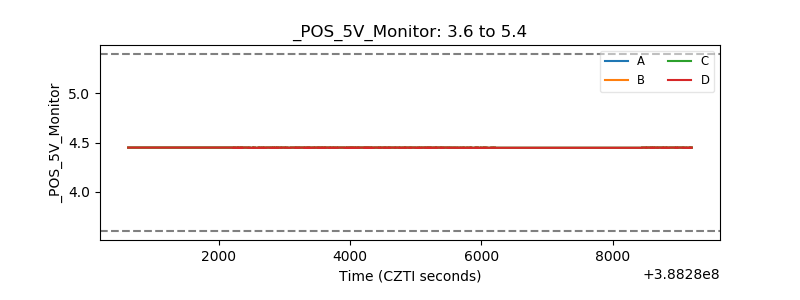 |
| _ROLL_ROT | 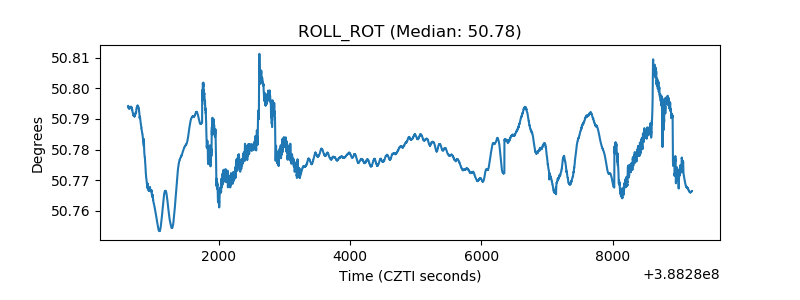 |
| _Roll_DEC | 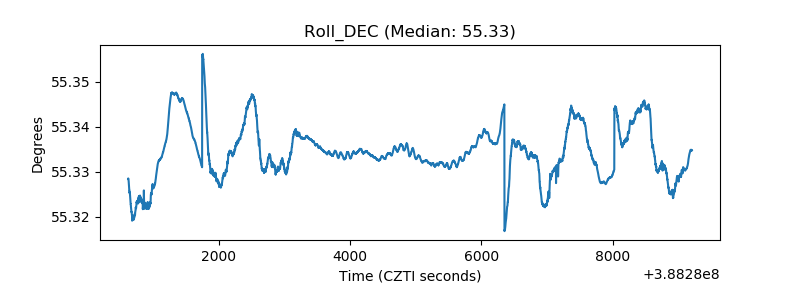 |
| _Roll_RA | 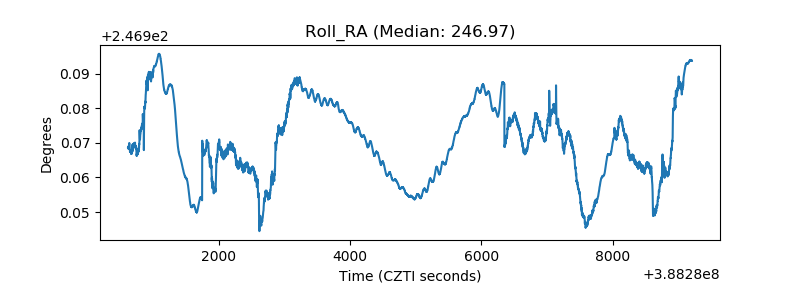 |
| Veto Counter | 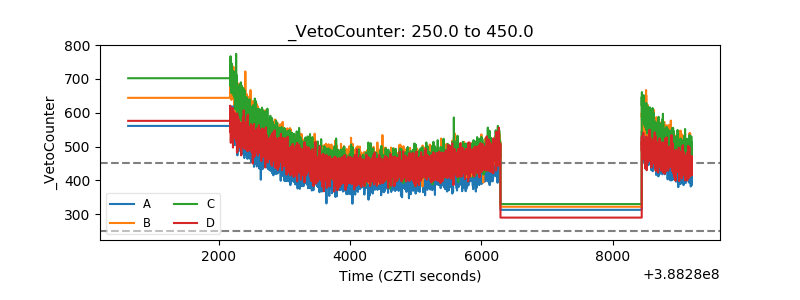 |