| Param | Original file | Final file |
|---|---|---|
| Filename | modeM0/AS1A11_097T22_9000005082_35487cztM0_level2.evt | modeM0/AS1A11_097T22_9000005082_35487cztM0_level2_quad_clean.evt |
| Size (bytes) | 141,505,920 | 22,164,480 |
| Size | 135.0 MB | 21.1 MB |
| Events in quadrant A | 923,532 | 137,351 |
| Events in quadrant B | 1,270,479 | 139,868 |
| Events in quadrant C | 1,022,050 | 137,938 |
| Events in quadrant D | 954,490 | 133,721 |
| Mode M9 | |||
|---|---|---|---|
| Quadrant | BADHDUFLAG | Total packets | Discarded packets |
| A | 0 | 15 | 0 |
| B | 0 | 15 | 0 |
| C | 0 | 15 | 0 |
| D | 0 | 15 | 0 |
| Mode M0 | |||
|---|---|---|---|
| Quadrant | BADHDUFLAG | Total packets | Discarded packets |
| A | 0 | 3728 | 2 |
| B | 0 | 4809 | 1 |
| C | 0 | 4010 | 1 |
| D | 0 | 3841 | 1 |
| Mode SS | |||
|---|---|---|---|
| Quadrant | BADHDUFLAG | Total packets | Discarded packets |
| A | 0 | 34 | 0 |
| B | 0 | 34 | 0 |
| C | 0 | 34 | 0 |
| D | 0 | 34 | 0 |
| Quadrant | Total seconds | Saturated seconds | Saturation percentage |
|---|---|---|---|
| A | 1659 | 29 | 1.748041% |
| B | 1659 | 169 | 10.186860% |
| C | 1659 | 38 | 2.290536% |
| D | 1659 | 8 | 0.482218% |
Noise dominated data is calculated using 1-second bins in cleaned event files. If a bin has >2000 counts, and if more than 50% of those come from <1% of pixels, then it is considered to be noise-dominated and hence unusable.
| Quadrant | # 1 sec bins | Bins with >0 counts | Bins with >2000 counts | High rate bins dominated by noise | Noise dominated (total time) | Noise dominated (detector-on time) | Marked lightcurve |
|---|---|---|---|---|---|---|---|
| A | 3121 | 1660 | 6 | 6 | 0.19% | 0.36% | 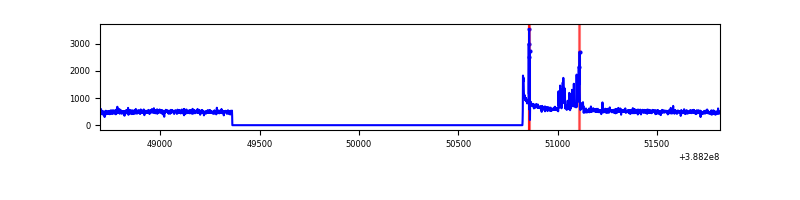 |
| B | 3121 | 1660 | 101 | 101 | 3.24% | 6.08% | 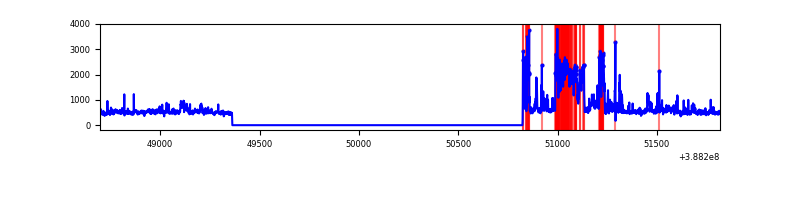 |
| C | 3121 | 1660 | 23 | 23 | 0.74% | 1.39% | 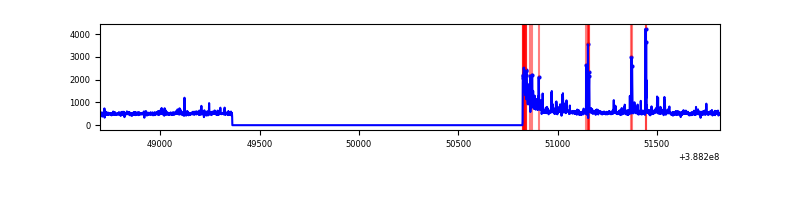 |
| D | 3121 | 1660 | 6 | 6 | 0.19% | 0.36% | 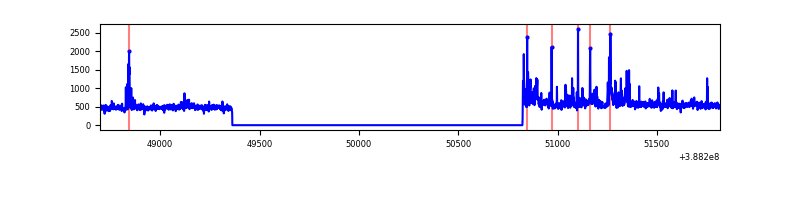 |
Top three noisy pixels from each quadrant. If the there are fewer than three noisy pixels in the level2.evt file, extra rows are filled as -1
| Pixel properties | Quadrant properties | ||||||
|---|---|---|---|---|---|---|---|
| Quadrant | DetID | PixID | Counts | Sigma | Mean | Median | Sigma |
| A | 15 | 169 | 62755 | 1415.0 | 207 | 202 | 44.2 |
| A | 10 | 83 | 56902 | 1282.6 | 207 | 202 | 44.2 |
| A | 13 | 254 | 2594 | 54.11 | 207 | 202 | 44.2 |
| B | 5 | 172 | 219906 | 5403.0 | 198 | 193 | 40.7 |
| B | 5 | 236 | 144261 | 3542.8 | 198 | 193 | 40.7 |
| B | 4 | 171 | 81865 | 2008.41 | 198 | 193 | 40.7 |
| C | 0 | 207 | 87328 | 1814.68 | 199 | 199 | 48.0 |
| C | 0 | 10 | 75766 | 1573.87 | 199 | 199 | 48.0 |
| C | 15 | 214 | 70674 | 1467.82 | 199 | 199 | 48.0 |
| D | 8 | 195 | 58767 | 1136.82 | 202 | 196 | 51.5 |
| D | 2 | 153 | 34034 | 656.77 | 202 | 196 | 51.5 |
| D | 7 | 80 | 26316 | 506.97 | 202 | 196 | 51.5 |
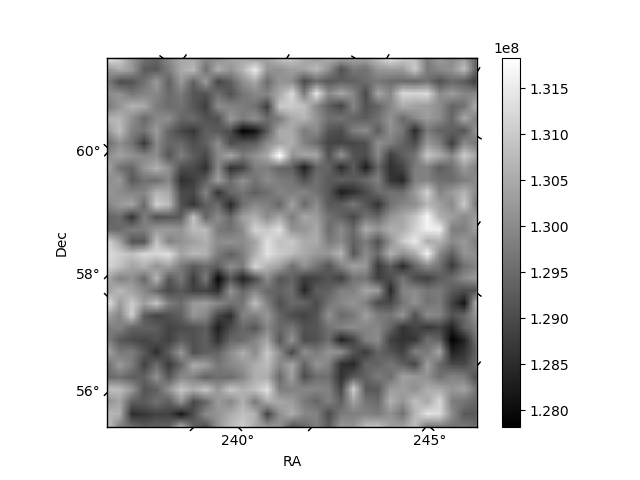
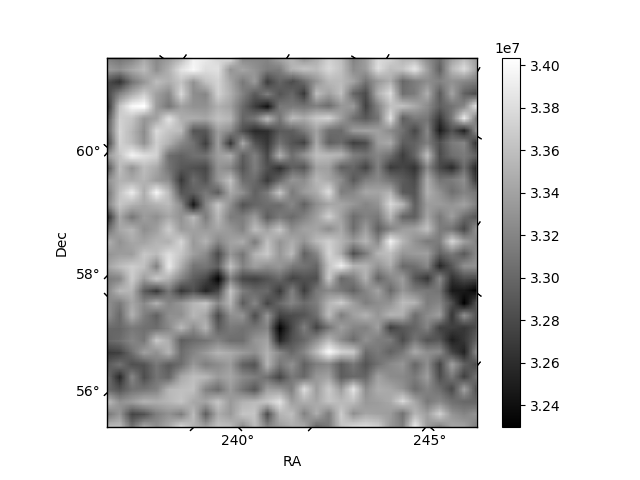
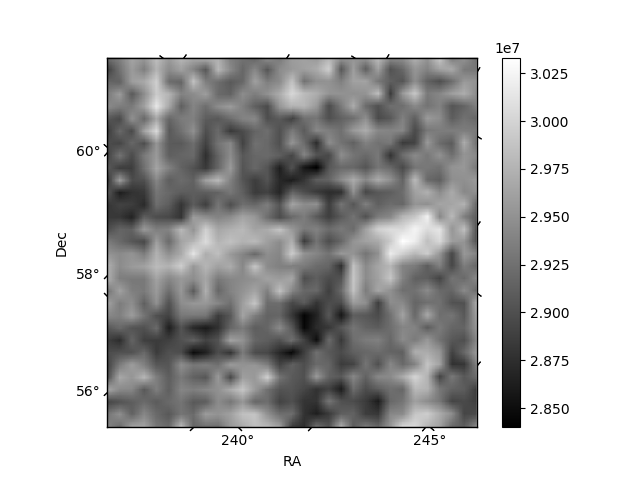
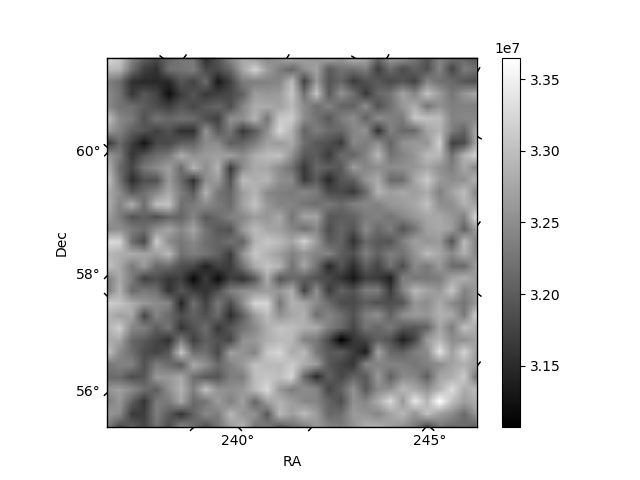
Histogram calculated using DETX and DETY for each event in the final _common_clean file
| Quadrant A | 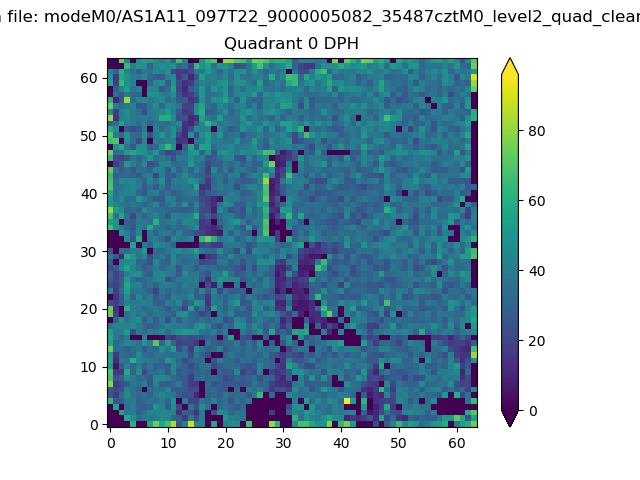 |
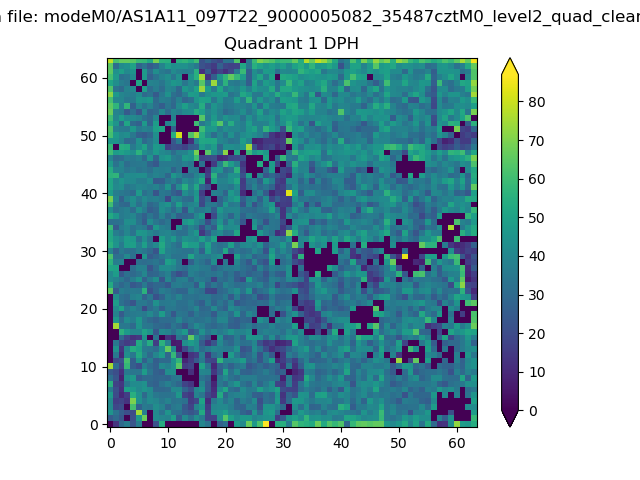 |
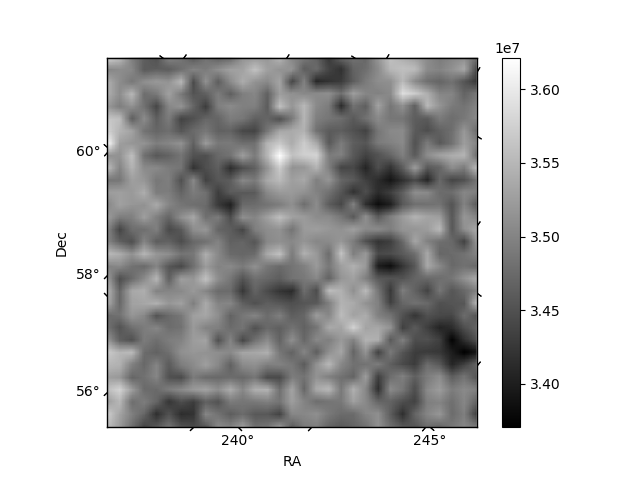
Quadrant B |
|---|---|---|---|
| Quadrant D | 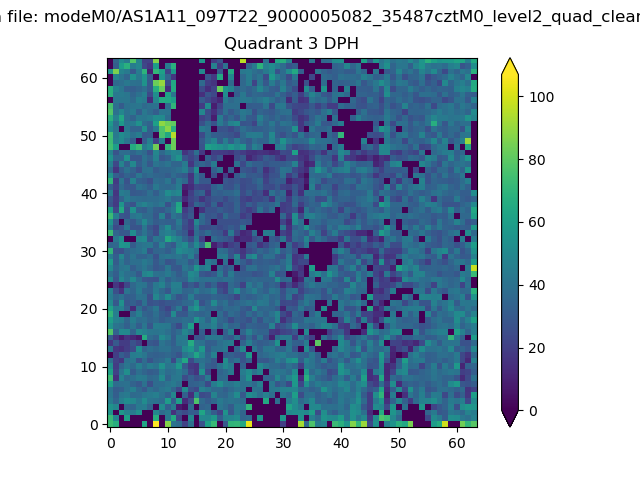 |
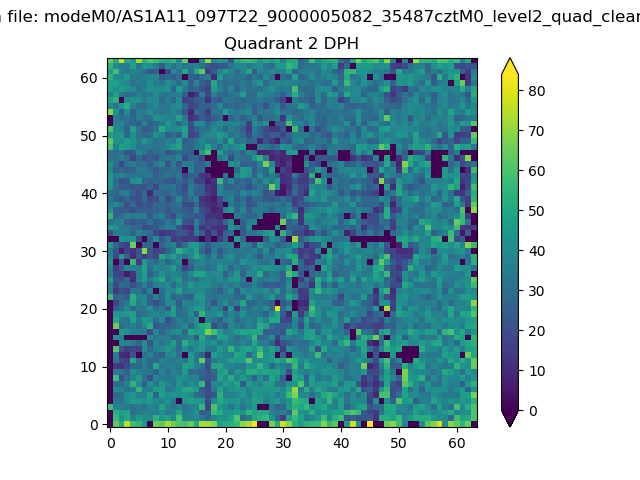 |
Quadrant C |
| Plot type | Count rate plots | Images |
|---|---|---|
| Comparison with Poisson distribution Blue bars denote a histogram of data divided into 1 sec bins. Red curve is a Poisson curve with rate = median count rate of data. |
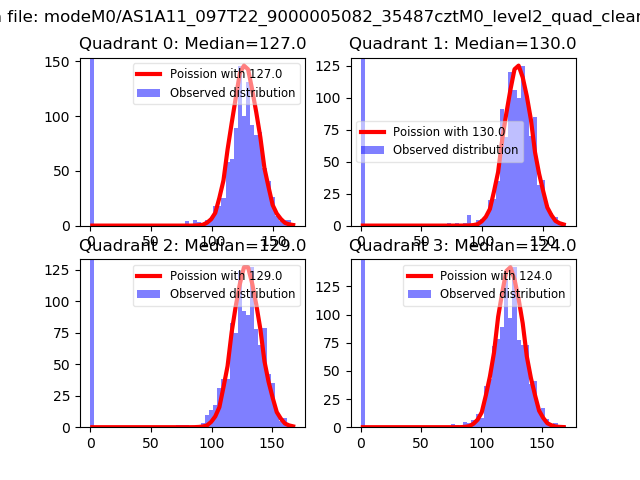 |
 |
| Quadrant-wise count rates Data is divided into 100 sec bins |
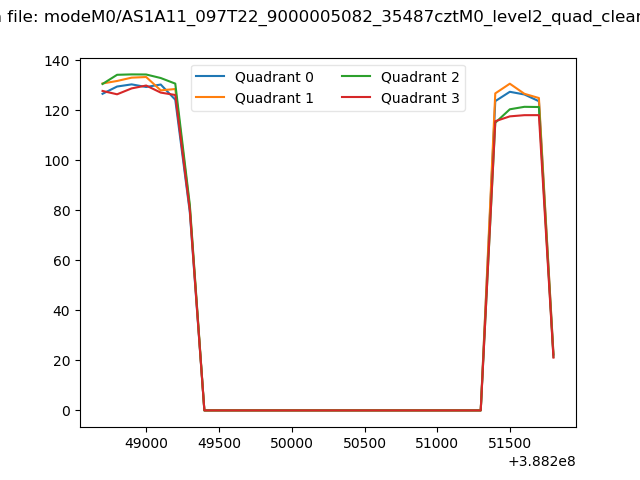 |
|
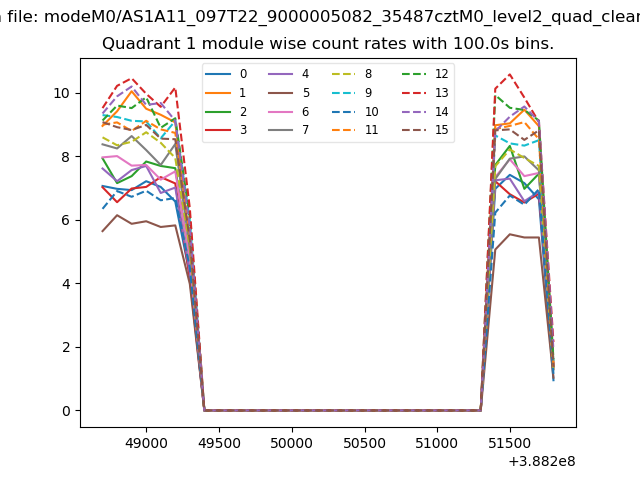
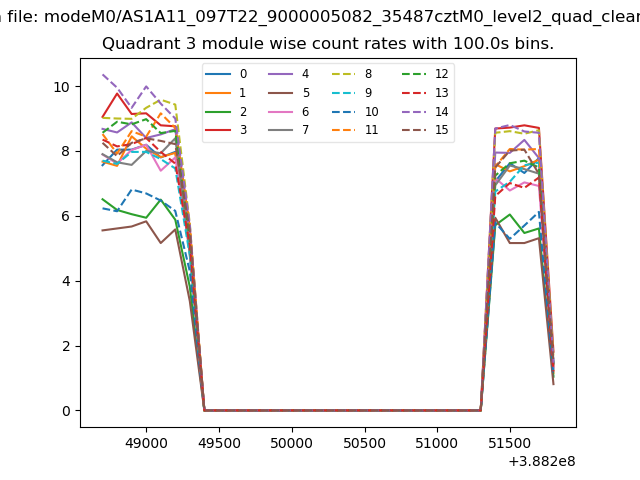
| Module-wise count rates for Quadrant A Data is divided into 100 sec bins |
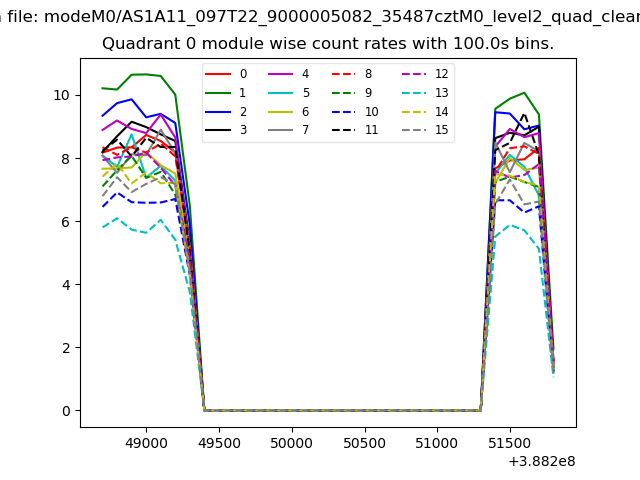 |
 |
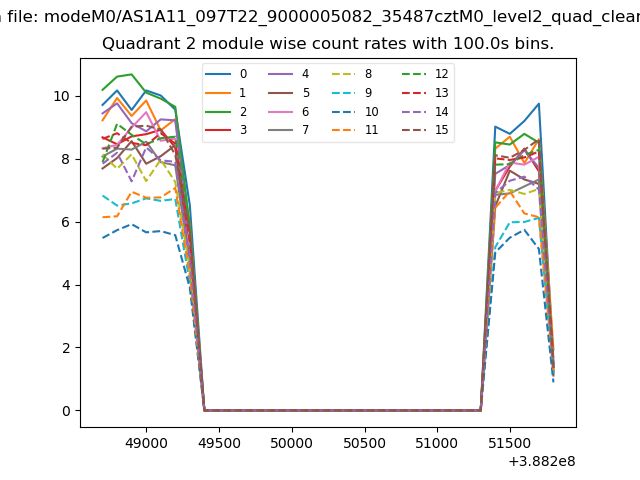
| Module-wise count rates for Quadrant B Data is divided into 100 sec bins |
 |
 |
| Module-wise count rates for Quadrant C Data is divided into 100 sec bins |
 |
 |
| Module-wise count rates for Quadrant D Data is divided into 100 sec bins |
 |
 |
| Parameter | Plot |
|---|---|
| CZT HV Monitor | 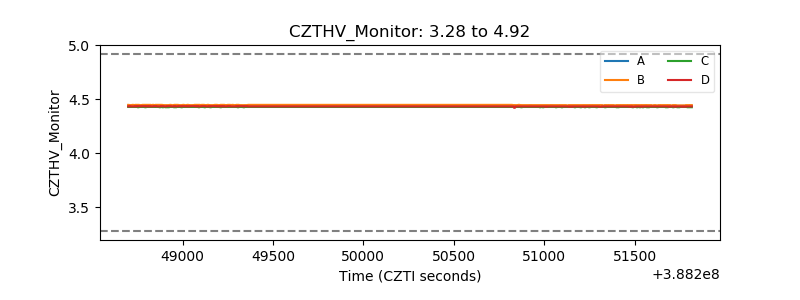 |
| D_VDD | 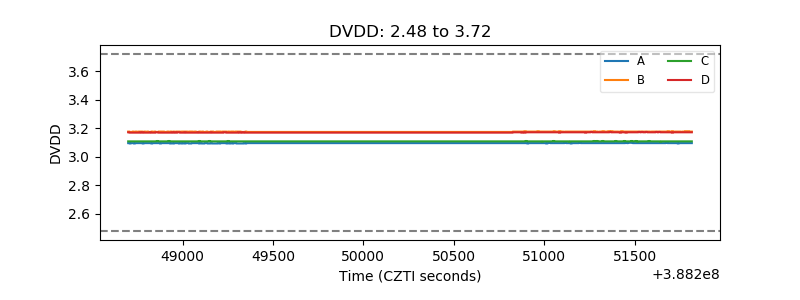 |
| Temperature 1 | 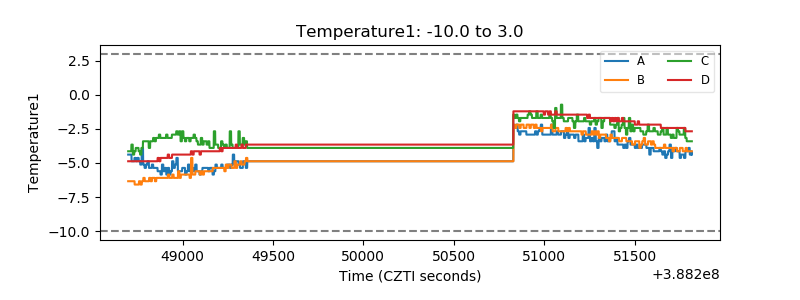 |
| Veto HV Monitor | 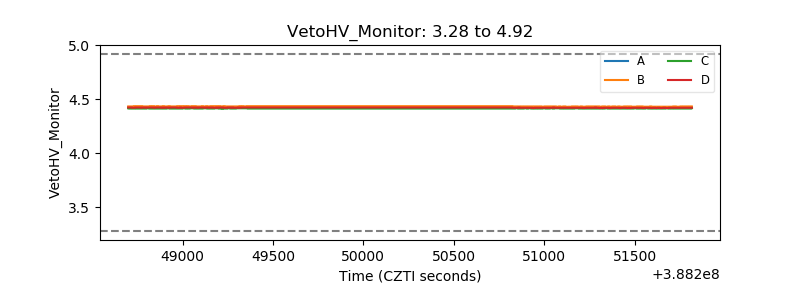 |
| Veto LLD | 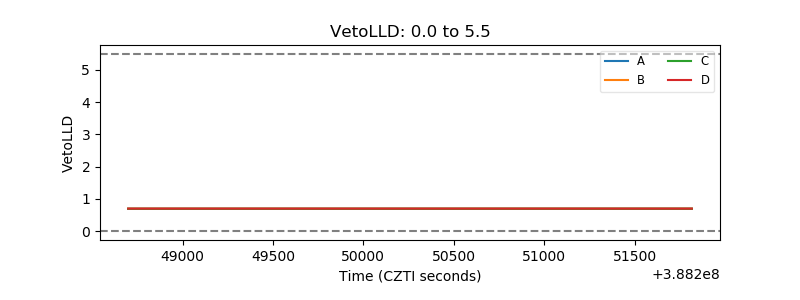 |
| Alpha Counter | 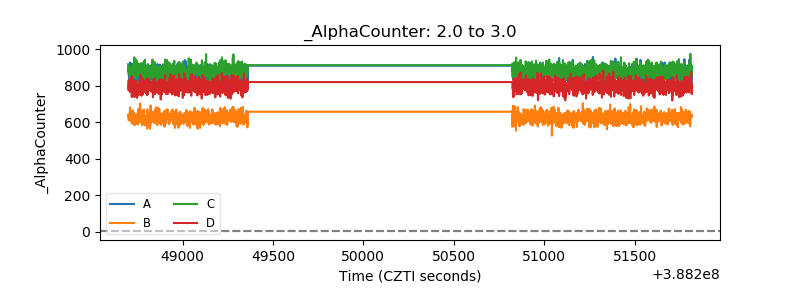 |
| _CPM_Rate | 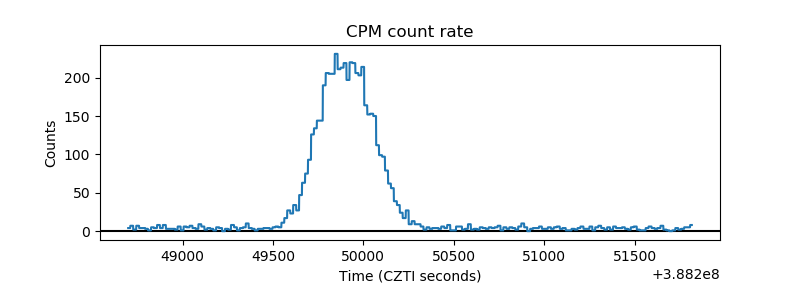 |
| CZT Counter | 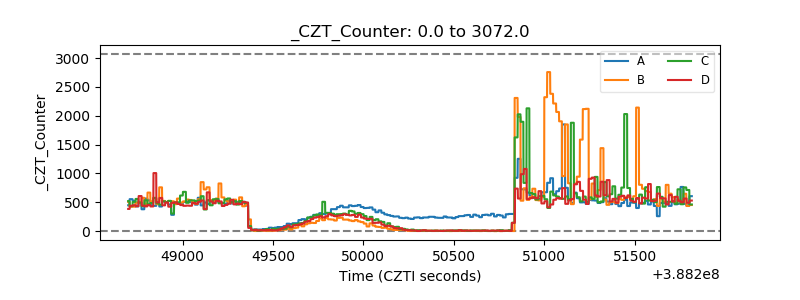 |
| +2.5 Volts monitor | 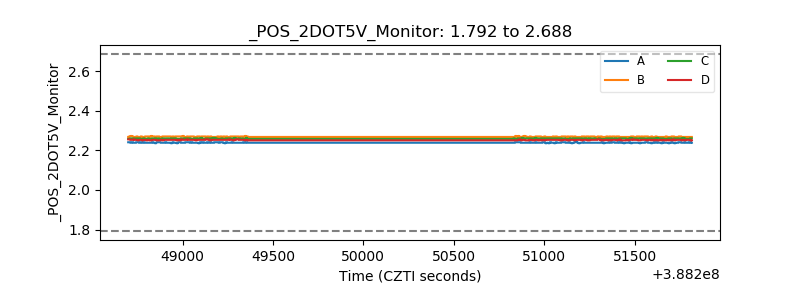 |
| +5 Volts monitor | 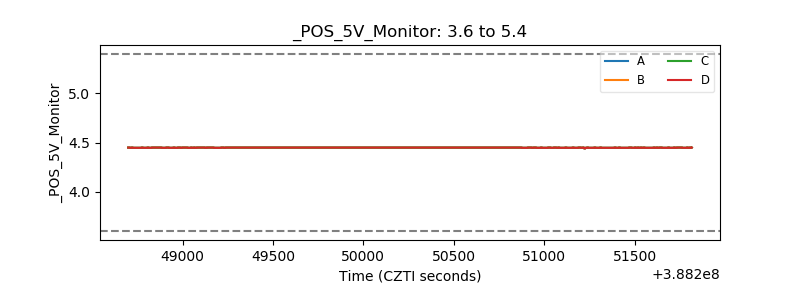 |
| _ROLL_ROT | 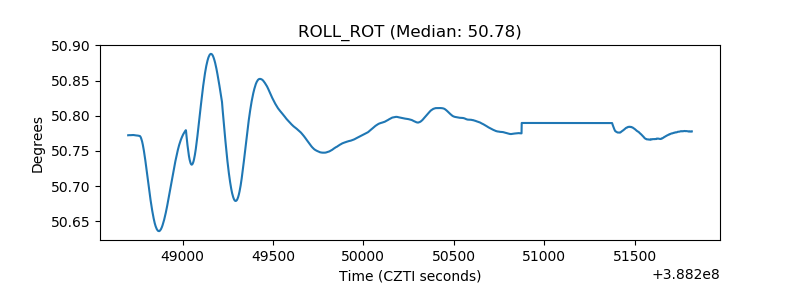 |
| _Roll_DEC | 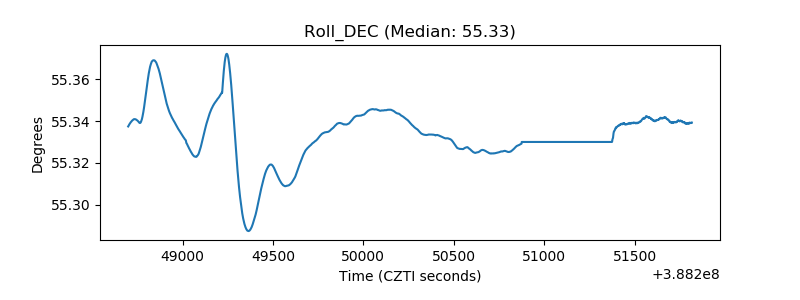 |
| _Roll_RA | 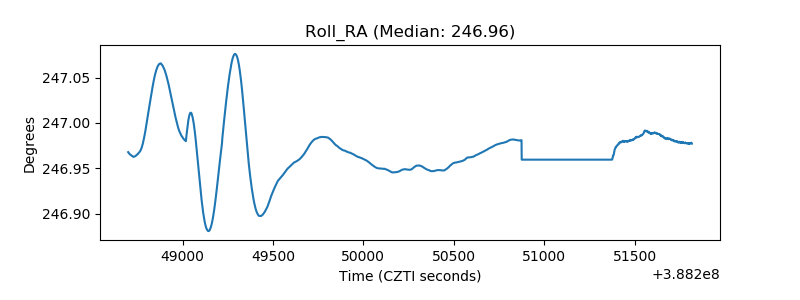 |
| Veto Counter | 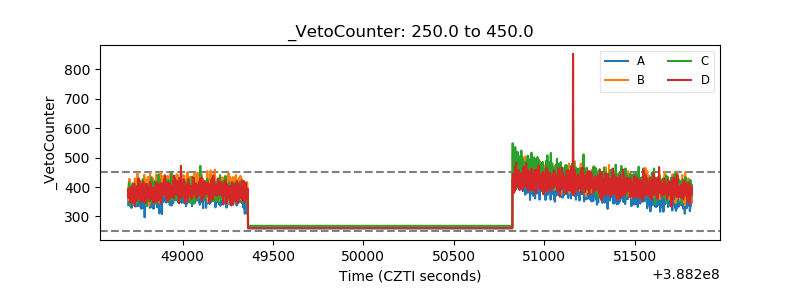 |