| Param | Original file | Final file |
|---|---|---|
| Filename | modeM0/AS1A11_097T22_9000005082cztM0_level2_bc.evt | modeM0/AS1A11_097T22_9000005082cztM0_level2_quad_clean.evt |
| Size (bytes) | 3,537,014,400 | 1,059,776,640 |
| Size | 3.3 GB | 1010.7 MB |
| Events in quadrant A | 23,648,270 | 6,491,784 |
| Events in quadrant B | 28,050,082 | 6,840,722 |
| Events in quadrant C | 25,029,014 | 7,050,292 |
| Events in quadrant D | 25,364,078 | 6,650,984 |
| Mode M9 | |||
|---|---|---|---|
| Quadrant | BADHDUFLAG | Total packets | Discarded packets |
| A | 0 | 289 | 0 |
| B | 0 | 289 | 0 |
| C | 0 | 289 | 0 |
| D | 0 | 289 | 0 |
| Mode M0 | |||
|---|---|---|---|
| Quadrant | BADHDUFLAG | Total packets | Discarded packets |
| A | 0 | 194893 | 0 |
| B | 0 | 205101 | 0 |
| C | 0 | 177031 | 0 |
| D | 0 | 182009 | 0 |
| Mode SS | |||
|---|---|---|---|
| Quadrant | BADHDUFLAG | Total packets | Discarded packets |
| A | 0 | 1508 | 0 |
| B | 0 | 1508 | 0 |
| C | 0 | 1508 | 0 |
| D | 0 | 1508 | 0 |
| Quadrant | Total seconds | Saturated seconds | Saturation percentage |
|---|---|---|---|
| A | 73870 | 6637 | 8.984703% |
| B | 73870 | 5583 | 7.557872% |
| C | 73870 | 1656 | 2.241776% |
| D | 73870 | 2069 | 2.800866% |
Noise dominated data is calculated using 1-second bins in cleaned event files. If a bin has >2000 counts, and if more than 50% of those come from <1% of pixels, then it is considered to be noise-dominated and hence unusable.
| Quadrant | # 1 sec bins | Bins with >0 counts | Bins with >2000 counts | High rate bins dominated by noise | Noise dominated (total time) | Noise dominated (detector-on time) | Marked lightcurve |
|---|---|---|---|---|---|---|---|
| A | 102718 | 73800 | 1109 | 1109 | 1.08% | 1.50% | 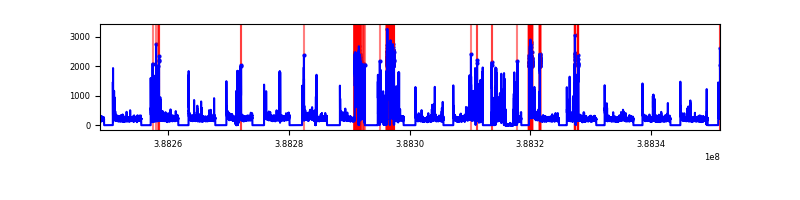 |
| B | 102718 | 73873 | 183 | 183 | 0.18% | 0.25% | 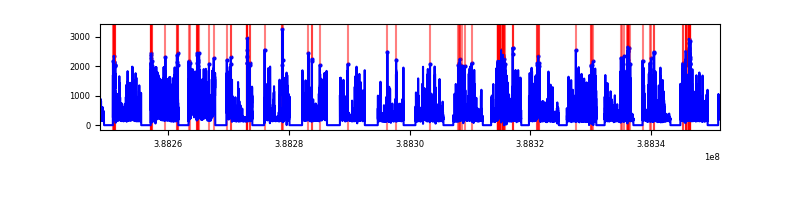 |
| C | 102718 | 73871 | 355 | 355 | 0.35% | 0.48% | 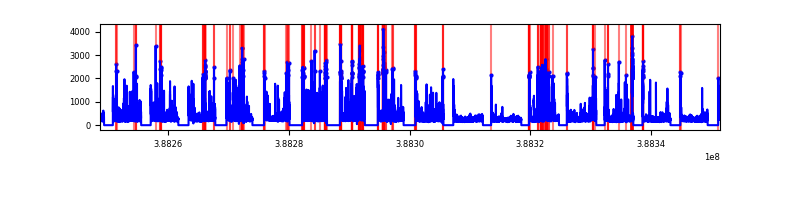 |
| D | 102718 | 73872 | 616 | 616 | 0.60% | 0.83% | 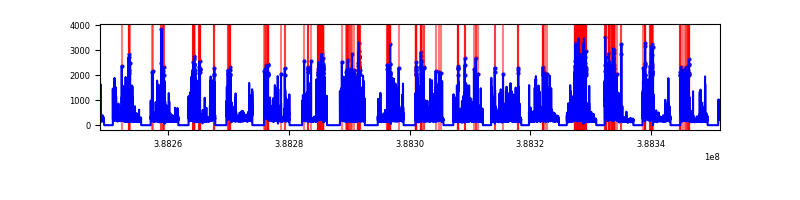 |
Top three noisy pixels from each quadrant. If the there are fewer than three noisy pixels in the level2.evt file, extra rows are filled as -1
| Pixel properties | Quadrant properties | ||||||
|---|---|---|---|---|---|---|---|
| Quadrant | DetID | PixID | Counts | Sigma | Mean | Median | Sigma |
| A | 15 | 169 | 8538095 | 10899.32 | 3525 | 3467 | 783.0 |
| A | 10 | 83 | 1300680 | 1656.63 | 3525 | 3467 | 783.0 |
| A | 13 | 254 | 97720 | 120.37 | 3525 | 3467 | 783.0 |
| B | 5 | 172 | 4316912 | 5930.32 | 3710 | 3630 | 727.3 |
| B | 5 | 236 | 4075060 | 5597.8 | 3710 | 3630 | 727.3 |
| B | 4 | 171 | 3914284 | 5376.74 | 3710 | 3630 | 727.3 |
| C | 15 | 214 | 2860099 | 3292.47 | 3767 | 3733 | 867.5 |
| C | 0 | 10 | 2309365 | 2657.65 | 3767 | 3733 | 867.5 |
| C | 0 | 207 | 1535312 | 1765.42 | 3767 | 3733 | 867.5 |
| D | 7 | 80 | 2717600 | 3099.27 | 3731 | 3619 | 875.7 |
| D | 12 | 217 | 2556261 | 2915.03 | 3731 | 3619 | 875.7 |
| D | 13 | 249 | 1516649 | 1727.83 | 3731 | 3619 | 875.7 |
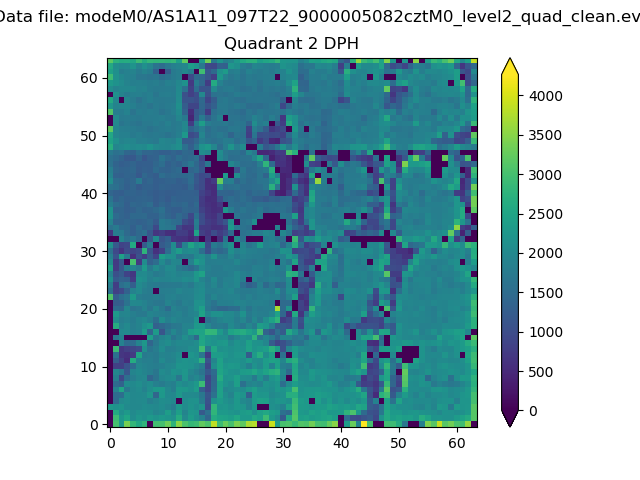
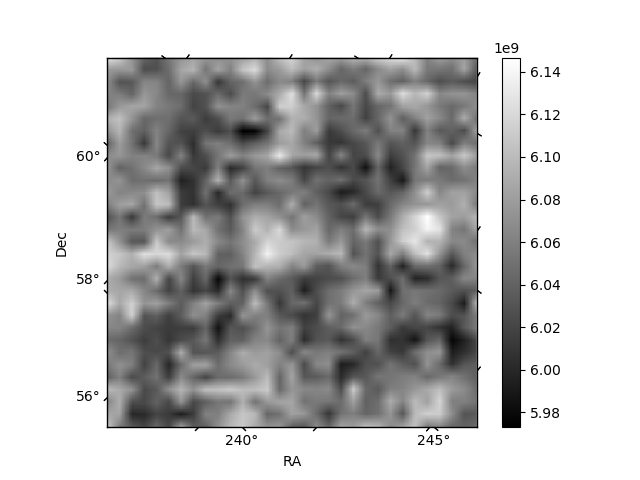
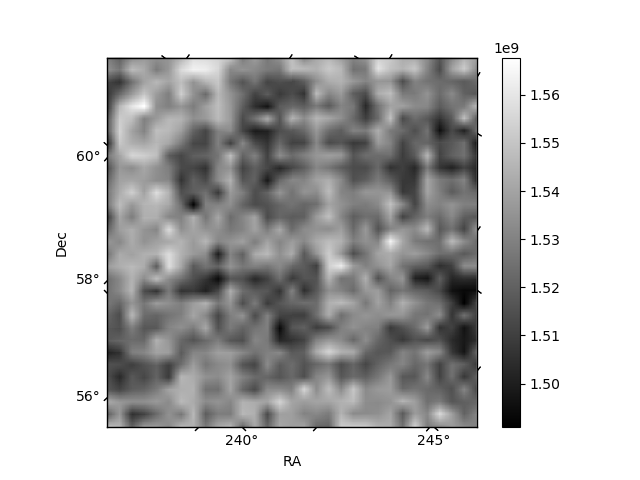
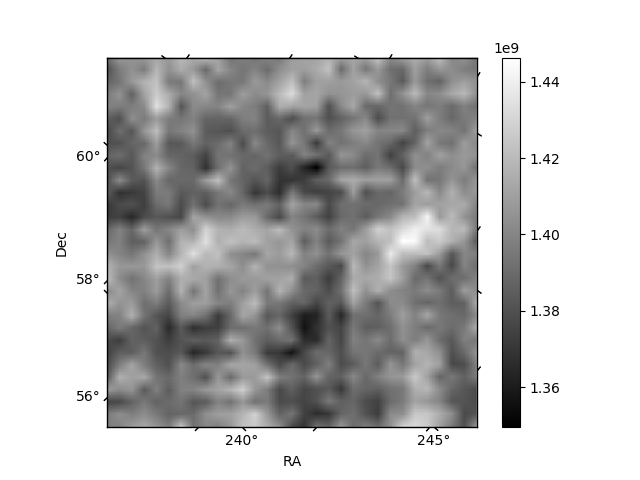
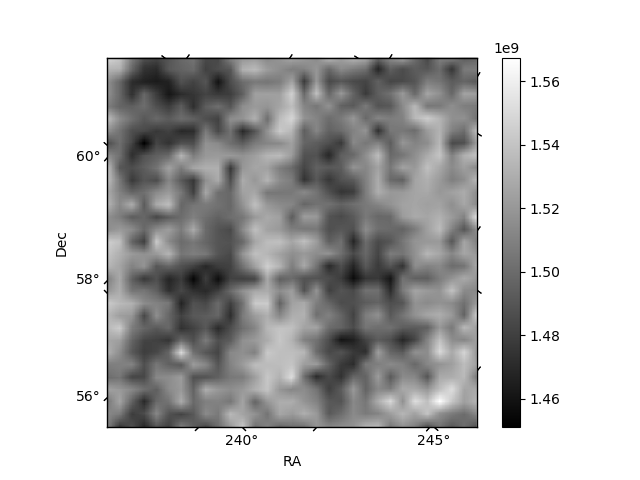
Histogram calculated using DETX and DETY for each event in the final _common_clean file
| Quadrant A | 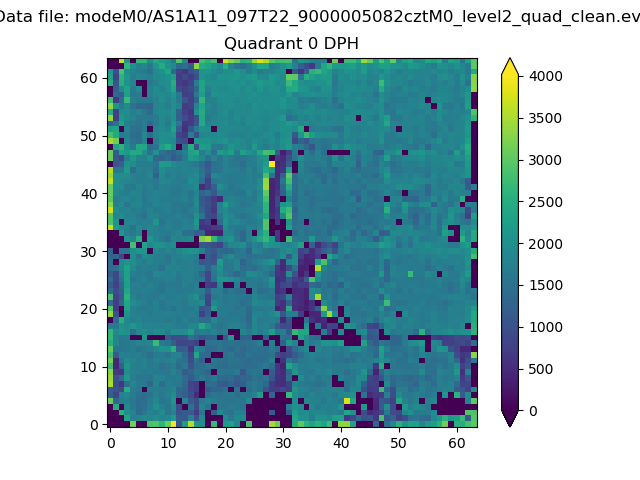 |
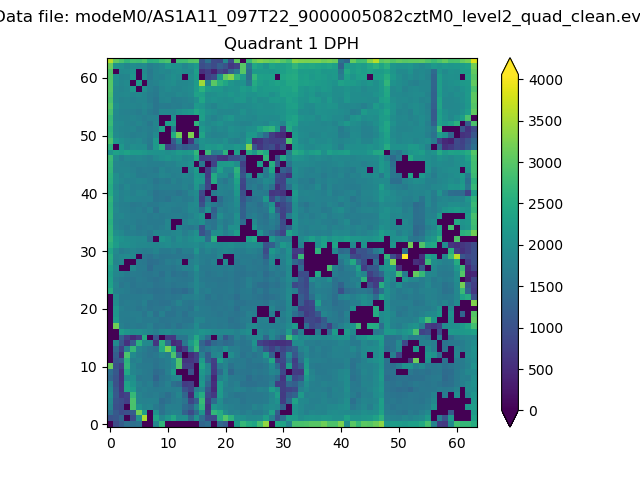 |
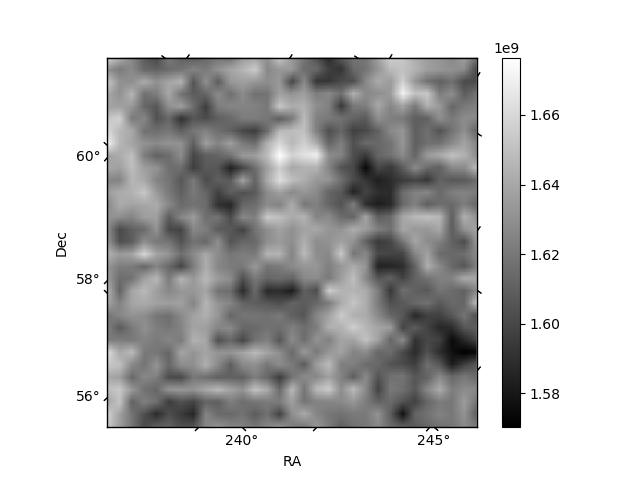
Quadrant B |
|---|---|---|---|
| Quadrant D | 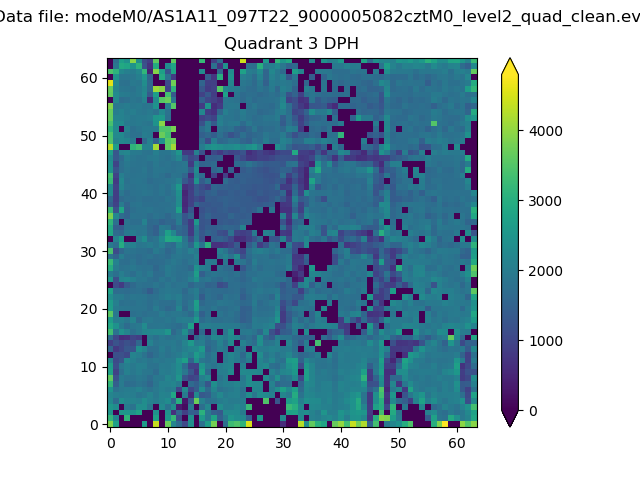 |
 |
Quadrant C |
| Plot type | Count rate plots | Images |
|---|---|---|
| Comparison with Poisson distribution Blue bars denote a histogram of data divided into 1 sec bins. Red curve is a Poisson curve with rate = median count rate of data. |
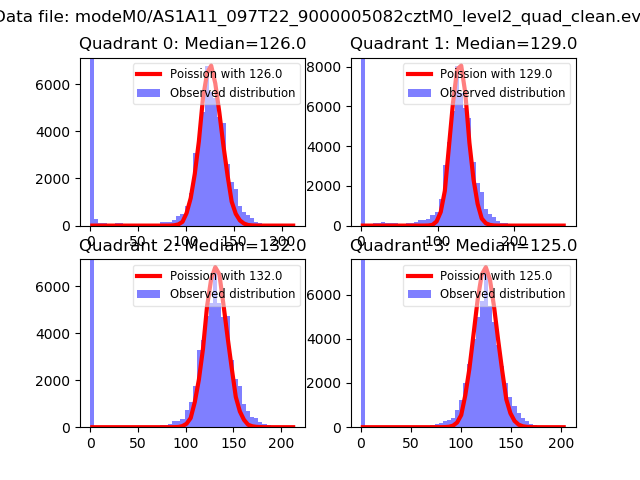 |
 |
| Quadrant-wise count rates Data is divided into 100 sec bins |
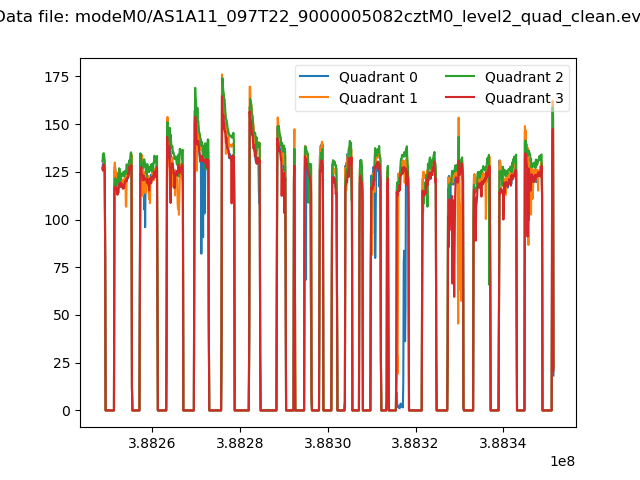 |
|
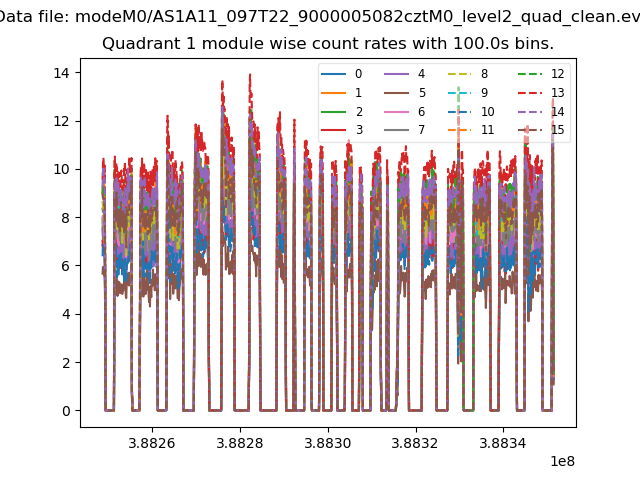
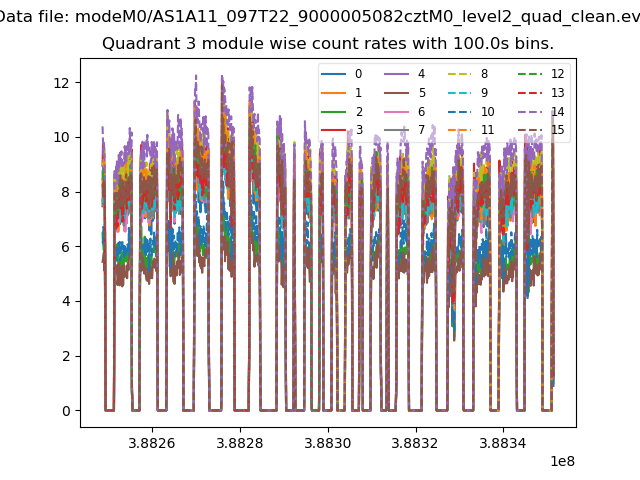
| Module-wise count rates for Quadrant A Data is divided into 100 sec bins |
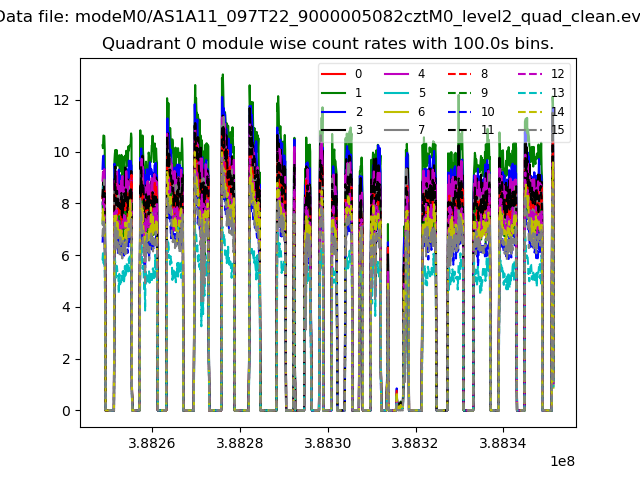 |
 |
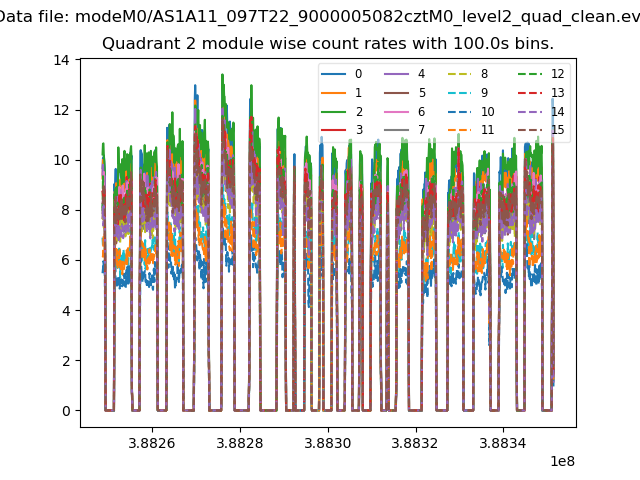
| Module-wise count rates for Quadrant B Data is divided into 100 sec bins |
 |
 |
| Module-wise count rates for Quadrant C Data is divided into 100 sec bins |
 |
 |
| Module-wise count rates for Quadrant D Data is divided into 100 sec bins |
 |
 |
| Parameter | Plot |
|---|---|
| CZT HV Monitor | 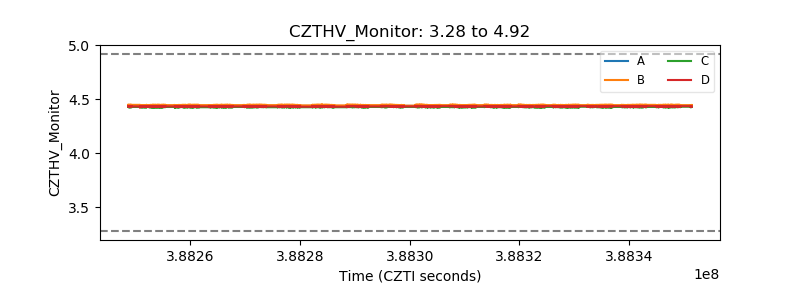 |
| D_VDD | 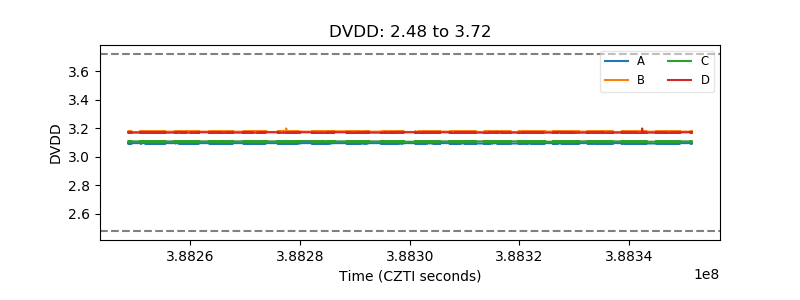 |
| Temperature 1 | 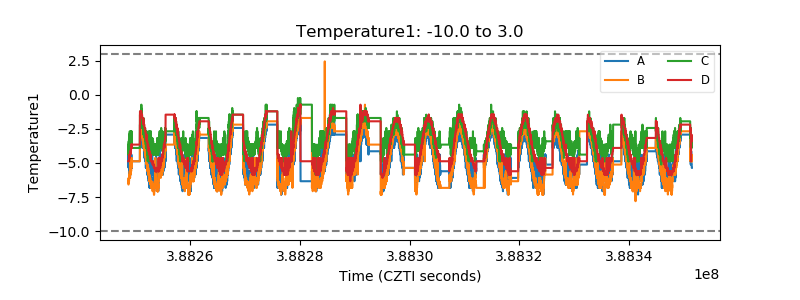 |
| Veto HV Monitor | 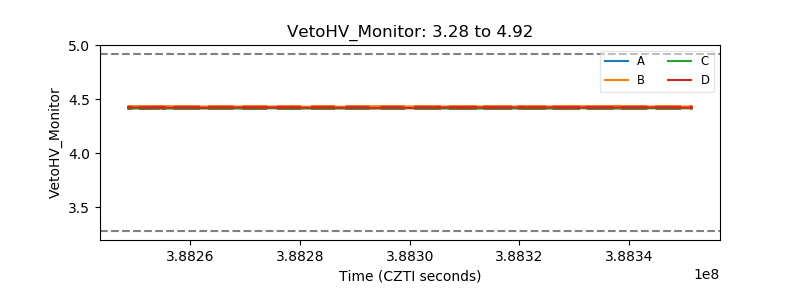 |
| Veto LLD | 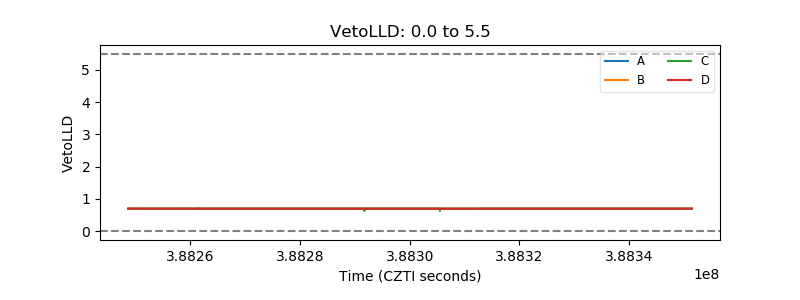 |
| Alpha Counter | 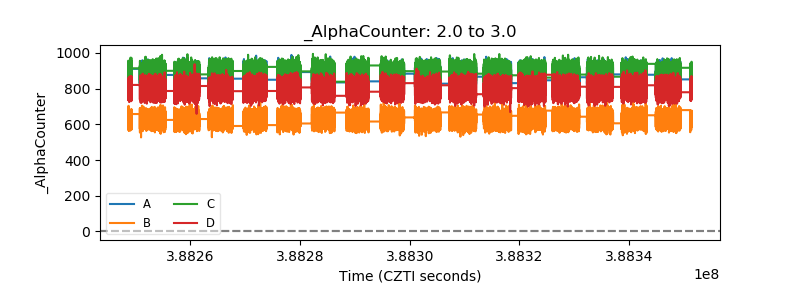 |
| _CPM_Rate | 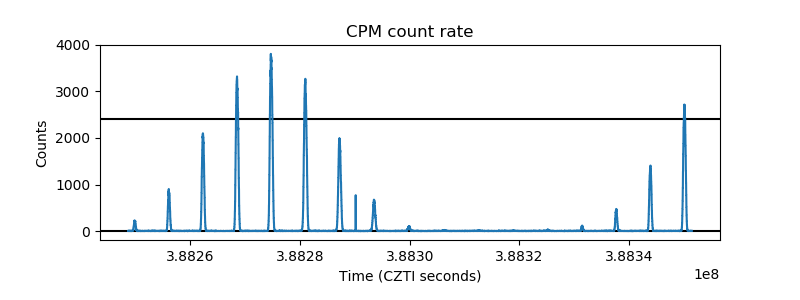 |
| CZT Counter | 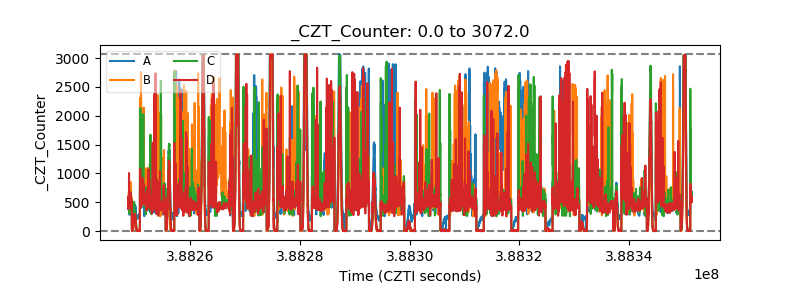 |
| +2.5 Volts monitor | 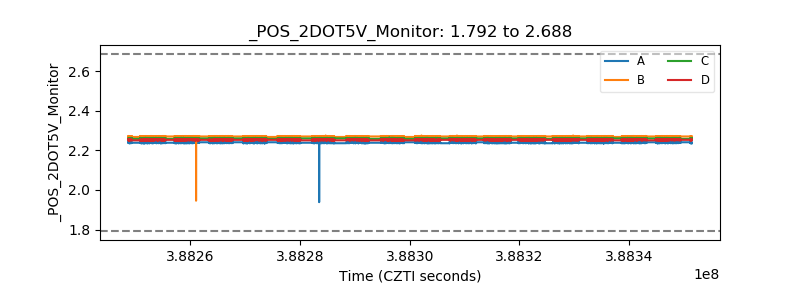 |
| +5 Volts monitor | 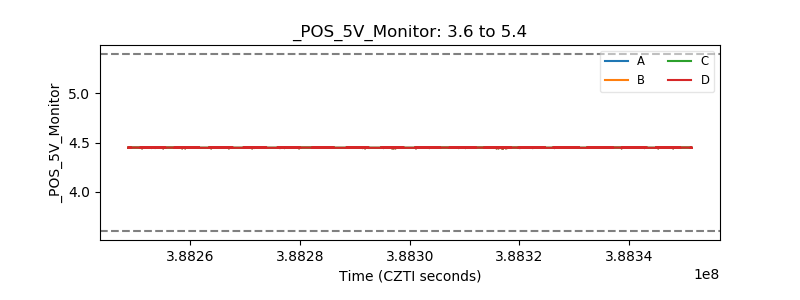 |
| _ROLL_ROT | 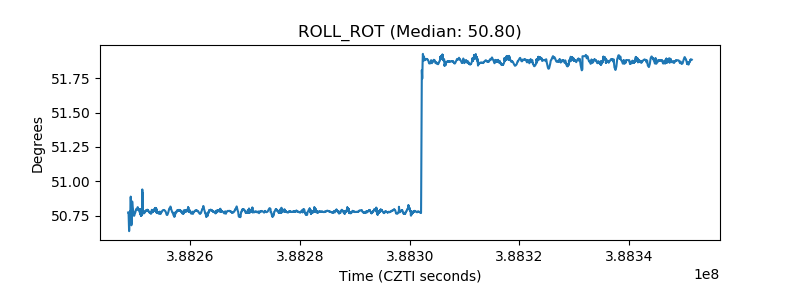 |
| _Roll_DEC | 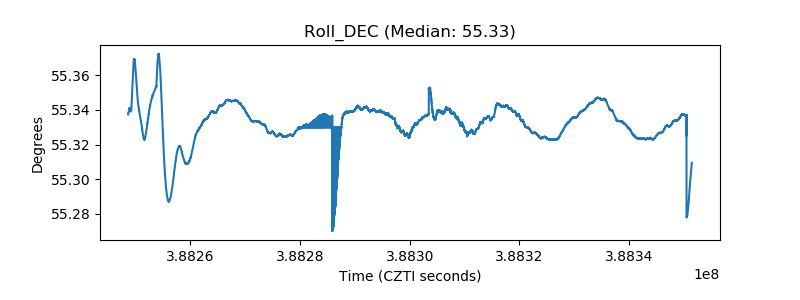 |
| _Roll_RA | 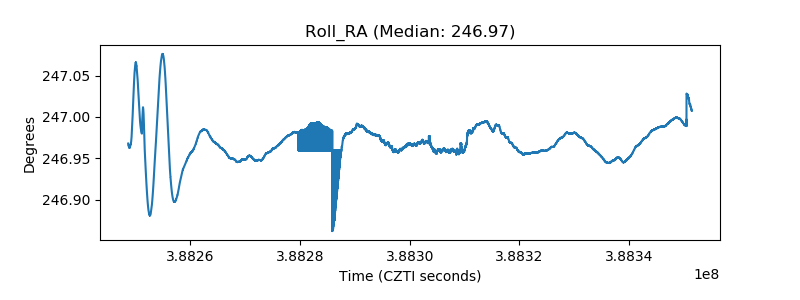 |
| Veto Counter | 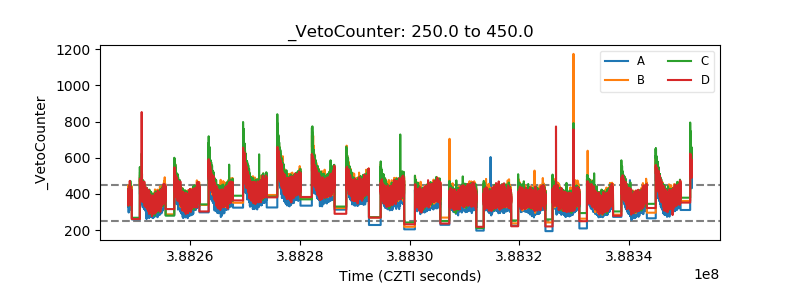 |