| Param | Original file | Final file |
|---|---|---|
| Filename | modeM0/AS1T04_095T01_9000005080_35487cztM0_level2.evt | modeM0/AS1T04_095T01_9000005080_35487cztM0_level2_quad_clean.evt |
| Size (bytes) | 704,563,200 | 122,880,960 |
| Size | 671.9 MB | 117.2 MB |
| Events in quadrant A | 7,061,896 | 767,617 |
| Events in quadrant B | 4,933,760 | 826,403 |
| Events in quadrant C | 4,084,802 | 821,219 |
| Events in quadrant D | 4,755,933 | 790,153 |
| Mode M0 | |||
|---|---|---|---|
| Quadrant | BADHDUFLAG | Total packets | Discarded packets |
| A | 0 | 25965 | 1 |
| B | 0 | 19525 | 1 |
| C | 0 | 16778 | 1 |
| D | 0 | 18648 | 1 |
| Mode M9 | |||
|---|---|---|---|
| Quadrant | BADHDUFLAG | Total packets | Discarded packets |
| A | 0 | 14 | 0 |
| B | 0 | 14 | 0 |
| C | 0 | 14 | 0 |
| D | 0 | 14 | 0 |
| Mode SS | |||
|---|---|---|---|
| Quadrant | BADHDUFLAG | Total packets | Discarded packets |
| A | 0 | 150 | 0 |
| B | 0 | 150 | 0 |
| C | 0 | 150 | 0 |
| D | 0 | 150 | 0 |
| Quadrant | Total seconds | Saturated seconds | Saturation percentage |
|---|---|---|---|
| A | 7411 | 1321 | 17.824855% |
| B | 7411 | 298 | 4.021050% |
| C | 7411 | 81 | 1.092970% |
| D | 7411 | 185 | 2.496289% |
Noise dominated data is calculated using 1-second bins in cleaned event files. If a bin has >2000 counts, and if more than 50% of those come from <1% of pixels, then it is considered to be noise-dominated and hence unusable.
| Quadrant | # 1 sec bins | Bins with >0 counts | Bins with >2000 counts | High rate bins dominated by noise | Noise dominated (total time) | Noise dominated (detector-on time) | Marked lightcurve |
|---|---|---|---|---|---|---|---|
| A | 8784 | 7412 | 1182 | 1182 | 13.46% | 15.95% | 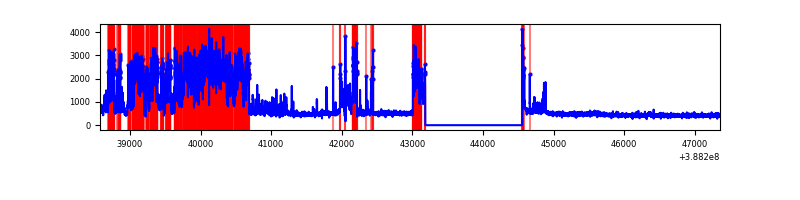 |
| B | 8784 | 7412 | 177 | 177 | 2.02% | 2.39% | 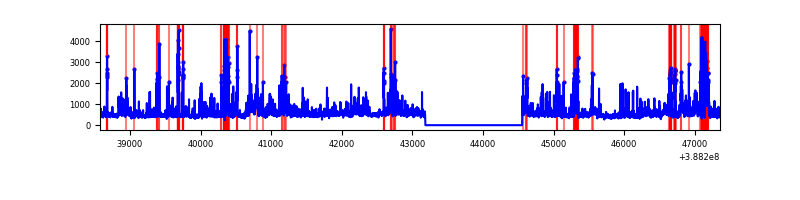 |
| C | 8784 | 7412 | 56 | 56 | 0.64% | 0.76% | 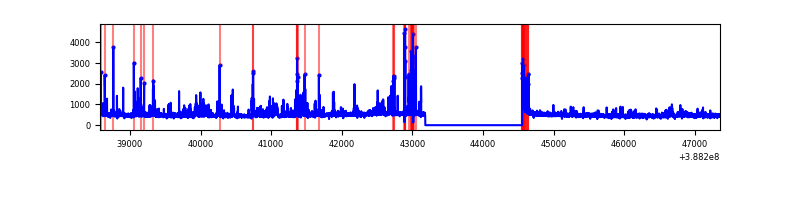 |
| D | 8784 | 7412 | 177 | 177 | 2.02% | 2.39% | 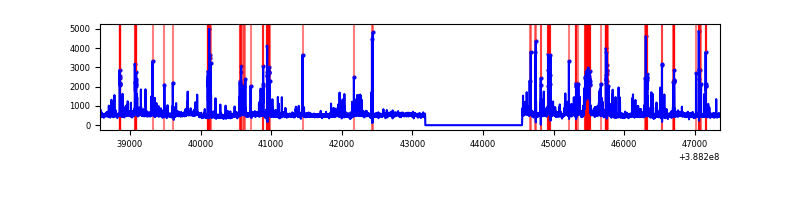 |
Top three noisy pixels from each quadrant. If the there are fewer than three noisy pixels in the level2.evt file, extra rows are filled as -1
| Pixel properties | Quadrant properties | ||||||
|---|---|---|---|---|---|---|---|
| Quadrant | DetID | PixID | Counts | Sigma | Mean | Median | Sigma |
| A | 15 | 169 | 3937615 | 25300.82 | 775 | 759 | 155.6 |
| A | 10 | 83 | 120039 | 766.57 | 775 | 759 | 155.6 |
| A | 13 | 254 | 11038 | 66.06 | 775 | 759 | 155.6 |
| B | 4 | 171 | 612282 | 3945.74 | 814 | 793 | 155.0 |
| B | 5 | 236 | 405878 | 2613.88 | 814 | 793 | 155.0 |
| B | 4 | 81 | 263790 | 1697.03 | 814 | 793 | 155.0 |
| C | 0 | 207 | 462210 | 2498.46 | 798 | 804 | 184.7 |
| C | 15 | 214 | 298245 | 1610.61 | 798 | 804 | 184.7 |
| C | 0 | 10 | 156244 | 841.69 | 798 | 804 | 184.7 |
| D | 13 | 249 | 501727 | 2604.29 | 798 | 776 | 192.4 |
| D | 8 | 195 | 422768 | 2193.81 | 798 | 776 | 192.4 |
| D | 7 | 80 | 264695 | 1372.03 | 798 | 776 | 192.4 |
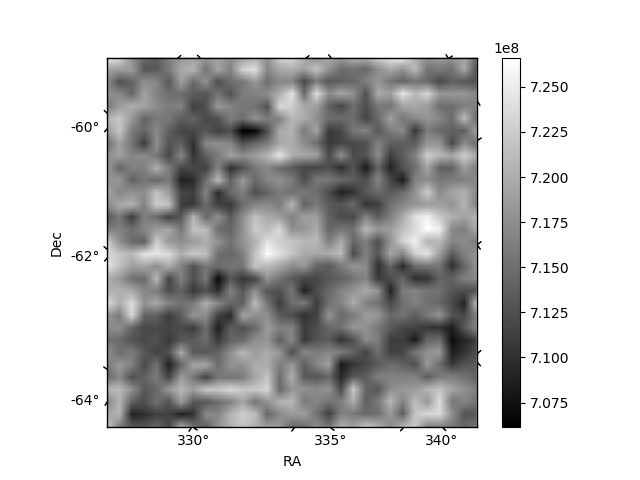
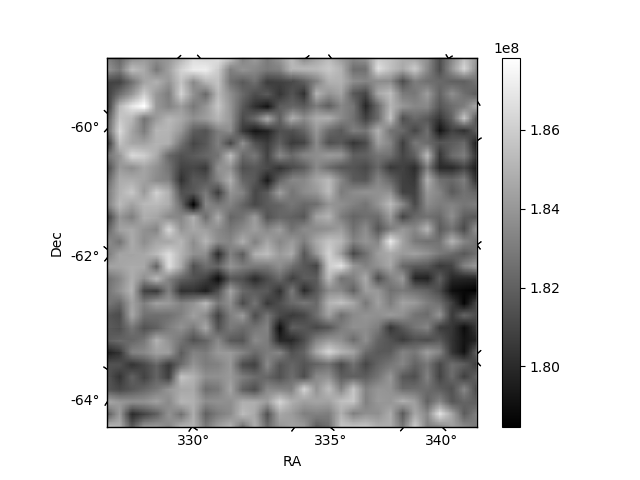
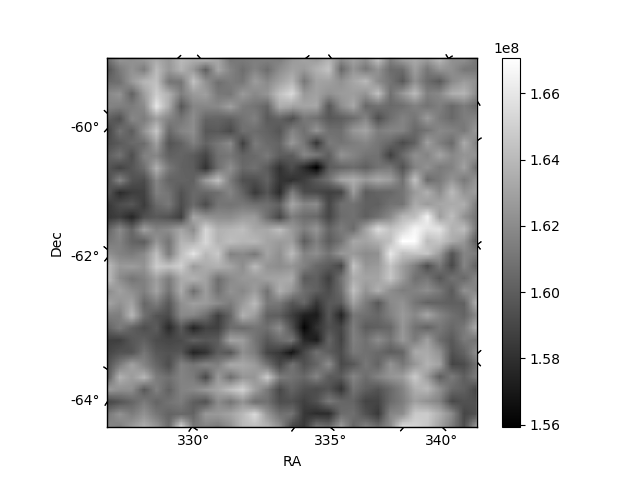
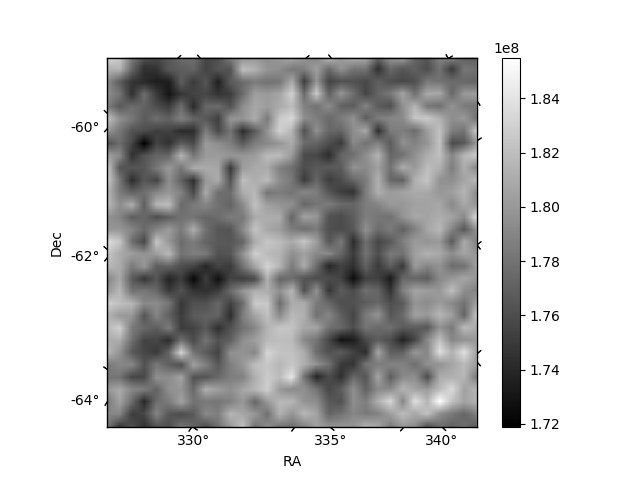
Histogram calculated using DETX and DETY for each event in the final _common_clean file
| Quadrant A | 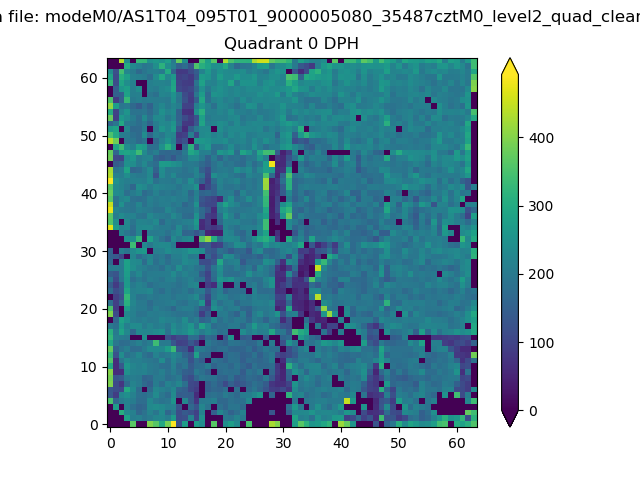 |
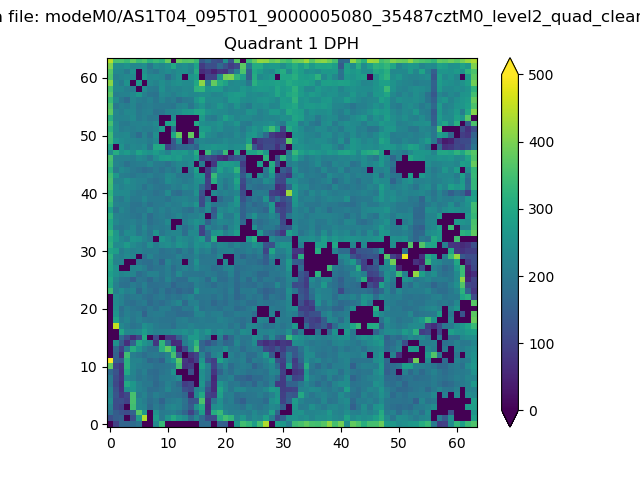 |
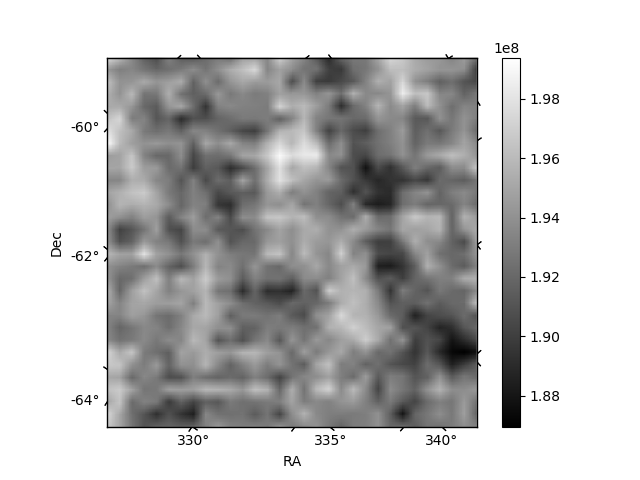
Quadrant B |
|---|---|---|---|
| Quadrant D | 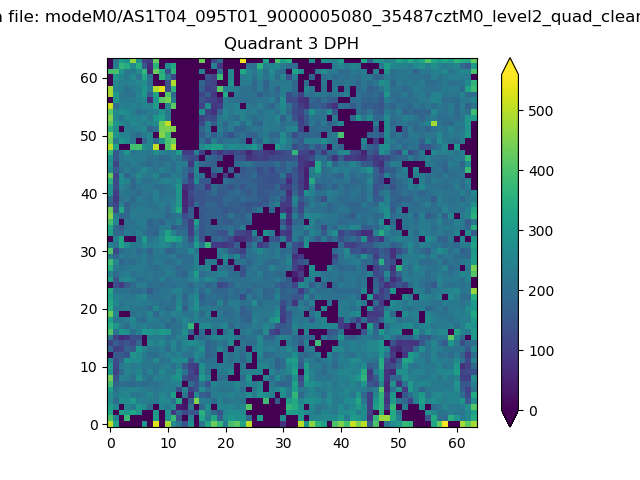 |
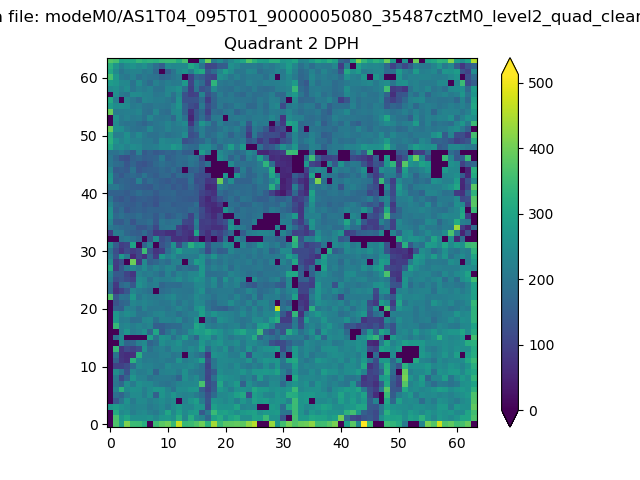 |
Quadrant C |
| Plot type | Count rate plots | Images |
|---|---|---|
| Comparison with Poisson distribution Blue bars denote a histogram of data divided into 1 sec bins. Red curve is a Poisson curve with rate = median count rate of data. |
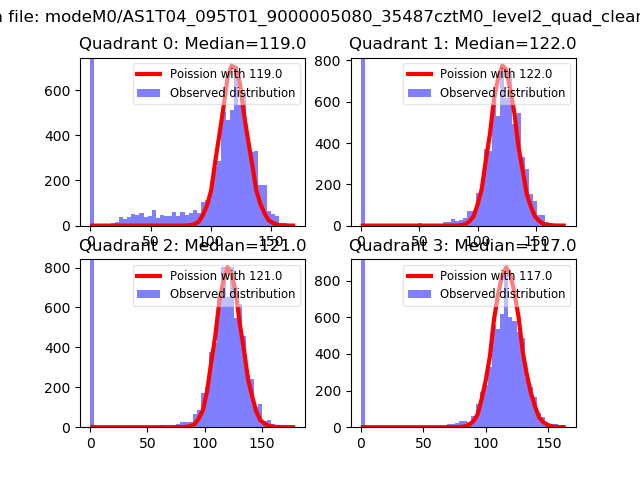 |
 |
| Quadrant-wise count rates Data is divided into 100 sec bins |
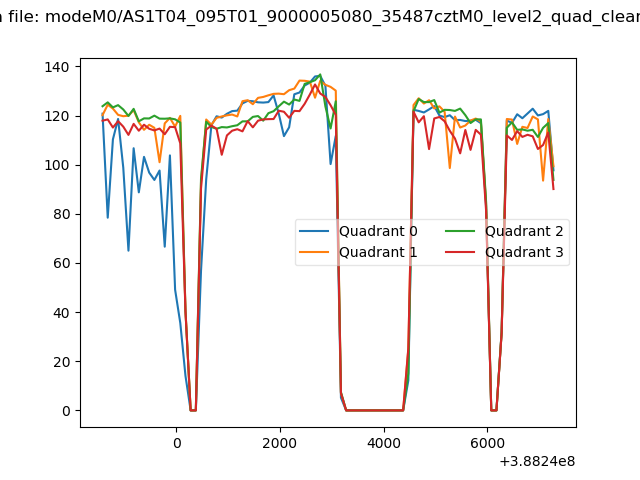 |
|
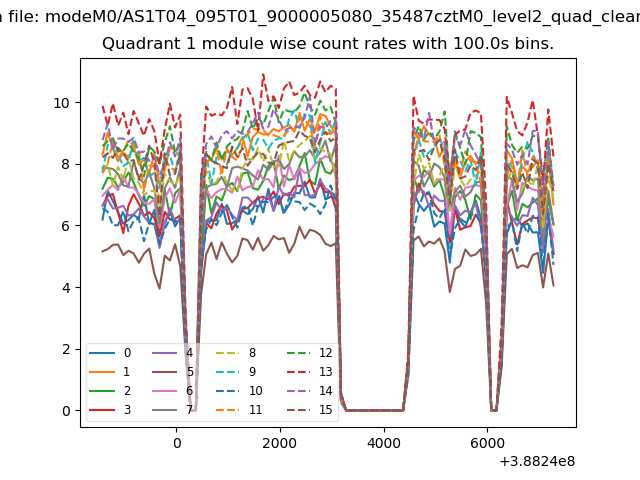
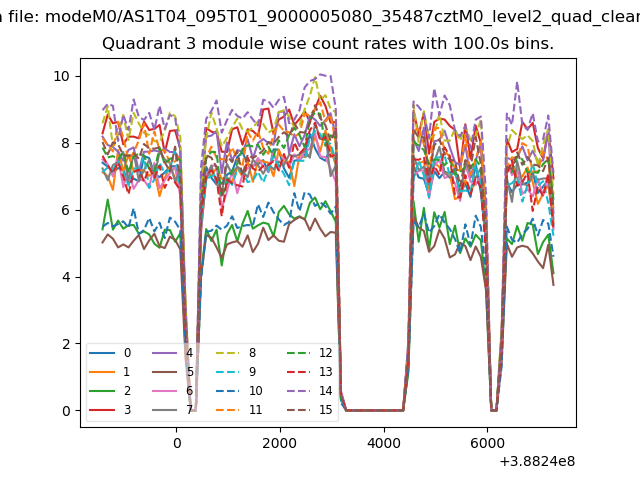
| Module-wise count rates for Quadrant A Data is divided into 100 sec bins |
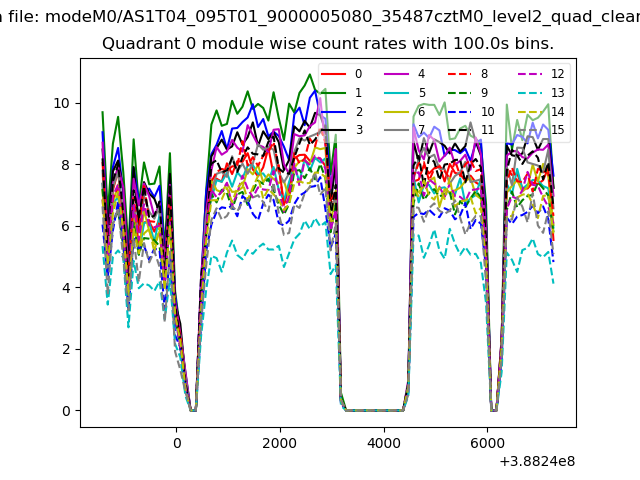 |
 |
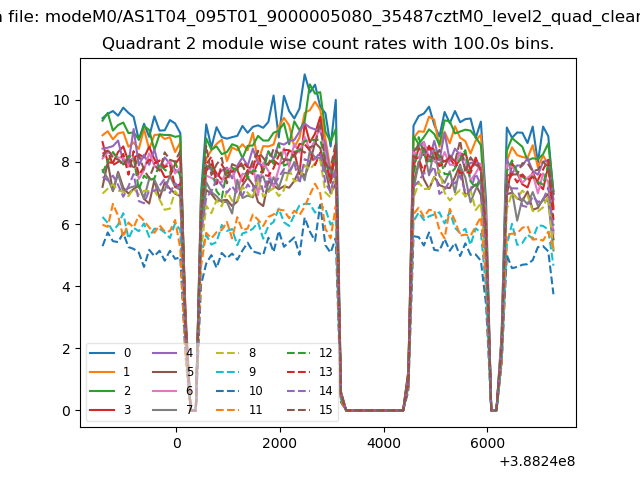
| Module-wise count rates for Quadrant B Data is divided into 100 sec bins |
 |
 |
| Module-wise count rates for Quadrant C Data is divided into 100 sec bins |
 |
 |
| Module-wise count rates for Quadrant D Data is divided into 100 sec bins |
 |
 |
| Parameter | Plot |
|---|---|
| CZT HV Monitor | 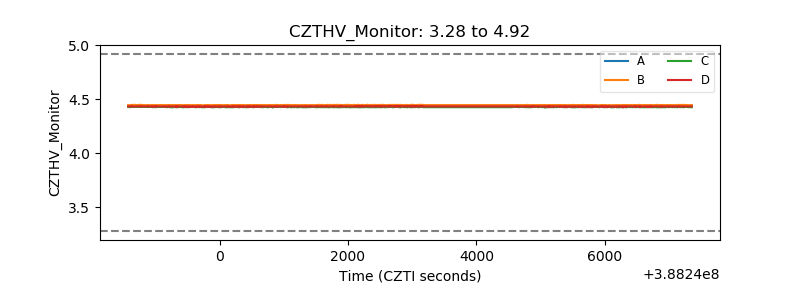 |
| D_VDD | 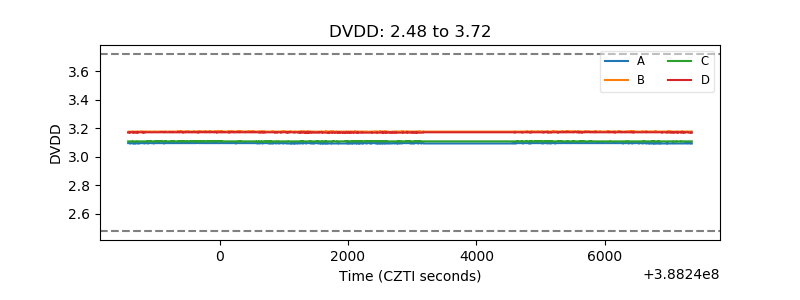 |
| Temperature 1 | 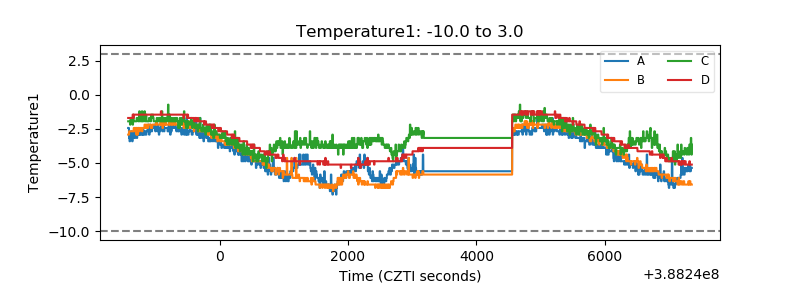 |
| Veto HV Monitor | 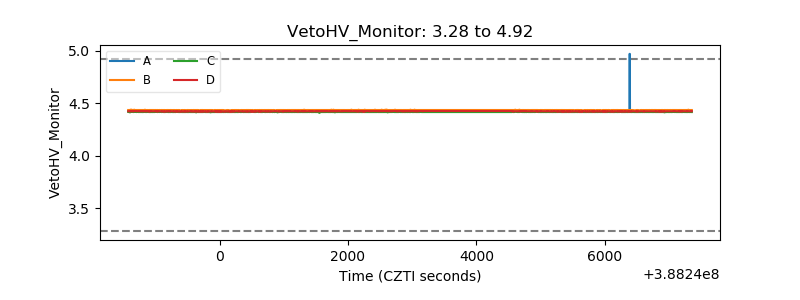 |
| Veto LLD | 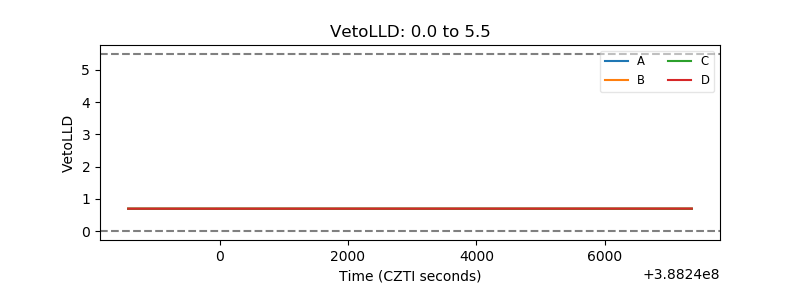 |
| Alpha Counter | 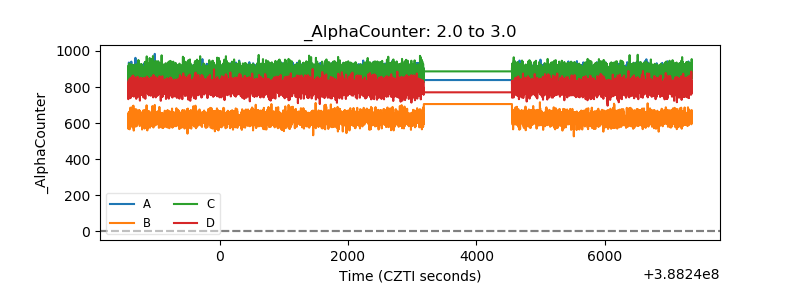 |
| _CPM_Rate | 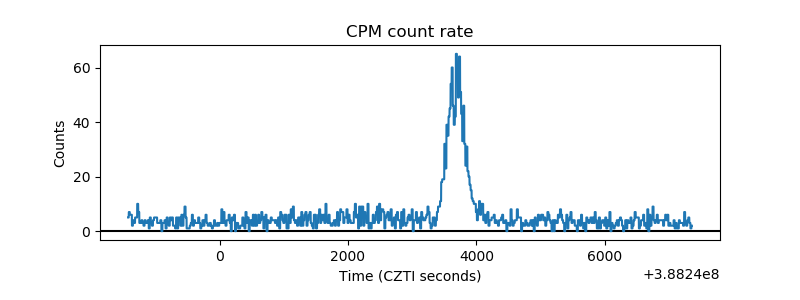 |
| CZT Counter | 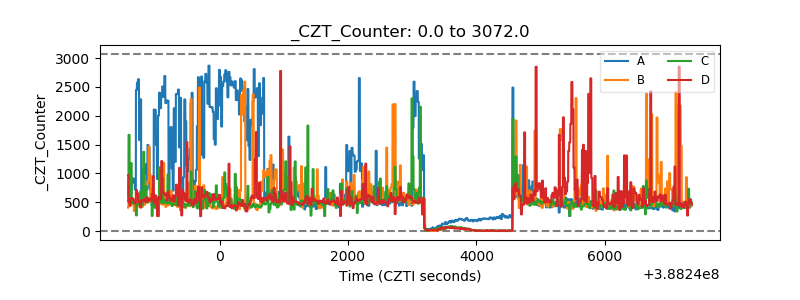 |
| +2.5 Volts monitor | 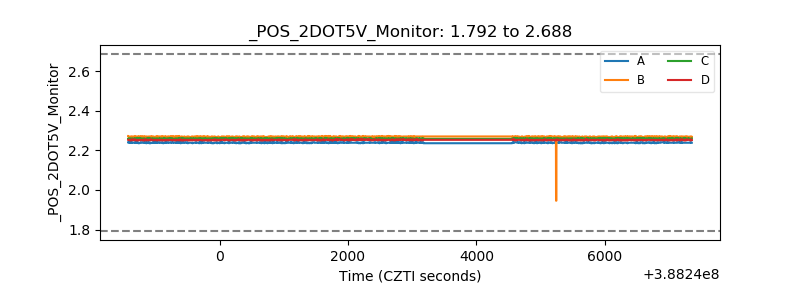 |
| +5 Volts monitor | 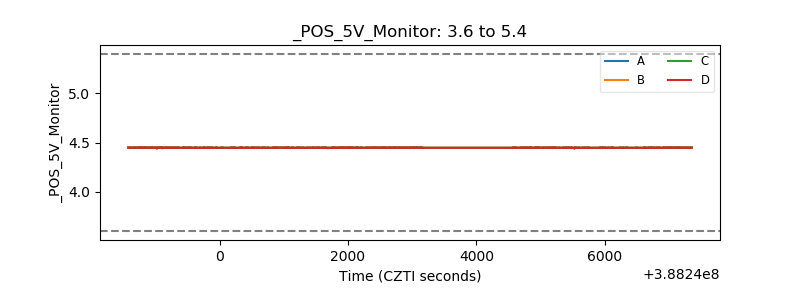 |
| _ROLL_ROT | 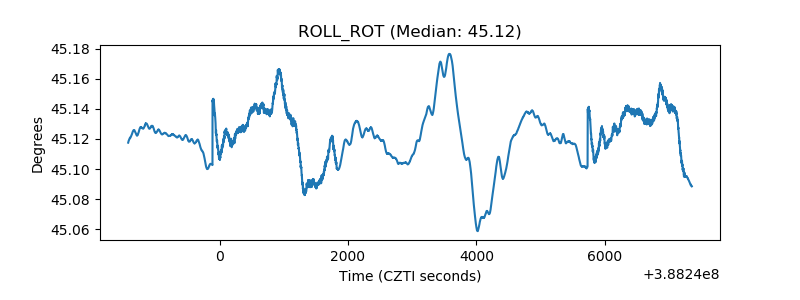 |
| _Roll_DEC |  |
| _Roll_RA | 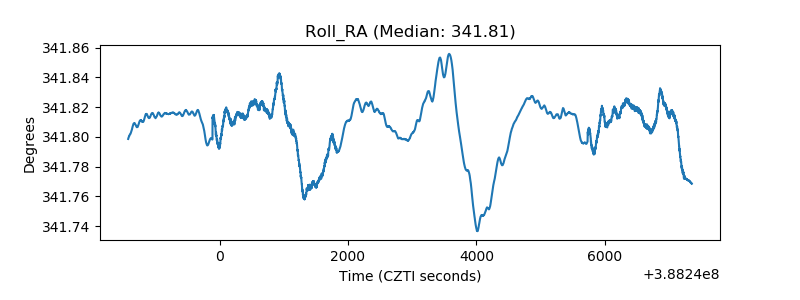 |
| Veto Counter | 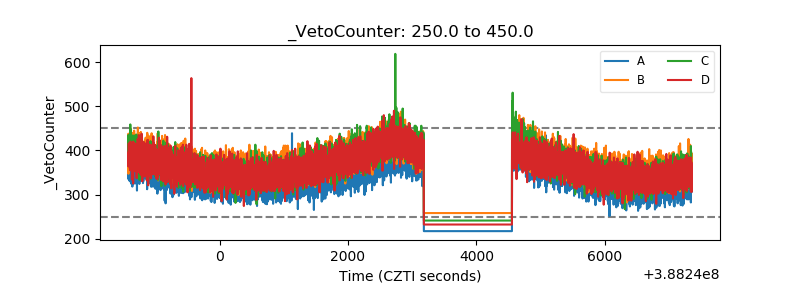 |