| Param | Original file | Final file |
|---|---|---|
| Filename | modeM0/AS1T04_095T01_9000005080_35485cztM0_level2.evt | modeM0/AS1T04_095T01_9000005080_35485cztM0_level2_quad_clean.evt |
| Size (bytes) | 509,624,640 | 104,339,520 |
| Size | 486.0 MB | 99.5 MB |
| Events in quadrant A | 4,023,511 | 681,764 |
| Events in quadrant B | 3,271,433 | 708,294 |
| Events in quadrant C | 3,989,804 | 689,217 |
| Events in quadrant D | 3,744,954 | 663,975 |
| Mode M0 | |||
|---|---|---|---|
| Quadrant | BADHDUFLAG | Total packets | Discarded packets |
| A | 0 | 15771 | 3 |
| B | 0 | 13544 | 2 |
| C | 0 | 15696 | 2 |
| D | 0 | 14816 | 2 |
| Mode M9 | |||
|---|---|---|---|
| Quadrant | BADHDUFLAG | Total packets | Discarded packets |
| A | 0 | 13 | 0 |
| B | 0 | 13 | 0 |
| C | 0 | 13 | 0 |
| D | 0 | 13 | 0 |
| Mode SS | |||
|---|---|---|---|
| Quadrant | BADHDUFLAG | Total packets | Discarded packets |
| A | 0 | 122 | 0 |
| B | 0 | 122 | 0 |
| C | 0 | 122 | 0 |
| D | 0 | 122 | 0 |
| Quadrant | Total seconds | Saturated seconds | Saturation percentage |
|---|---|---|---|
| A | 5959 | 378 | 6.343346% |
| B | 5959 | 41 | 0.688035% |
| C | 5959 | 167 | 2.802484% |
| D | 5960 | 170 | 2.852349% |
Noise dominated data is calculated using 1-second bins in cleaned event files. If a bin has >2000 counts, and if more than 50% of those come from <1% of pixels, then it is considered to be noise-dominated and hence unusable.
| Quadrant | # 1 sec bins | Bins with >0 counts | Bins with >2000 counts | High rate bins dominated by noise | Noise dominated (total time) | Noise dominated (detector-on time) | Marked lightcurve |
|---|---|---|---|---|---|---|---|
| A | 7272 | 5960 | 309 | 309 | 4.25% | 5.18% | 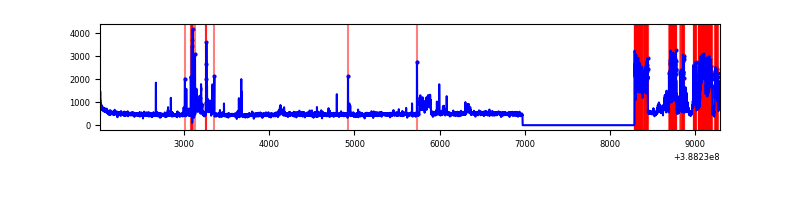 |
| B | 7272 | 5960 | 19 | 19 | 0.26% | 0.32% | 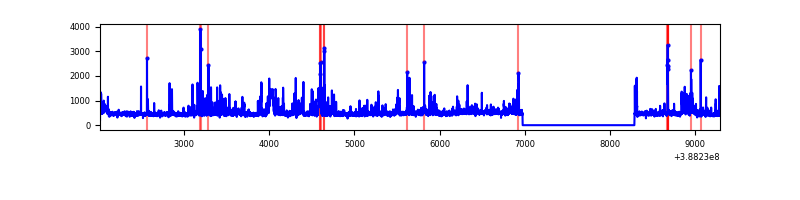 |
| C | 7272 | 5959 | 125 | 125 | 1.72% | 2.10% | 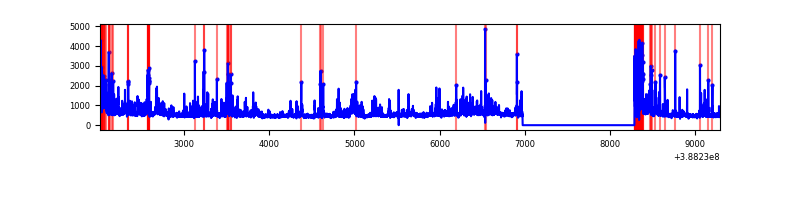 |
| D | 7273 | 5961 | 123 | 123 | 1.69% | 2.06% | 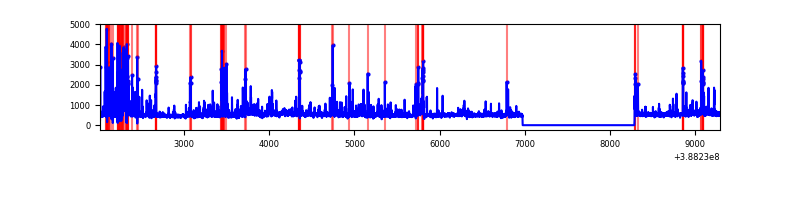 |
Top three noisy pixels from each quadrant. If the there are fewer than three noisy pixels in the level2.evt file, extra rows are filled as -1
| Pixel properties | Quadrant properties | ||||||
|---|---|---|---|---|---|---|---|
| Quadrant | DetID | PixID | Counts | Sigma | Mean | Median | Sigma |
| A | 15 | 169 | 1295407 | 9639.69 | 668 | 655 | 134.3 |
| A | 10 | 83 | 135698 | 1005.42 | 668 | 655 | 134.3 |
| A | 13 | 254 | 9438 | 65.39 | 668 | 655 | 134.3 |
| B | 5 | 172 | 218933 | 1676.03 | 675 | 656 | 130.2 |
| B | 4 | 232 | 139350 | 1064.95 | 675 | 656 | 130.2 |
| B | 5 | 236 | 114086 | 870.97 | 675 | 656 | 130.2 |
| C | 0 | 207 | 622306 | 4077.22 | 655 | 660 | 152.5 |
| C | 0 | 10 | 254119 | 1662.37 | 655 | 660 | 152.5 |
| C | 15 | 214 | 243738 | 1594.29 | 655 | 660 | 152.5 |
| D | 7 | 80 | 265105 | 1666.68 | 658 | 640 | 158.7 |
| D | 8 | 195 | 230261 | 1447.09 | 658 | 640 | 158.7 |
| D | 10 | 118 | 202680 | 1273.28 | 658 | 640 | 158.7 |
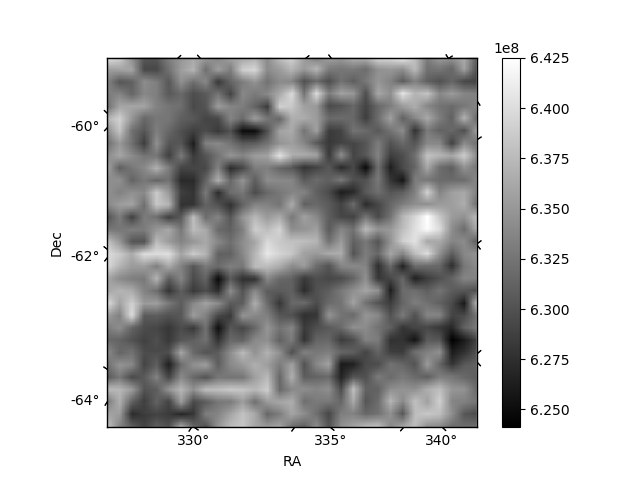
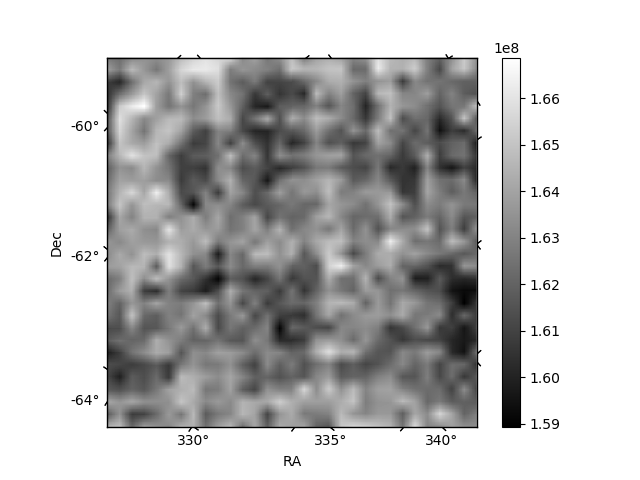
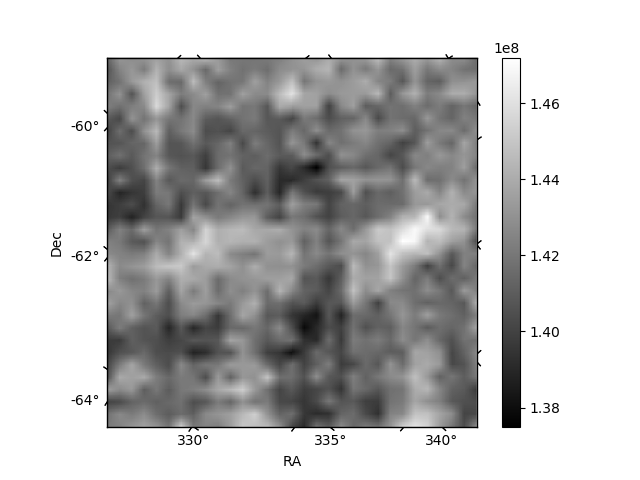
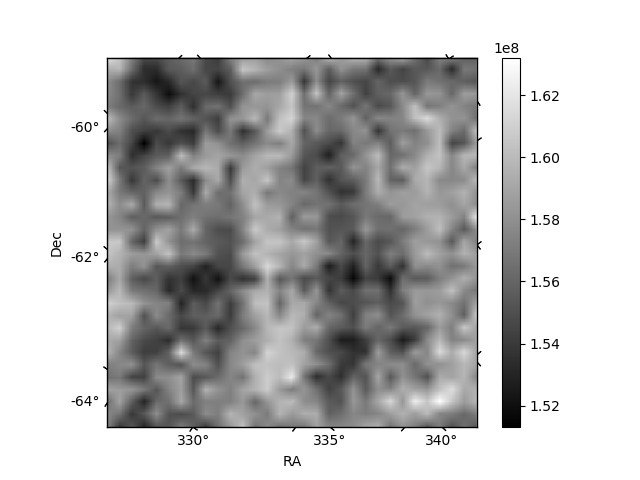
Histogram calculated using DETX and DETY for each event in the final _common_clean file
| Quadrant A | 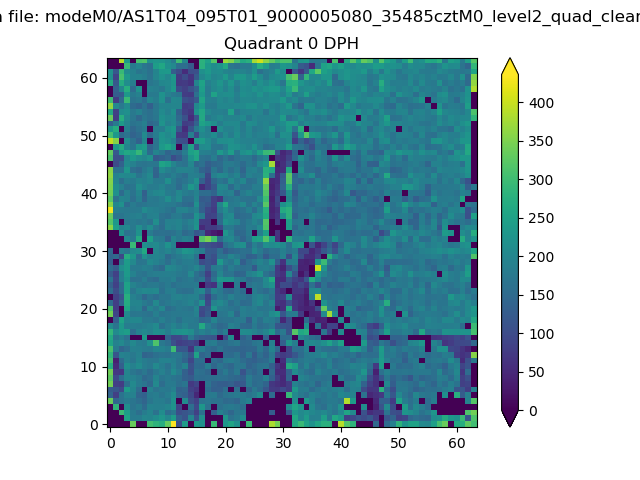 |
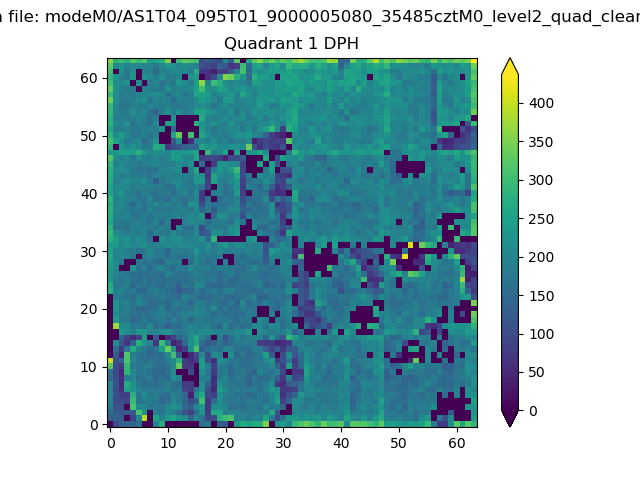 |
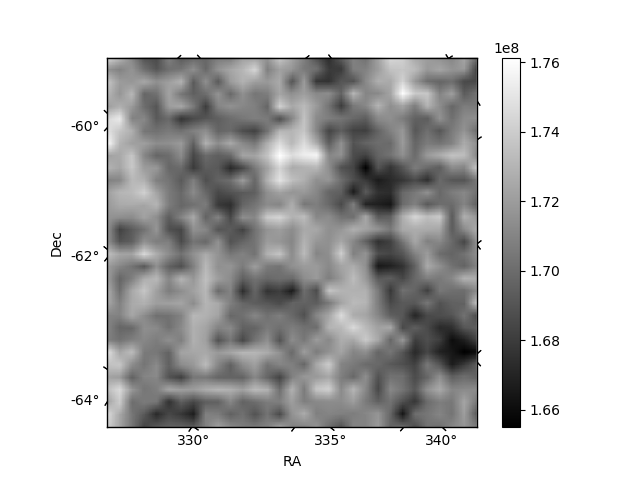
Quadrant B |
|---|---|---|---|
| Quadrant D | 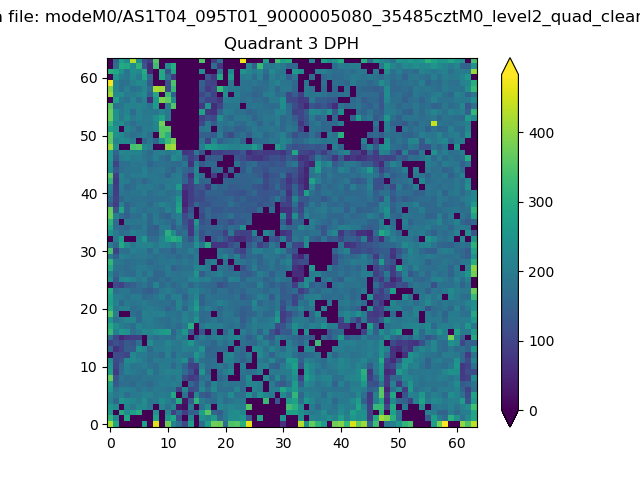 |
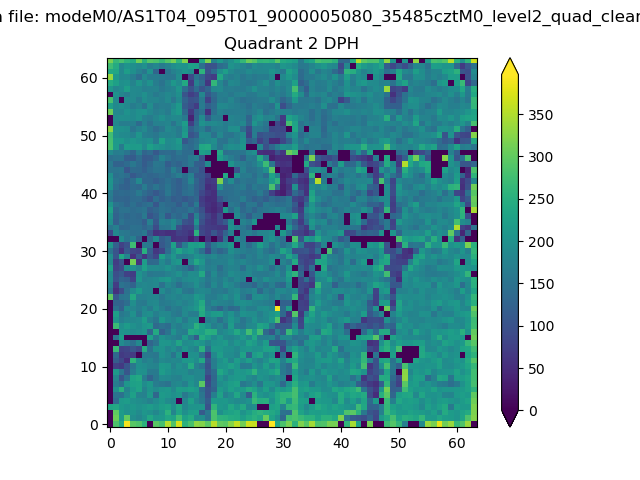 |
Quadrant C |
| Plot type | Count rate plots | Images |
|---|---|---|
| Comparison with Poisson distribution Blue bars denote a histogram of data divided into 1 sec bins. Red curve is a Poisson curve with rate = median count rate of data. |
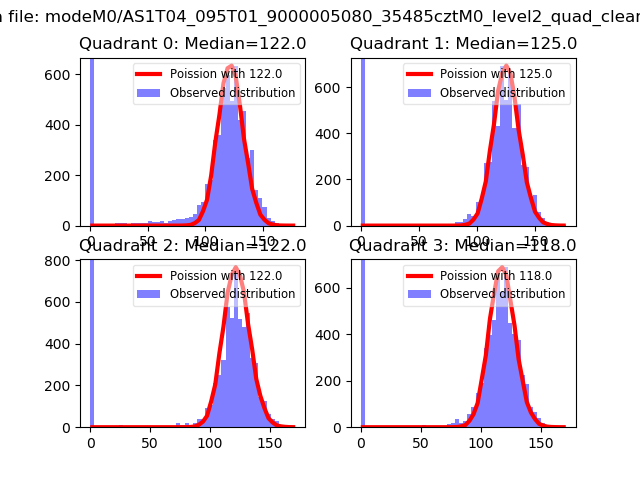 |
 |
| Quadrant-wise count rates Data is divided into 100 sec bins |
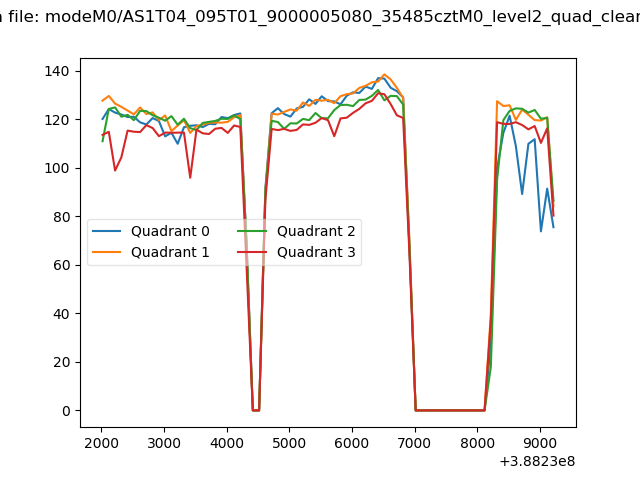 |
|
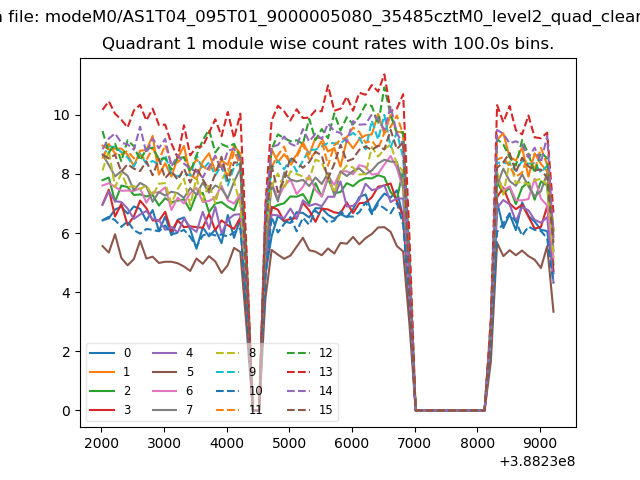
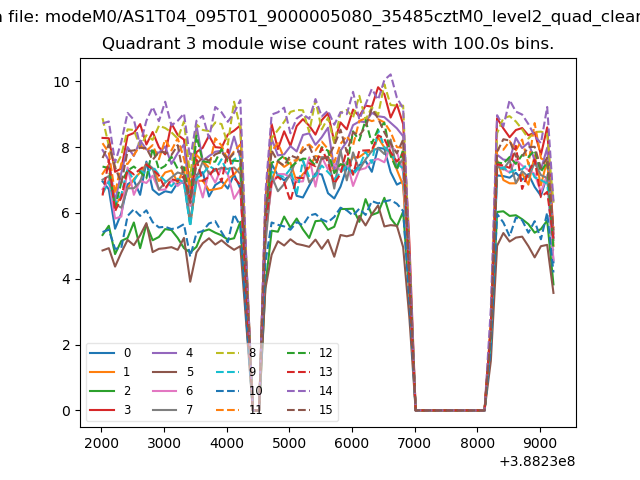
| Module-wise count rates for Quadrant A Data is divided into 100 sec bins |
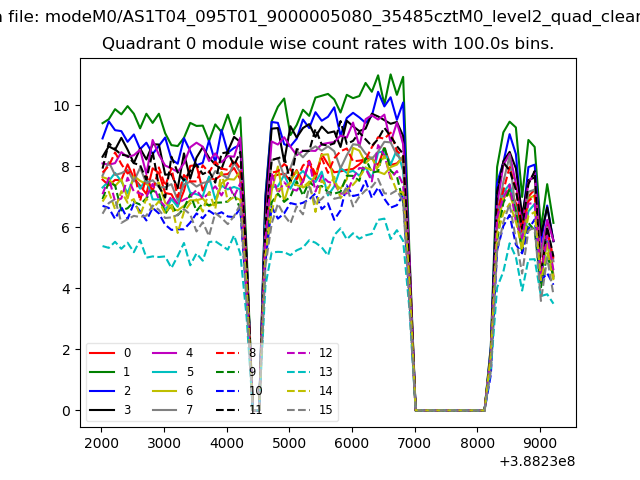 |
 |
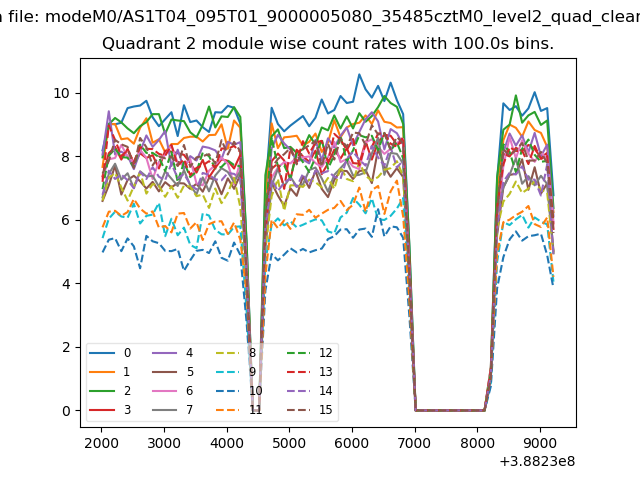
| Module-wise count rates for Quadrant B Data is divided into 100 sec bins |
 |
 |
| Module-wise count rates for Quadrant C Data is divided into 100 sec bins |
 |
 |
| Module-wise count rates for Quadrant D Data is divided into 100 sec bins |
 |
 |
| Parameter | Plot |
|---|---|
| CZT HV Monitor |  |
| D_VDD | 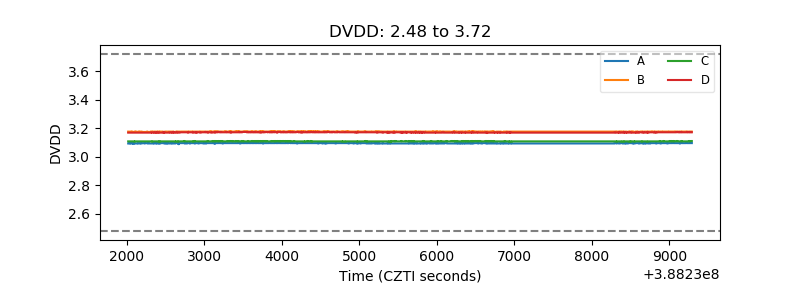 |
| Temperature 1 | 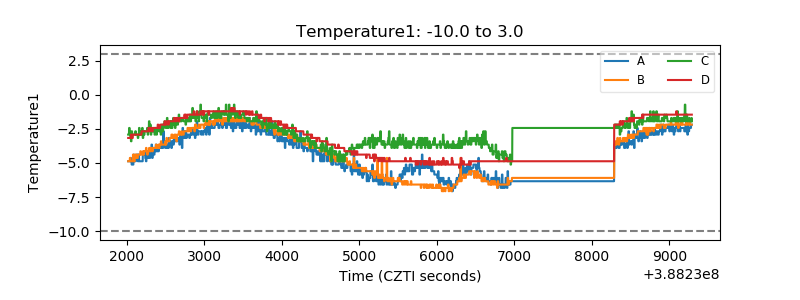 |
| Veto HV Monitor | 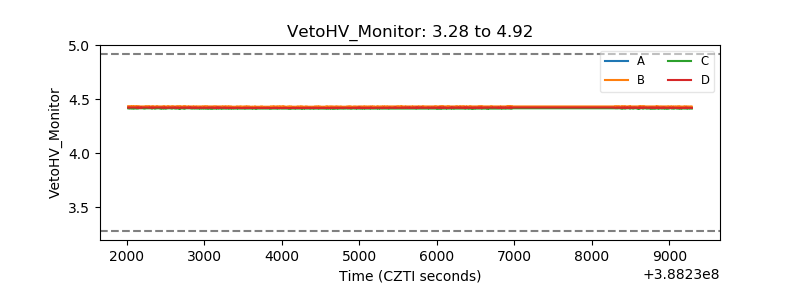 |
| Veto LLD | 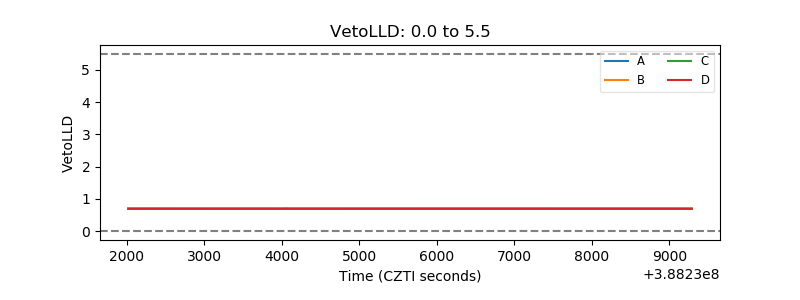 |
| Alpha Counter | 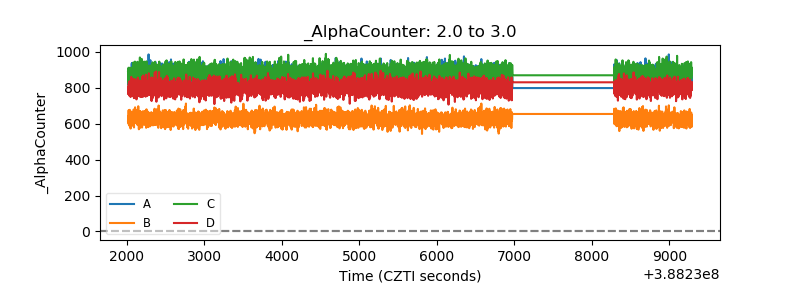 |
| _CPM_Rate | 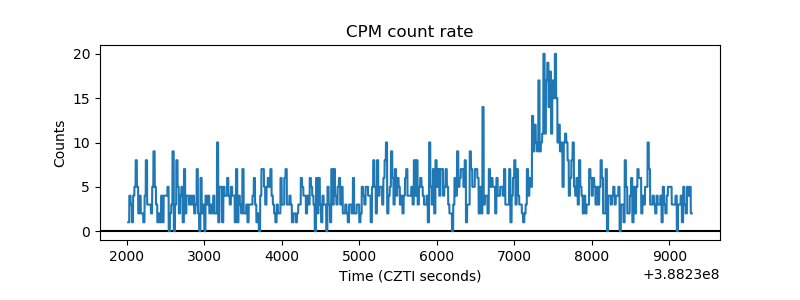 |
| CZT Counter | 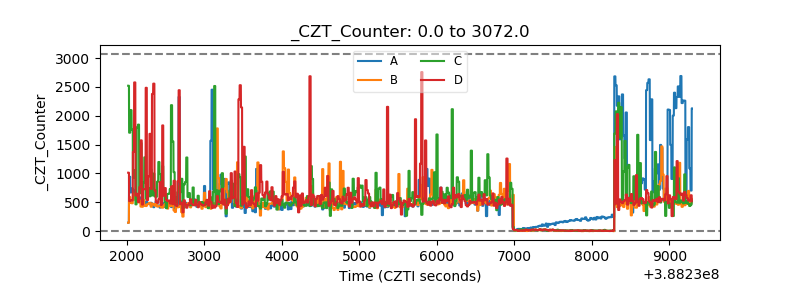 |
| +2.5 Volts monitor | 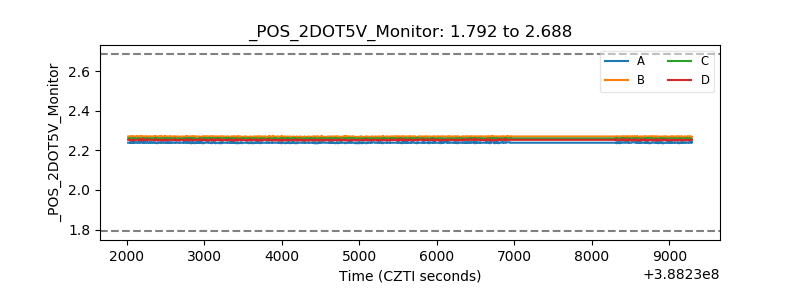 |
| +5 Volts monitor | 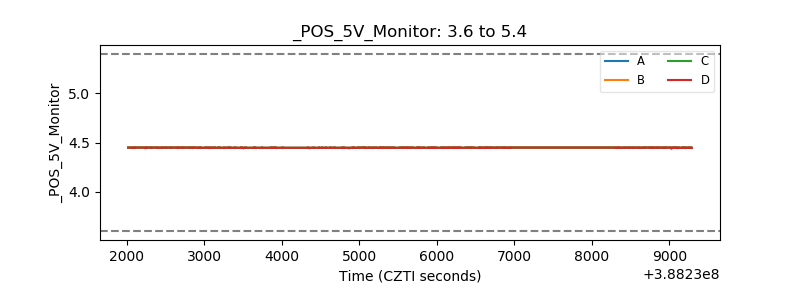 |
| _ROLL_ROT | 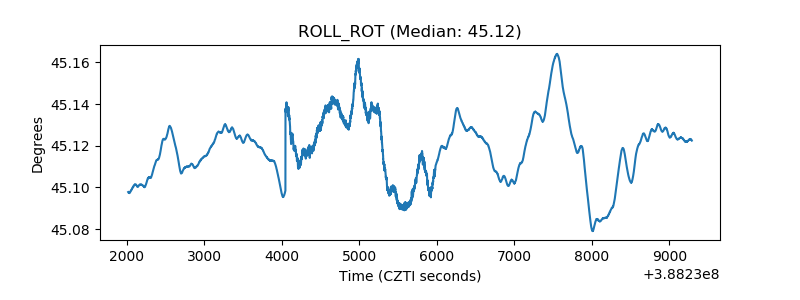 |
| _Roll_DEC | 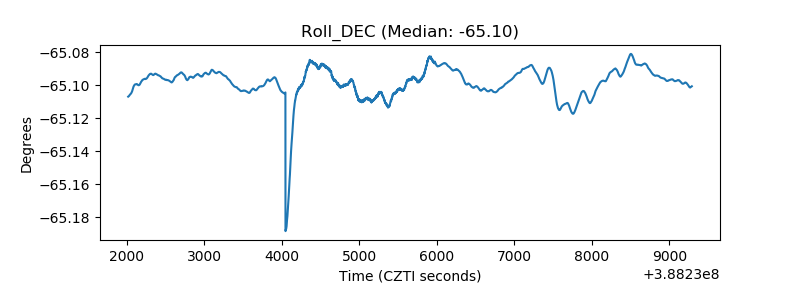 |
| _Roll_RA | 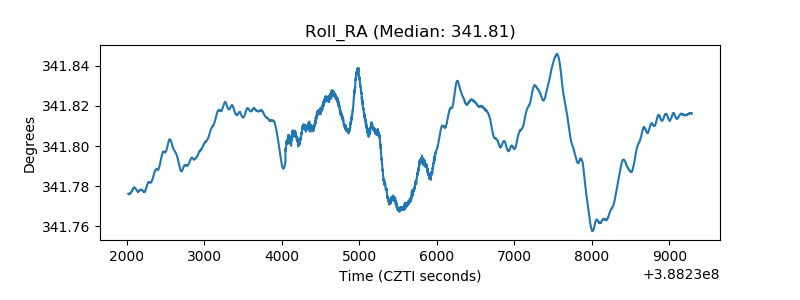 |
| Veto Counter | 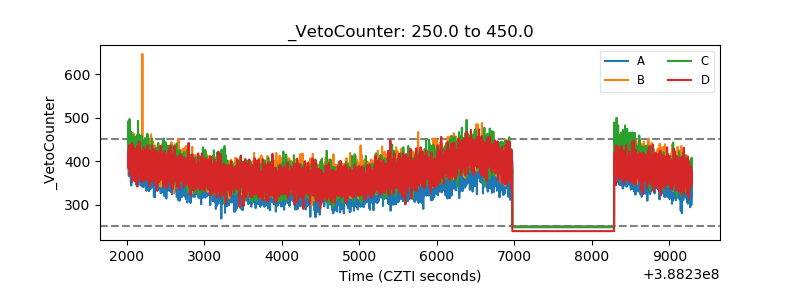 |