| Param | Original file | Final file |
|---|---|---|
| Filename | modeM0/AS1T04_095T01_9000005080_35481cztM0_level2.evt | modeM0/AS1T04_095T01_9000005080_35481cztM0_level2_quad_clean.evt |
| Size (bytes) | 529,303,680 | 93,326,400 |
| Size | 504.8 MB | 89.0 MB |
| Events in quadrant A | 2,662,090 | 664,241 |
| Events in quadrant B | 2,733,328 | 675,363 |
| Events in quadrant C | 7,320,981 | 499,005 |
| Events in quadrant D | 2,973,986 | 635,847 |
| Mode M0 | |||
|---|---|---|---|
| Quadrant | BADHDUFLAG | Total packets | Discarded packets |
| A | 0 | 10999 | 3 |
| B | 0 | 11278 | 2 |
| C | 0 | 25326 | 2 |
| D | 0 | 11978 | 2 |
| Mode M9 | |||
|---|---|---|---|
| Quadrant | BADHDUFLAG | Total packets | Discarded packets |
| A | 0 | 33 | 0 |
| B | 0 | 33 | 0 |
| C | 0 | 33 | 0 |
| D | 0 | 34 | 0 |
| Mode SS | |||
|---|---|---|---|
| Quadrant | BADHDUFLAG | Total packets | Discarded packets |
| A | 0 | 102 | 0 |
| B | 0 | 102 | 0 |
| C | 0 | 102 | 0 |
| D | 0 | 102 | 0 |
| Quadrant | Total seconds | Saturated seconds | Saturation percentage |
|---|---|---|---|
| A | 5010 | 50 | 0.998004% |
| B | 5010 | 64 | 1.277445% |
| C | 5010 | 1724 | 34.411178% |
| D | 5010 | 102 | 2.035928% |
Noise dominated data is calculated using 1-second bins in cleaned event files. If a bin has >2000 counts, and if more than 50% of those come from <1% of pixels, then it is considered to be noise-dominated and hence unusable.
| Quadrant | # 1 sec bins | Bins with >0 counts | Bins with >2000 counts | High rate bins dominated by noise | Noise dominated (total time) | Noise dominated (detector-on time) | Marked lightcurve |
|---|---|---|---|---|---|---|---|
| A | 7103 | 5011 | 56 | 56 | 0.79% | 1.12% | 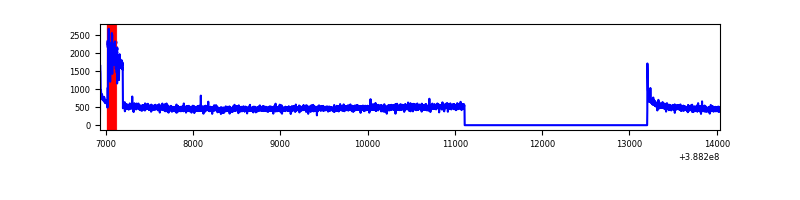 |
| B | 7103 | 5011 | 34 | 34 | 0.48% | 0.68% | 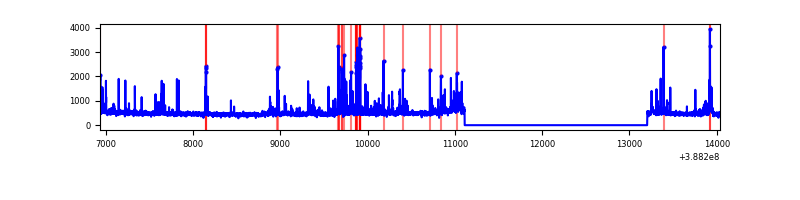 |
| C | 7103 | 5011 | 1466 | 1466 | 20.64% | 29.26% | 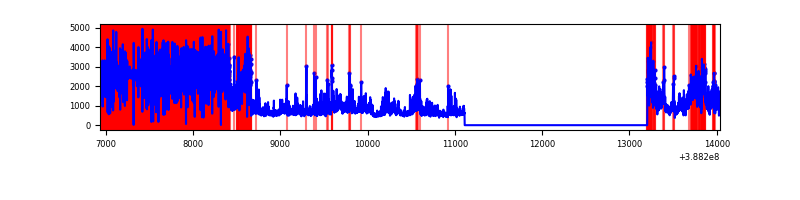 |
| D | 7103 | 5011 | 90 | 90 | 1.27% | 1.80% | 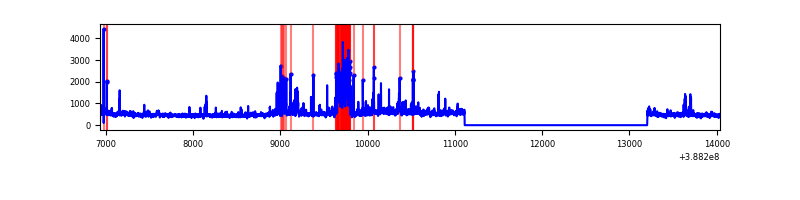 |
Top three noisy pixels from each quadrant. If the there are fewer than three noisy pixels in the level2.evt file, extra rows are filled as -1
| Pixel properties | Quadrant properties | ||||||
|---|---|---|---|---|---|---|---|
| Quadrant | DetID | PixID | Counts | Sigma | Mean | Median | Sigma |
| A | 15 | 169 | 234293 | 1973.47 | 592 | 579 | 118.4 |
| A | 10 | 83 | 130857 | 1100.06 | 592 | 579 | 118.4 |
| A | 13 | 254 | 8385 | 65.91 | 592 | 579 | 118.4 |
| B | 5 | 172 | 202153 | 1826.06 | 586 | 571 | 110.4 |
| B | 4 | 232 | 75461 | 678.4 | 586 | 571 | 110.4 |
| B | 5 | 236 | 73509 | 660.72 | 586 | 571 | 110.4 |
| C | 4 | 254 | 4943738 | 46464.82 | 459 | 462 | 106.4 |
| C | 0 | 10 | 257747 | 2418.38 | 459 | 462 | 106.4 |
| C | 15 | 214 | 167778 | 1572.7 | 459 | 462 | 106.4 |
| D | 13 | 249 | 282704 | 2018.23 | 583 | 568 | 139.8 |
| D | 8 | 195 | 140481 | 1000.85 | 583 | 568 | 139.8 |
| D | 7 | 80 | 93010 | 661.28 | 583 | 568 | 139.8 |
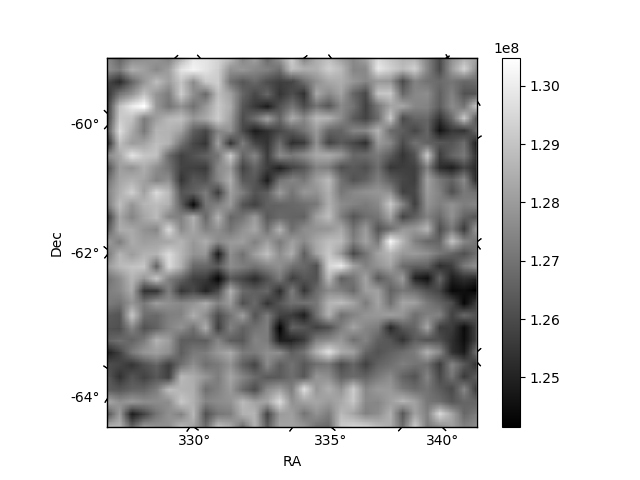
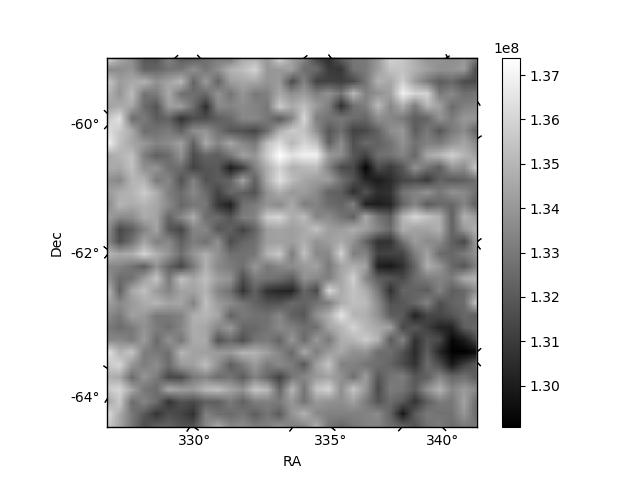
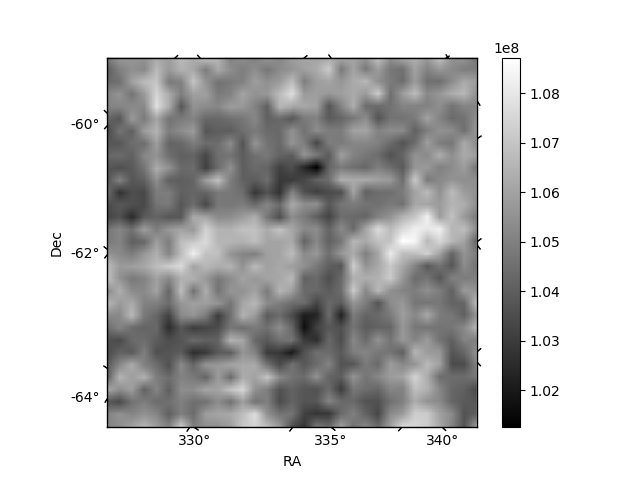
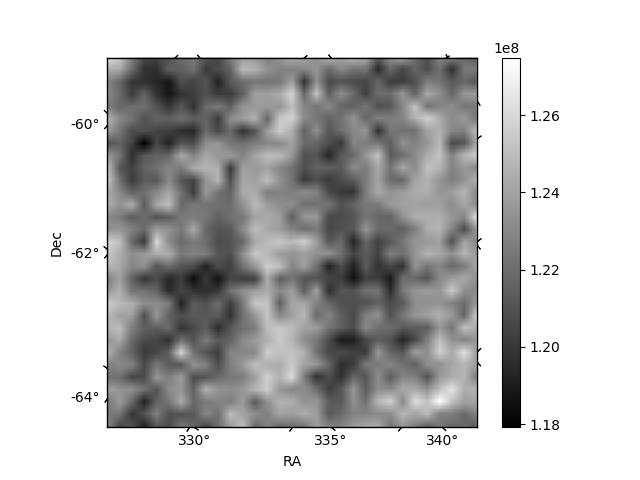
Histogram calculated using DETX and DETY for each event in the final _common_clean file
| Quadrant A | 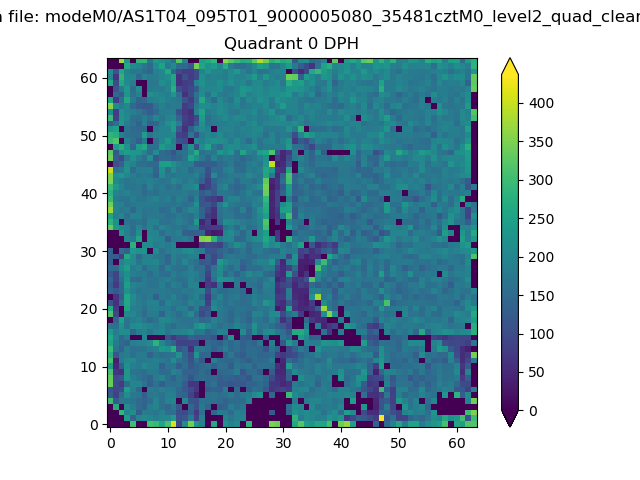 |
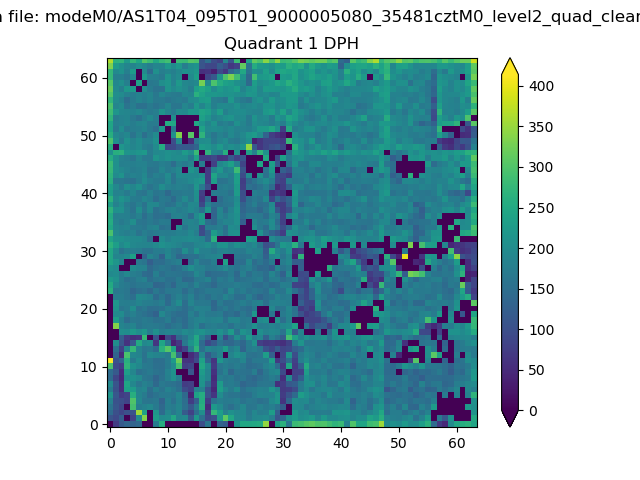 |
Quadrant B |
|---|---|---|---|
| Quadrant D | 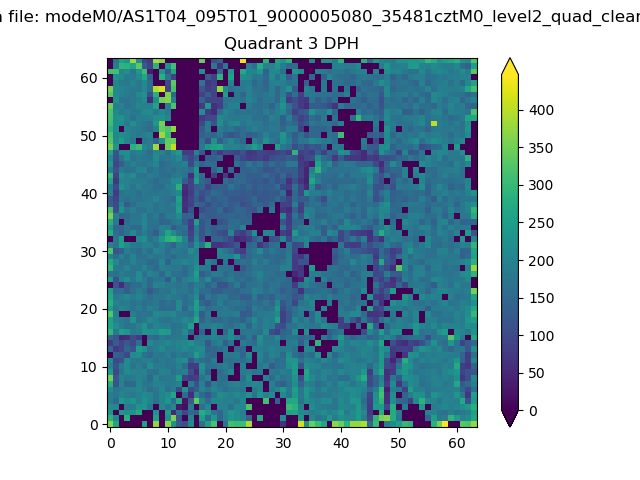 |
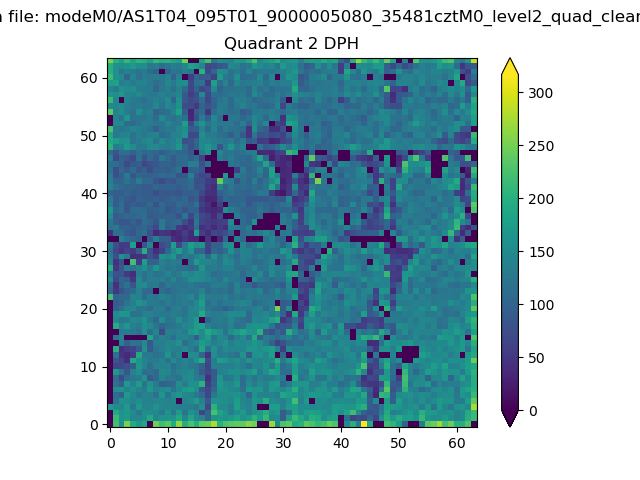 |
Quadrant C |
| Plot type | Count rate plots | Images |
|---|---|---|
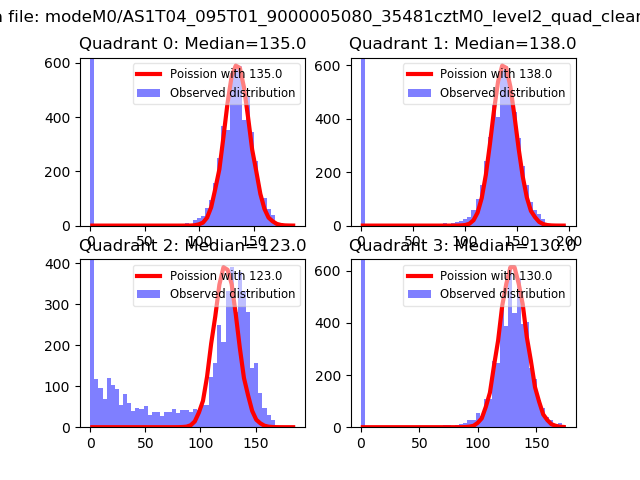
| Comparison with Poisson distribution Blue bars denote a histogram of data divided into 1 sec bins. Red curve is a Poisson curve with rate = median count rate of data. |
 |
 |
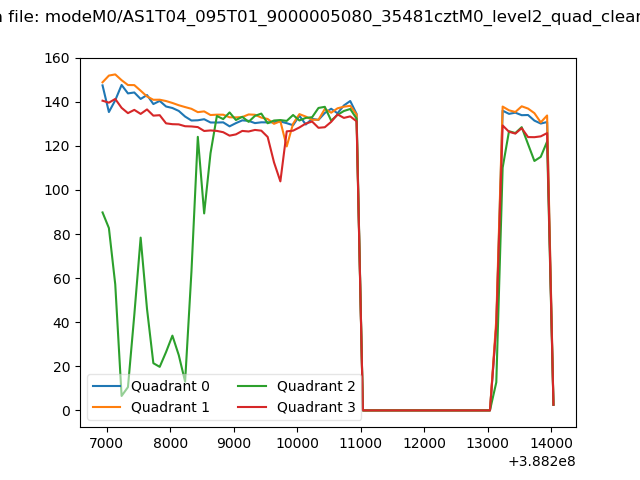
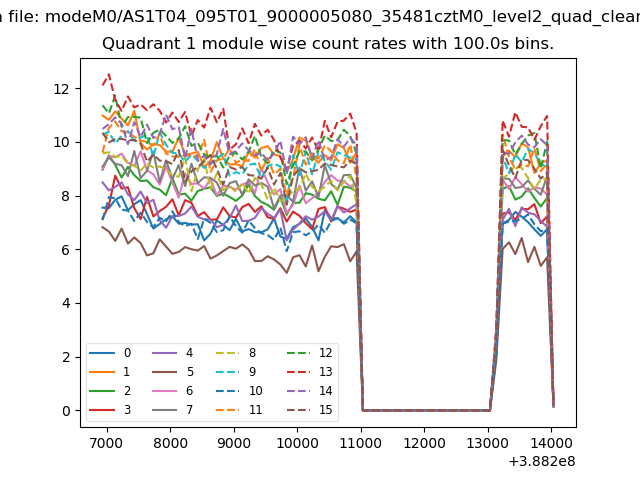
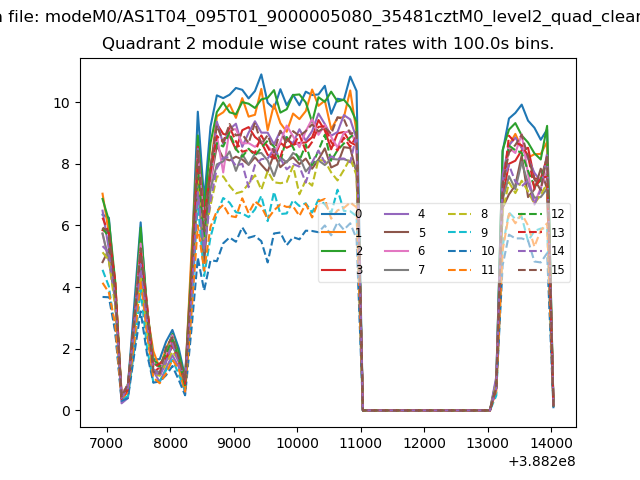
| Quadrant-wise count rates Data is divided into 100 sec bins |
 |
|
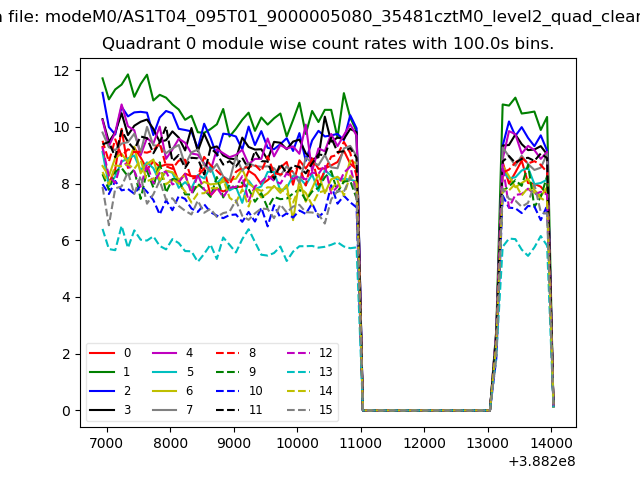
| Module-wise count rates for Quadrant A Data is divided into 100 sec bins |
 |
 |
| Module-wise count rates for Quadrant B Data is divided into 100 sec bins |
 |
 |
| Module-wise count rates for Quadrant C Data is divided into 100 sec bins |
 |
 |
| Module-wise count rates for Quadrant D Data is divided into 100 sec bins |
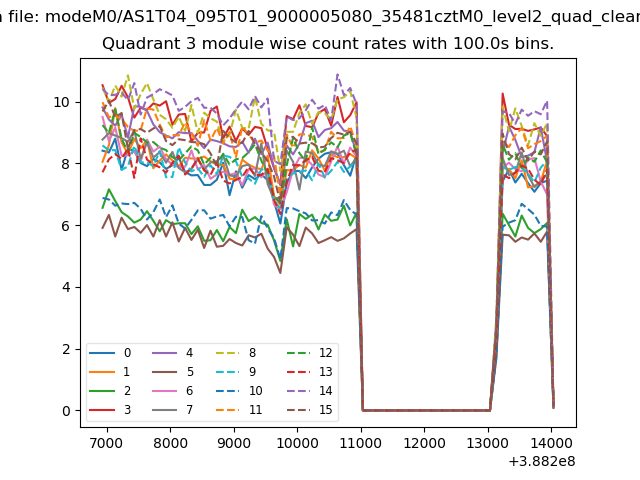 |
 |
| Parameter | Plot |
|---|---|
| CZT HV Monitor | 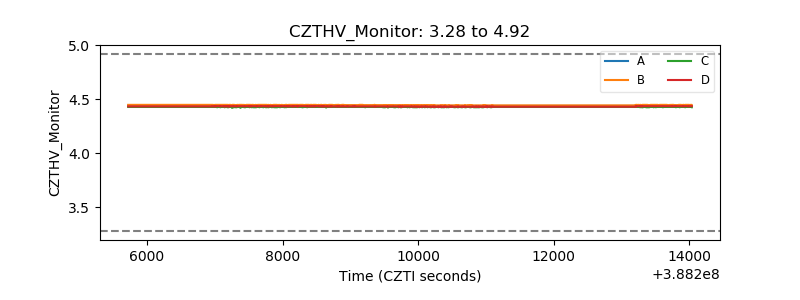 |
| D_VDD | 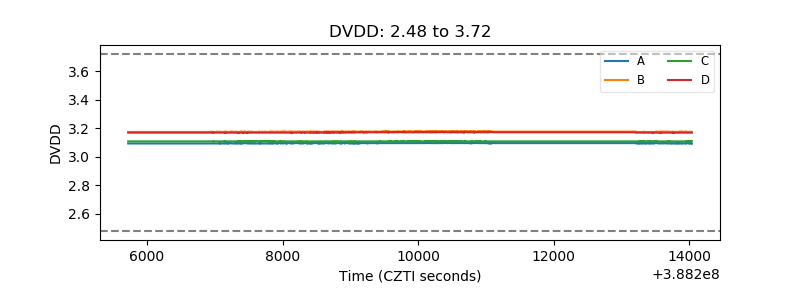 |
| Temperature 1 | 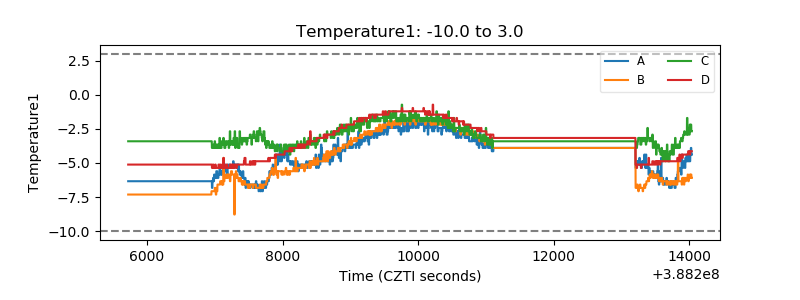 |
| Veto HV Monitor | 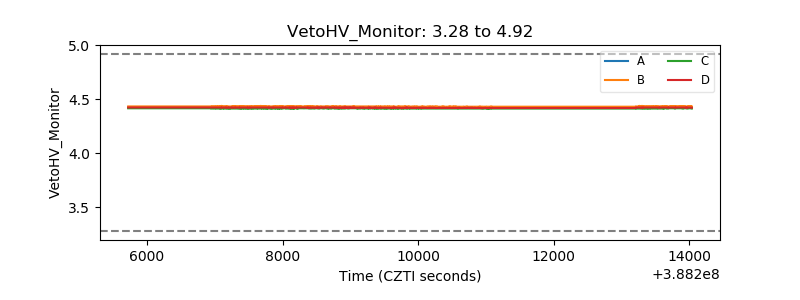 |
| Veto LLD | 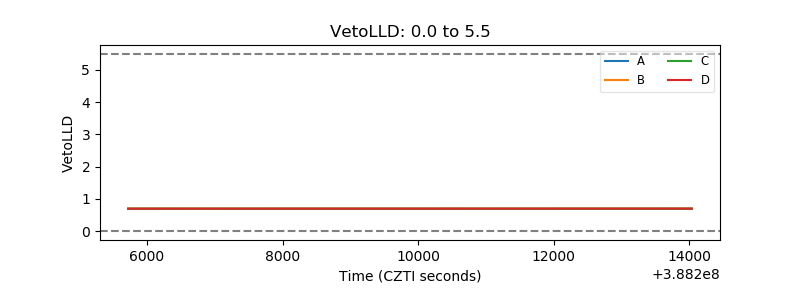 |
| Alpha Counter | 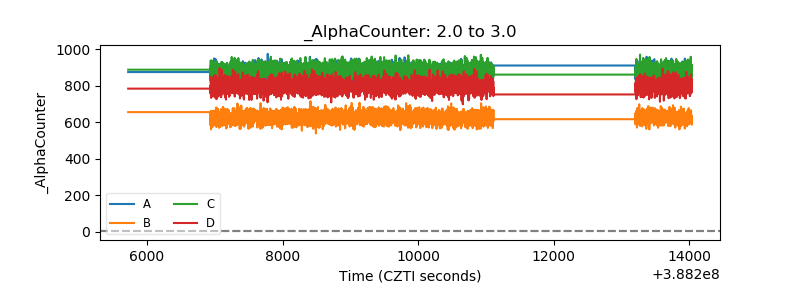 |
| _CPM_Rate | 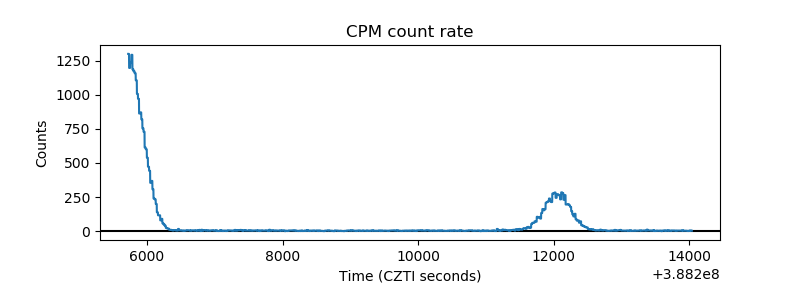 |
| CZT Counter | 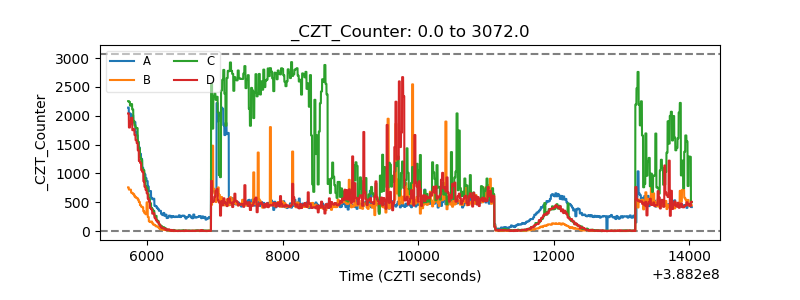 |
| +2.5 Volts monitor |  |
| +5 Volts monitor | 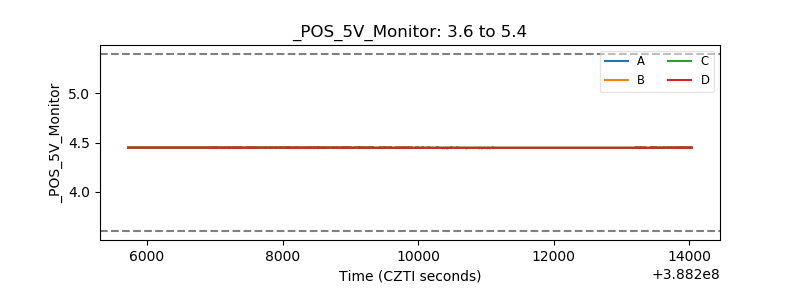 |
| _ROLL_ROT | 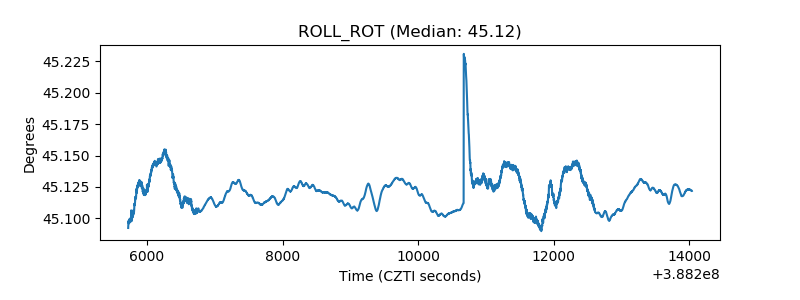 |
| _Roll_DEC | 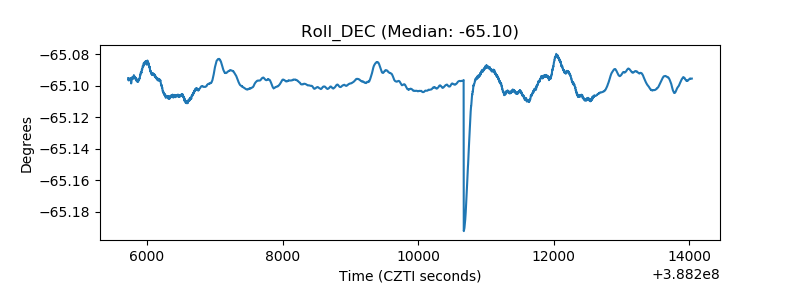 |
| _Roll_RA | 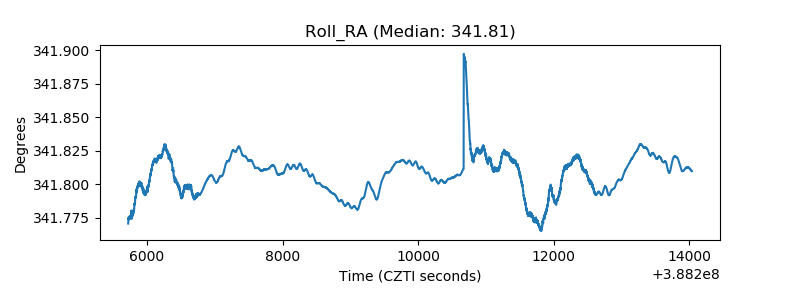 |
| Veto Counter | 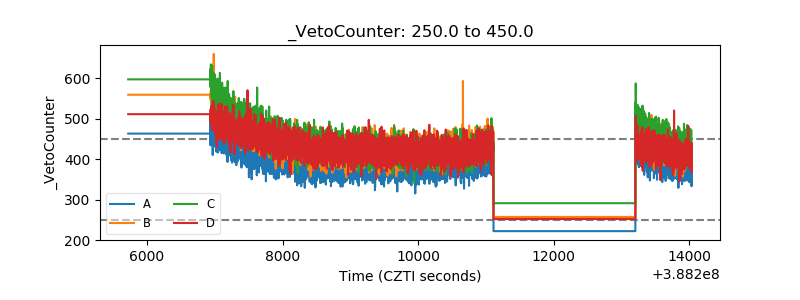 |