| Param | Original file | Final file |
|---|---|---|
| Filename | modeM0/AS1T04_095T01_9000005080_35476cztM0_level2.evt | modeM0/AS1T04_095T01_9000005080_35476cztM0_level2_quad_clean.evt |
| Size (bytes) | 695,021,760 | 94,844,160 |
| Size | 662.8 MB | 90.5 MB |
| Events in quadrant A | 2,616,826 | 711,829 |
| Events in quadrant B | 3,255,480 | 712,112 |
| Events in quadrant C | 11,433,238 | 419,020 |
| Events in quadrant D | 3,383,912 | 655,552 |
| Mode M0 | |||
|---|---|---|---|
| Quadrant | BADHDUFLAG | Total packets | Discarded packets |
| A | 0 | 11210 | 3 |
| B | 0 | 13155 | 2 |
| C | 0 | 37628 | 2 |
| D | 0 | 13593 | 2 |
| Mode M9 | |||
|---|---|---|---|
| Quadrant | BADHDUFLAG | Total packets | Discarded packets |
| A | 0 | 27 | 0 |
| B | 0 | 27 | 0 |
| C | 0 | 27 | 0 |
| D | 0 | 28 | 0 |
| Mode SS | |||
|---|---|---|---|
| Quadrant | BADHDUFLAG | Total packets | Discarded packets |
| A | 0 | 108 | 0 |
| B | 0 | 108 | 0 |
| C | 0 | 108 | 0 |
| D | 0 | 108 | 0 |
| Quadrant | Total seconds | Saturated seconds | Saturation percentage |
|---|---|---|---|
| A | 5316 | 20 | 0.376223% |
| B | 5316 | 124 | 2.332581% |
| C | 5316 | 3584 | 67.419112% |
| D | 5316 | 156 | 2.934537% |
Noise dominated data is calculated using 1-second bins in cleaned event files. If a bin has >2000 counts, and if more than 50% of those come from <1% of pixels, then it is considered to be noise-dominated and hence unusable.
| Quadrant | # 1 sec bins | Bins with >0 counts | Bins with >2000 counts | High rate bins dominated by noise | Noise dominated (total time) | Noise dominated (detector-on time) | Marked lightcurve |
|---|---|---|---|---|---|---|---|
| A | 7077 | 5317 | 8 | 8 | 0.11% | 0.15% | 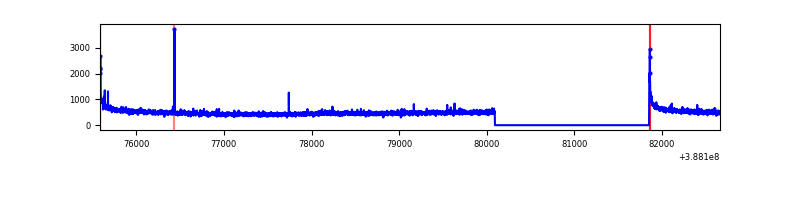 |
| B | 7077 | 5317 | 71 | 71 | 1.00% | 1.34% | 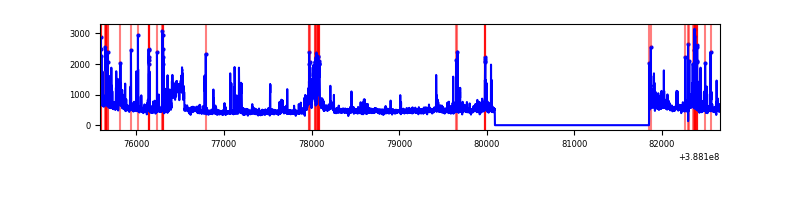 |
| C | 7077 | 5317 | 3097 | 3097 | 43.76% | 58.25% | 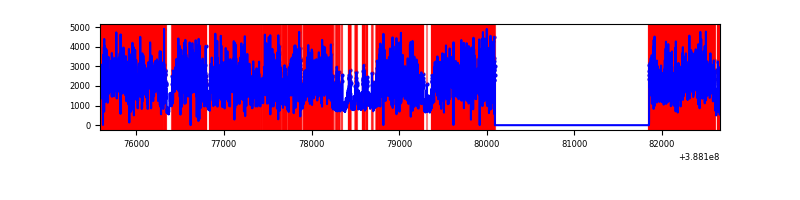 |
| D | 7077 | 5317 | 117 | 117 | 1.65% | 2.20% | 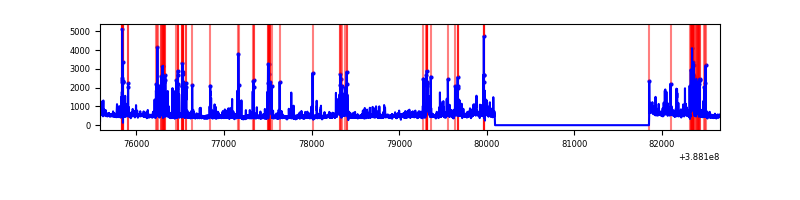 |
Top three noisy pixels from each quadrant. If the there are fewer than three noisy pixels in the level2.evt file, extra rows are filled as -1
| Pixel properties | Quadrant properties | ||||||
|---|---|---|---|---|---|---|---|
| Quadrant | DetID | PixID | Counts | Sigma | Mean | Median | Sigma |
| A | 10 | 83 | 133539 | 1056.86 | 627 | 615 | 125.8 |
| A | 8 | 6 | 15955 | 121.97 | 627 | 615 | 125.8 |
| A | 15 | 169 | 15605 | 119.18 | 627 | 615 | 125.8 |
| B | 5 | 236 | 403180 | 3466.7 | 620 | 606 | 116.1 |
| B | 5 | 200 | 164155 | 1408.37 | 620 | 606 | 116.1 |
| B | 5 | 172 | 153222 | 1314.23 | 620 | 606 | 116.1 |
| C | 4 | 254 | 9312834 | 98862.36 | 409 | 412 | 94.2 |
| C | 0 | 10 | 279107 | 2958.68 | 409 | 412 | 94.2 |
| C | 15 | 214 | 152501 | 1614.6 | 409 | 412 | 94.2 |
| D | 2 | 153 | 219324 | 1518.93 | 599 | 583 | 144.0 |
| D | 10 | 118 | 193329 | 1338.42 | 599 | 583 | 144.0 |
| D | 1 | 52 | 186153 | 1288.59 | 599 | 583 | 144.0 |
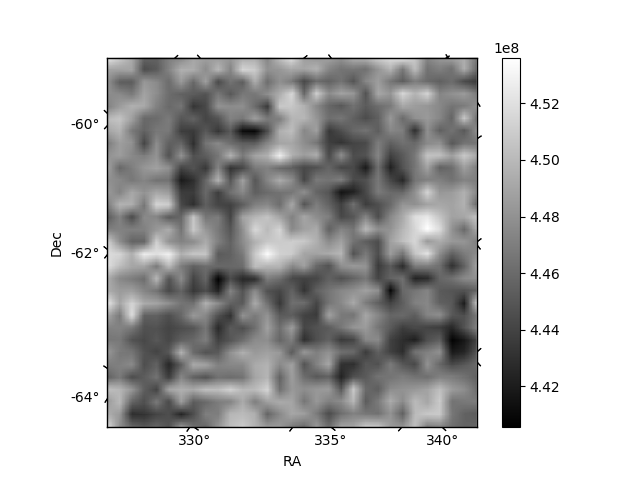
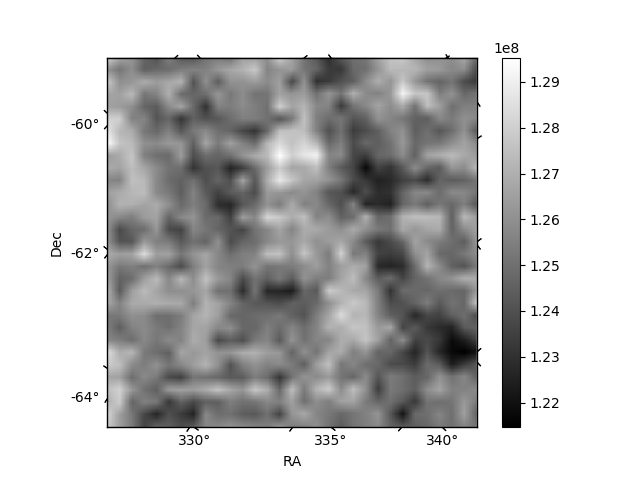
Histogram calculated using DETX and DETY for each event in the final _common_clean file
| Quadrant A | 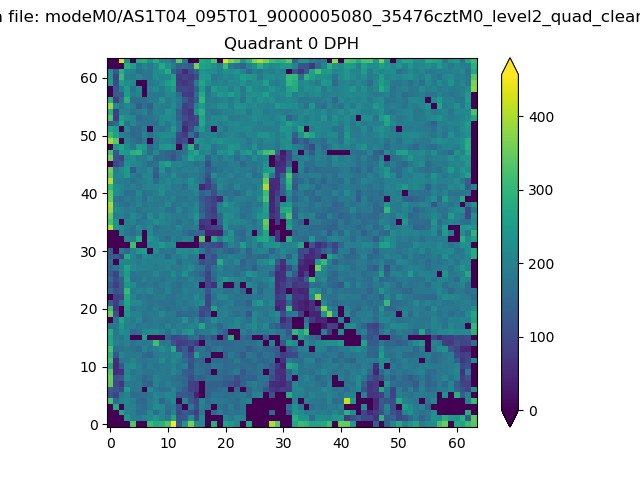 |
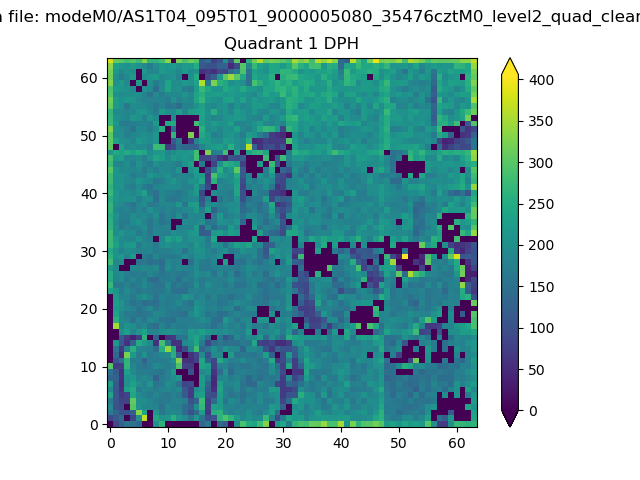 |
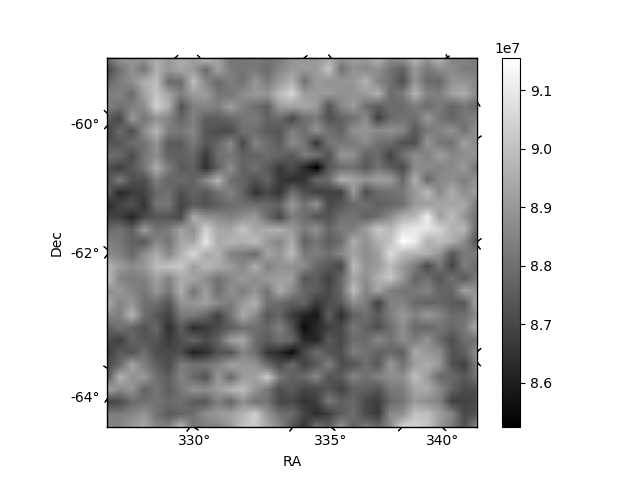
Quadrant B |
|---|---|---|---|
| Quadrant D | 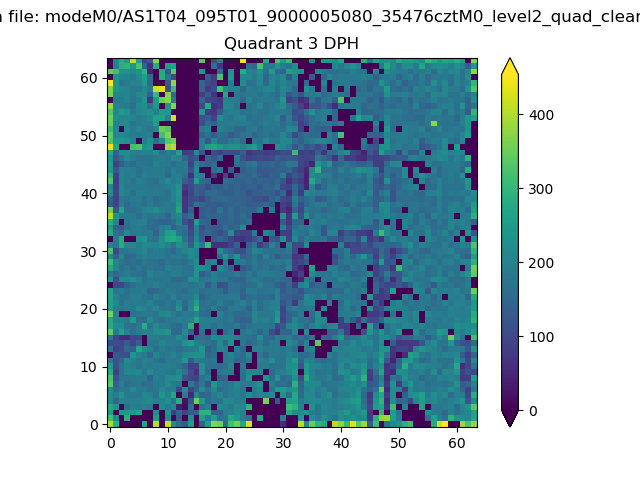 |
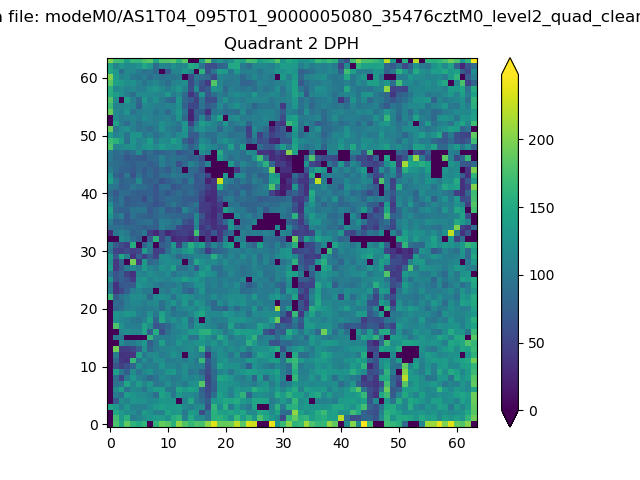 |
Quadrant C |
| Plot type | Count rate plots | Images |
|---|---|---|
| Comparison with Poisson distribution Blue bars denote a histogram of data divided into 1 sec bins. Red curve is a Poisson curve with rate = median count rate of data. |
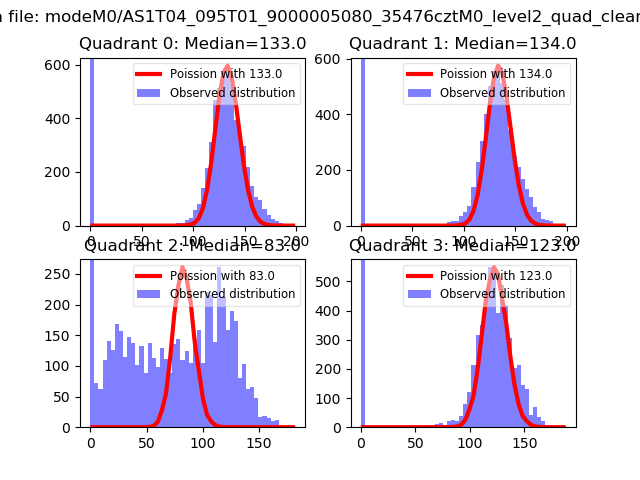 |
 |
| Quadrant-wise count rates Data is divided into 100 sec bins |
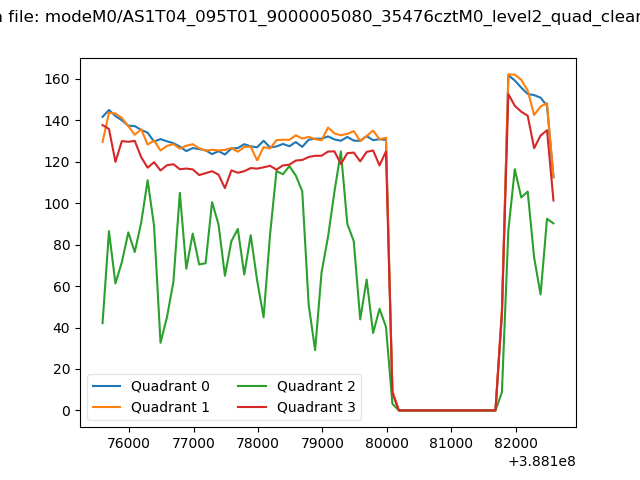 |
|
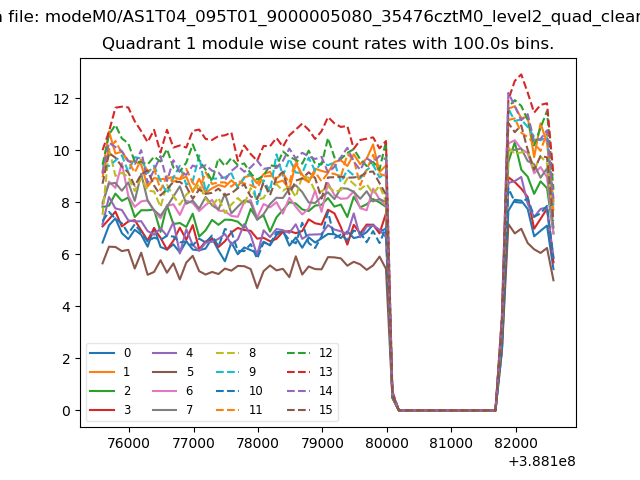
| Module-wise count rates for Quadrant A Data is divided into 100 sec bins |
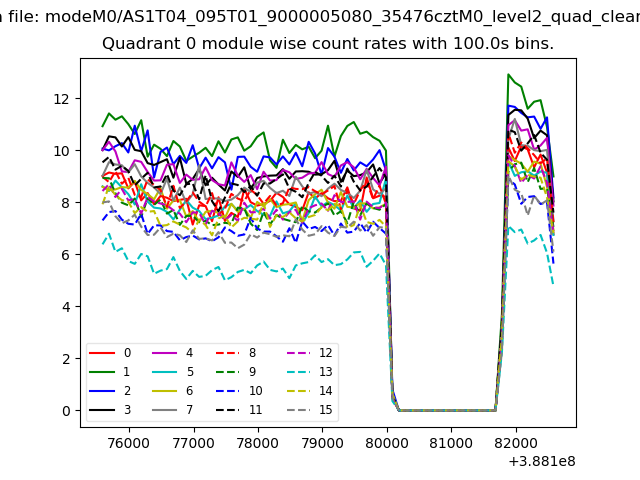 |
 |
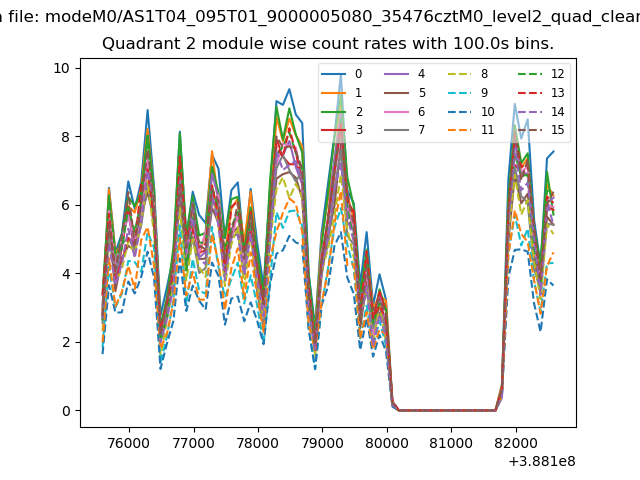
| Module-wise count rates for Quadrant B Data is divided into 100 sec bins |
 |
 |
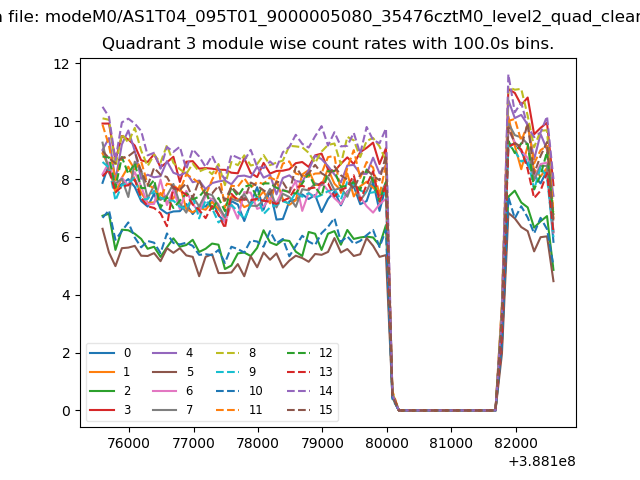
| Module-wise count rates for Quadrant C Data is divided into 100 sec bins |
 |
 |
| Module-wise count rates for Quadrant D Data is divided into 100 sec bins |
 |
 |
| Parameter | Plot |
|---|---|
| CZT HV Monitor |  |
| D_VDD | 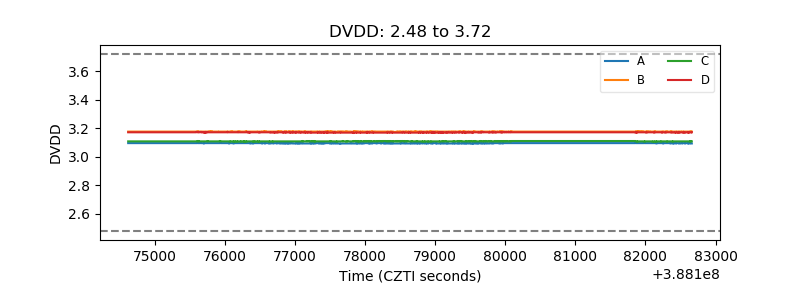 |
| Temperature 1 | 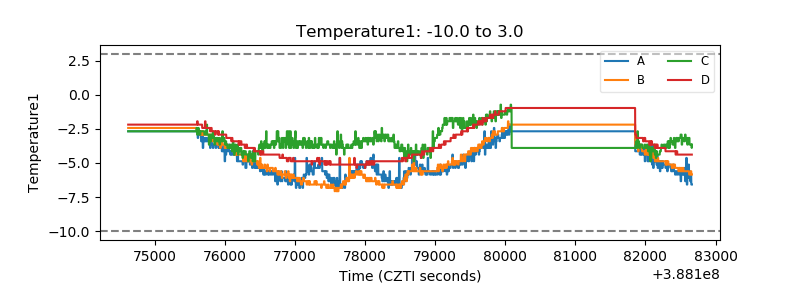 |
| Veto HV Monitor | 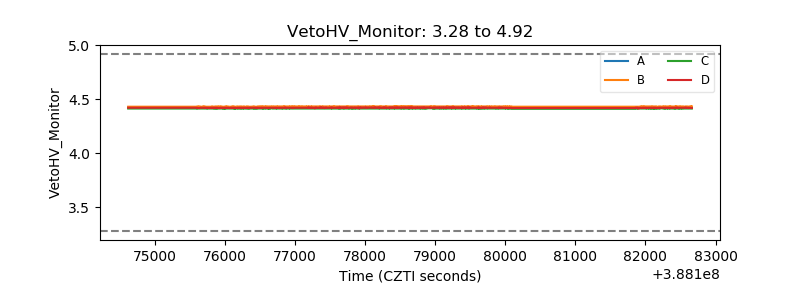 |
| Veto LLD | 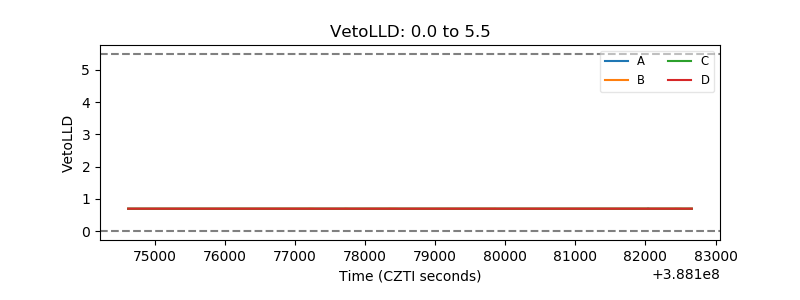 |
| Alpha Counter | 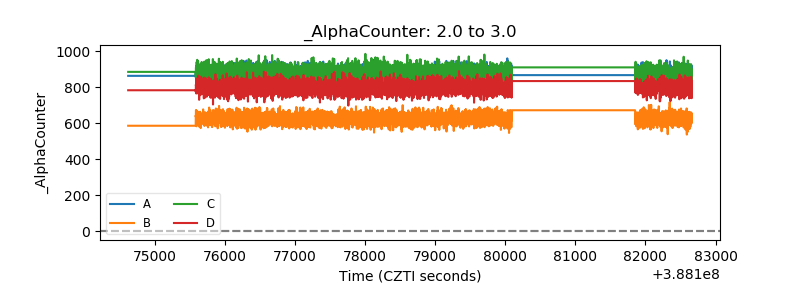 |
| _CPM_Rate | 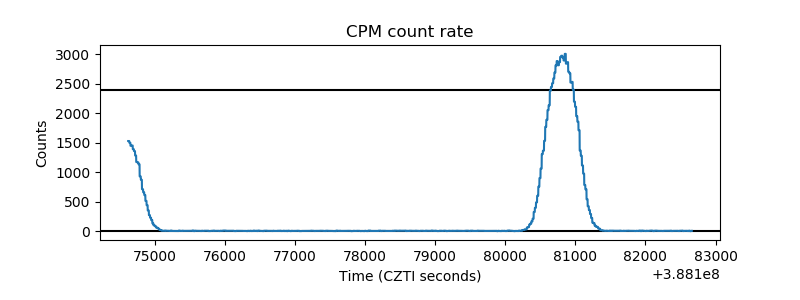 |
| CZT Counter | 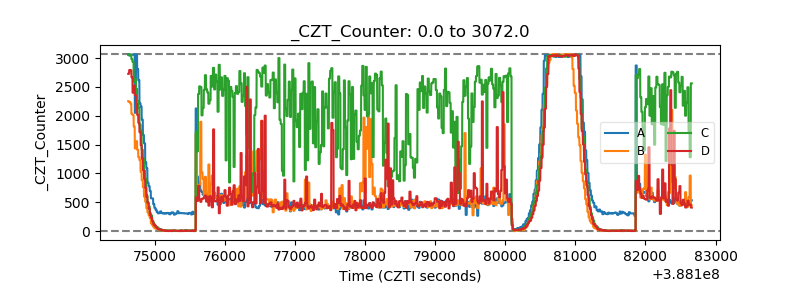 |
| +2.5 Volts monitor | 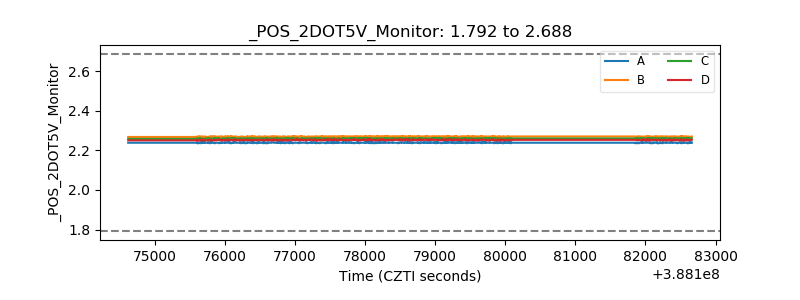 |
| +5 Volts monitor | 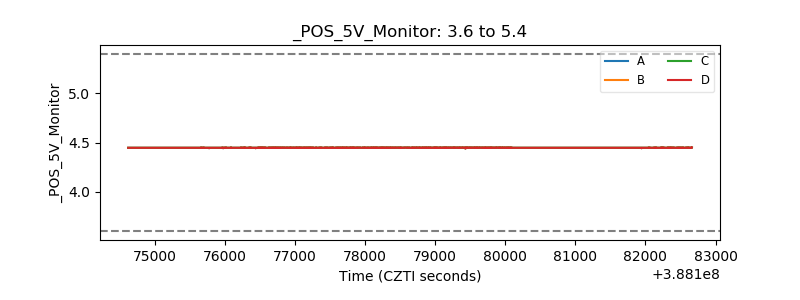 |
| _ROLL_ROT | 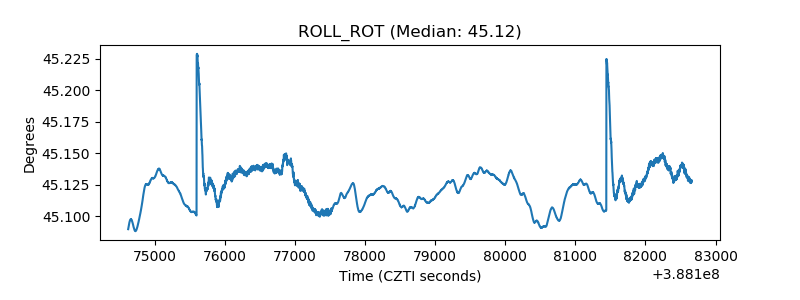 |
| _Roll_DEC | 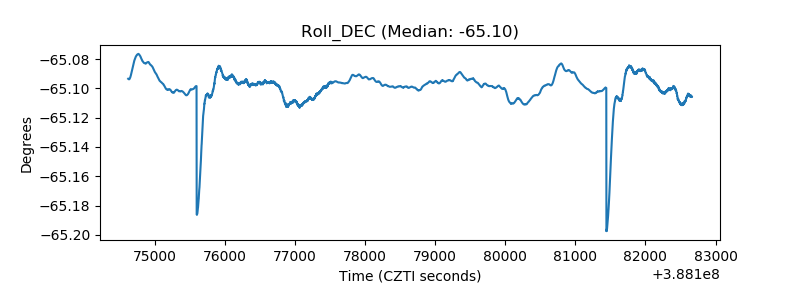 |
| _Roll_RA | 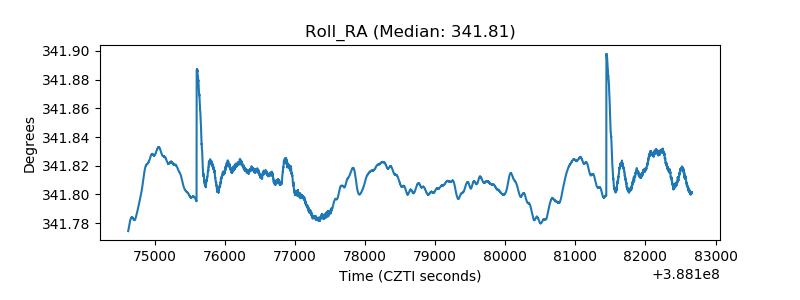 |
| Veto Counter | 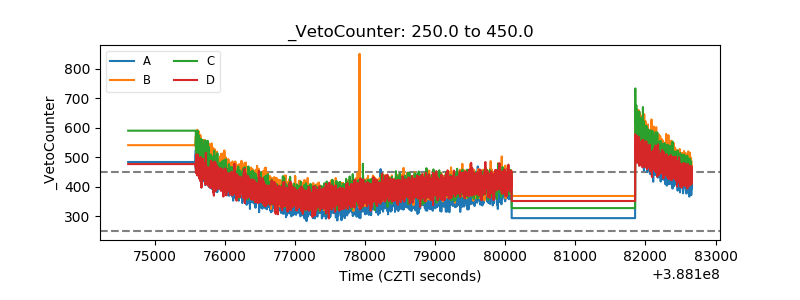 |