| Param | Original file | Final file |
|---|---|---|
| Filename | modeM0/AS1T04_095T01_9000005080_35473cztM0_level2.evt | modeM0/AS1T04_095T01_9000005080_35473cztM0_level2_quad_clean.evt |
| Size (bytes) | 1,520,755,200 | 274,628,160 |
| Size | 1.4 GB | 261.9 MB |
| Events in quadrant A | 7,418,009 | 1,917,054 |
| Events in quadrant B | 8,949,442 | 1,912,060 |
| Events in quadrant C | 19,681,541 | 1,602,845 |
| Events in quadrant D | 8,958,225 | 1,810,670 |
| Mode M0 | |||
|---|---|---|---|
| Quadrant | BADHDUFLAG | Total packets | Discarded packets |
| A | 0 | 32298 | 4 |
| B | 0 | 36736 | 3 |
| C | 0 | 69094 | 3 |
| D | 0 | 36604 | 3 |
| Mode M9 | |||
|---|---|---|---|
| Quadrant | BADHDUFLAG | Total packets | Discarded packets |
| A | 0 | 41 | 0 |
| B | 0 | 41 | 0 |
| C | 0 | 41 | 0 |
| D | 0 | 41 | 0 |
| Mode SS | |||
|---|---|---|---|
| Quadrant | BADHDUFLAG | Total packets | Discarded packets |
| A | 0 | 320 | 0 |
| B | 0 | 320 | 0 |
| C | 0 | 320 | 0 |
| D | 0 | 320 | 0 |
| Quadrant | Total seconds | Saturated seconds | Saturation percentage |
|---|---|---|---|
| A | 15555 | 59 | 0.379299% |
| B | 15555 | 402 | 2.584378% |
| C | 15555 | 4266 | 27.425265% |
| D | 15555 | 328 | 2.108647% |
Noise dominated data is calculated using 1-second bins in cleaned event files. If a bin has >2000 counts, and if more than 50% of those come from <1% of pixels, then it is considered to be noise-dominated and hence unusable.
| Quadrant | # 1 sec bins | Bins with >0 counts | Bins with >2000 counts | High rate bins dominated by noise | Noise dominated (total time) | Noise dominated (detector-on time) | Marked lightcurve |
|---|---|---|---|---|---|---|---|
| A | 19764 | 15558 | 28 | 28 | 0.14% | 0.18% | 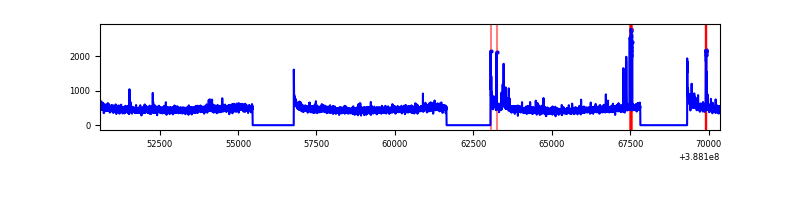 |
| B | 19764 | 15558 | 232 | 232 | 1.17% | 1.49% | 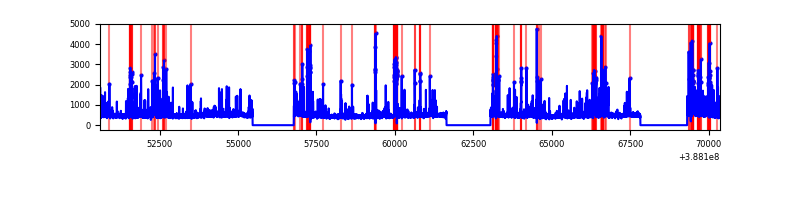 |
| C | 19764 | 15558 | 3642 | 3642 | 18.43% | 23.41% | 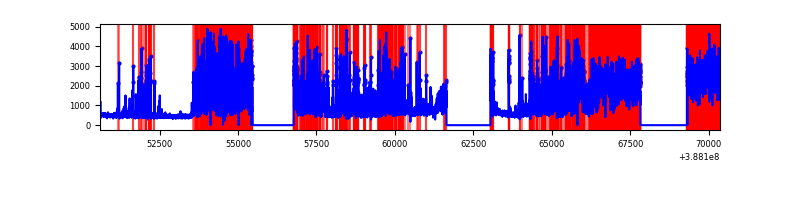 |
| D | 19764 | 15558 | 259 | 259 | 1.31% | 1.66% | 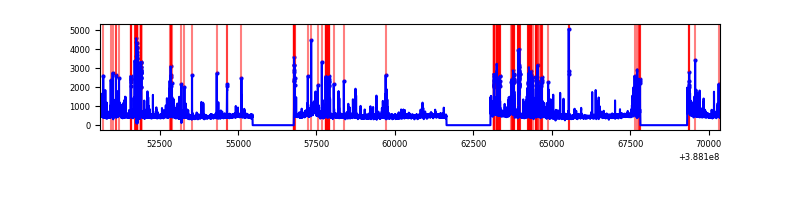 |
Top three noisy pixels from each quadrant. If the there are fewer than three noisy pixels in the level2.evt file, extra rows are filled as -1
| Pixel properties | Quadrant properties | ||||||
|---|---|---|---|---|---|---|---|
| Quadrant | DetID | PixID | Counts | Sigma | Mean | Median | Sigma |
| A | 10 | 83 | 305402 | 854.26 | 1771 | 1735 | 355.5 |
| A | 15 | 169 | 174193 | 485.15 | 1771 | 1735 | 355.5 |
| A | 13 | 6 | 41479 | 111.81 | 1771 | 1735 | 355.5 |
| B | 5 | 236 | 968121 | 2914.36 | 1745 | 1698 | 331.6 |
| B | 5 | 172 | 700342 | 2106.84 | 1745 | 1698 | 331.6 |
| B | 5 | 200 | 131228 | 390.61 | 1745 | 1698 | 331.6 |
| C | 4 | 254 | 12193540 | 35188.92 | 1508 | 1516 | 346.5 |
| C | 15 | 214 | 567339 | 1633.09 | 1508 | 1516 | 346.5 |
| C | 0 | 10 | 494039 | 1421.53 | 1508 | 1516 | 346.5 |
| D | 8 | 195 | 464022 | 1121.77 | 1705 | 1655 | 412.2 |
| D | 10 | 118 | 425037 | 1027.19 | 1705 | 1655 | 412.2 |
| D | 13 | 249 | 337152 | 813.97 | 1705 | 1655 | 412.2 |
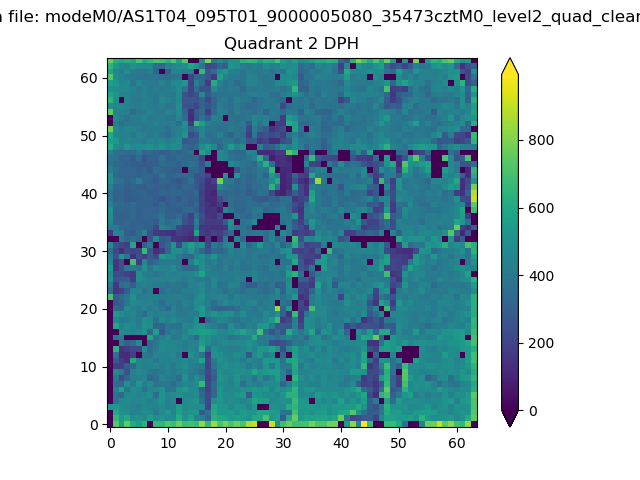
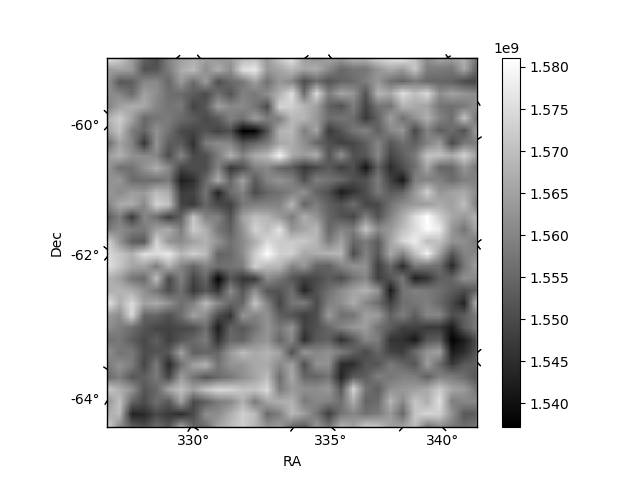
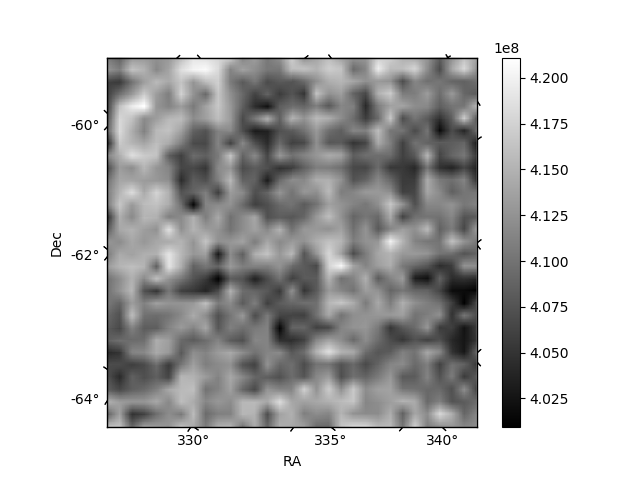
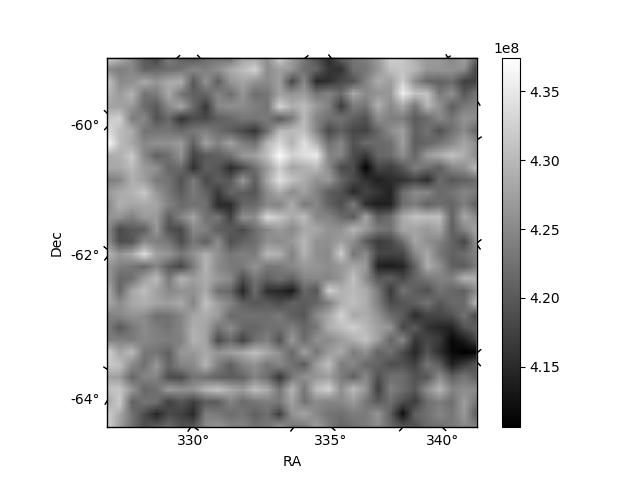
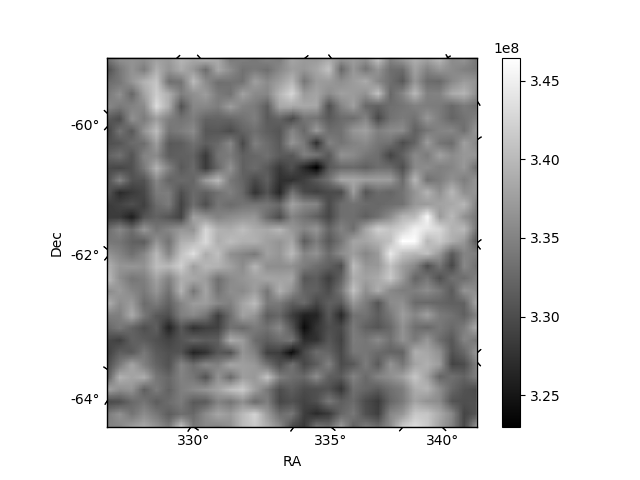
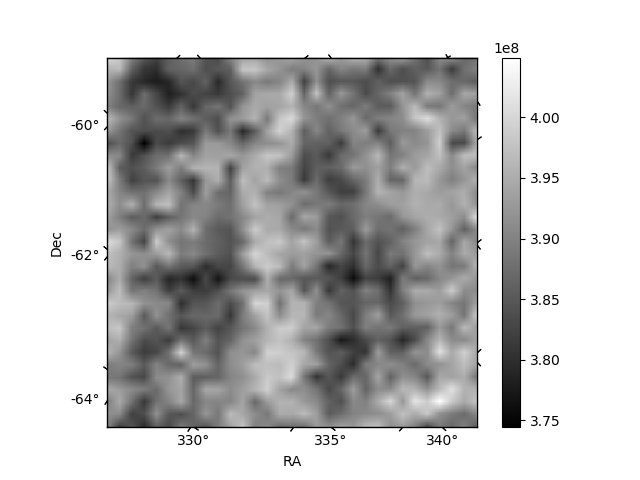
Histogram calculated using DETX and DETY for each event in the final _common_clean file
| Quadrant A | 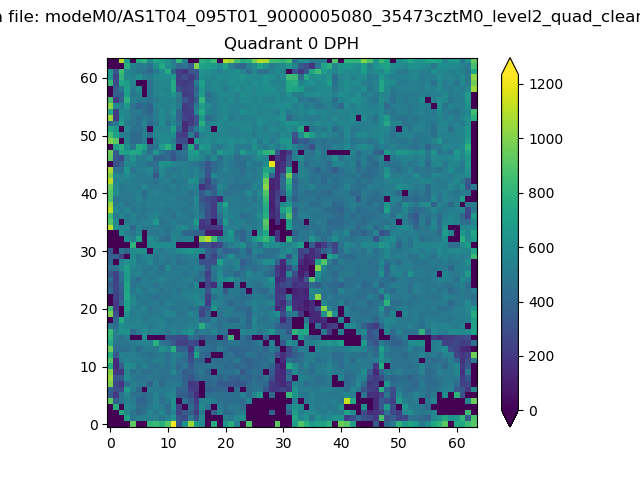 |
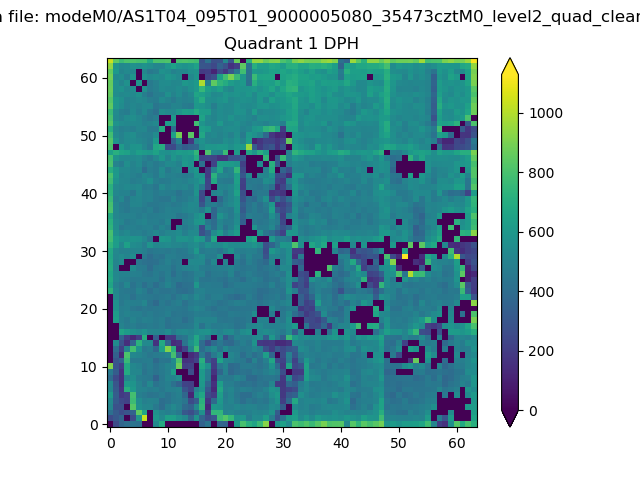 |
Quadrant B |
|---|---|---|---|
| Quadrant D | 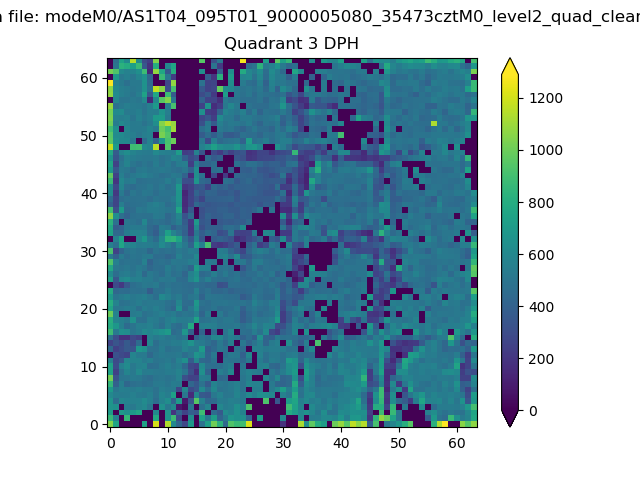 |
 |
Quadrant C |
| Plot type | Count rate plots | Images |
|---|---|---|
| Comparison with Poisson distribution Blue bars denote a histogram of data divided into 1 sec bins. Red curve is a Poisson curve with rate = median count rate of data. |
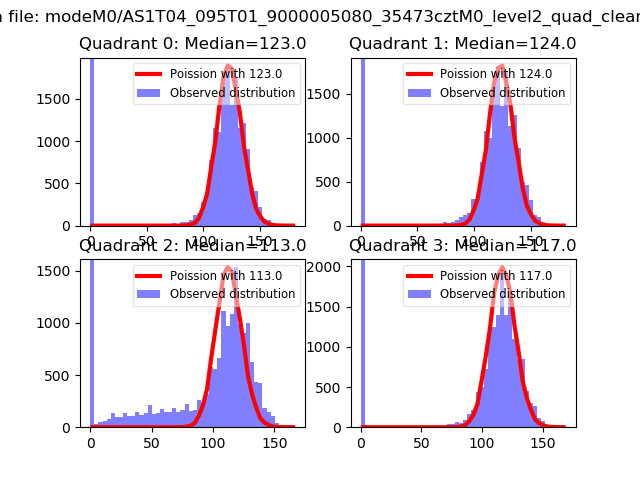 |
 |
| Quadrant-wise count rates Data is divided into 100 sec bins |
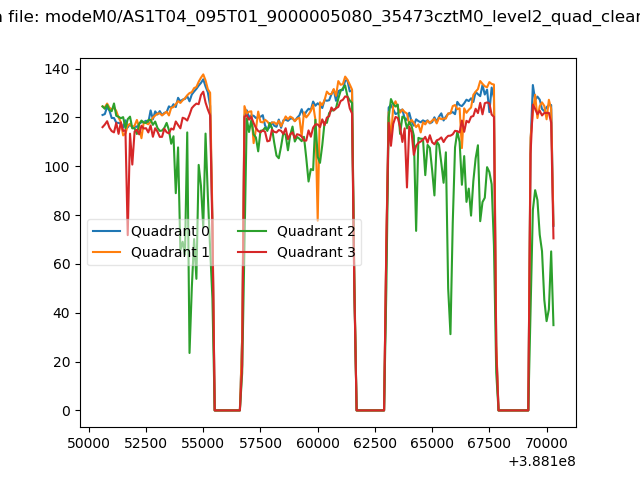 |
|
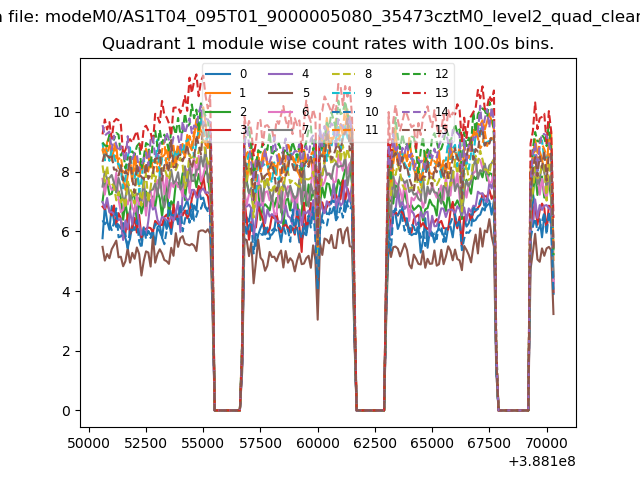
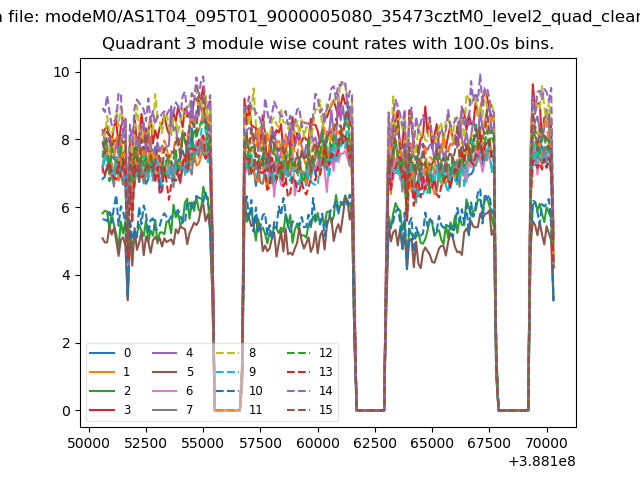
| Module-wise count rates for Quadrant A Data is divided into 100 sec bins |
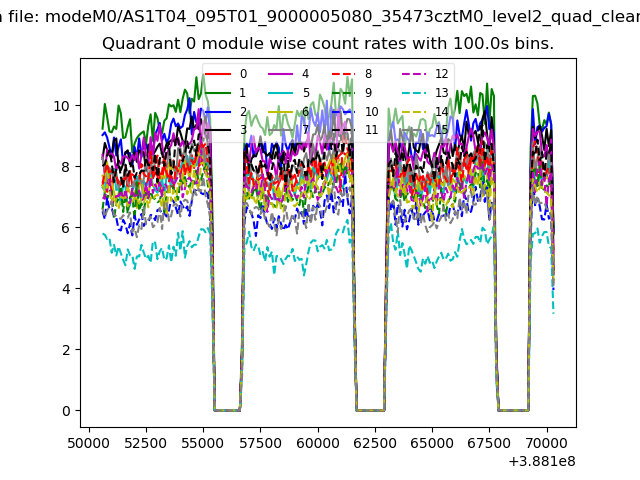 |
 |
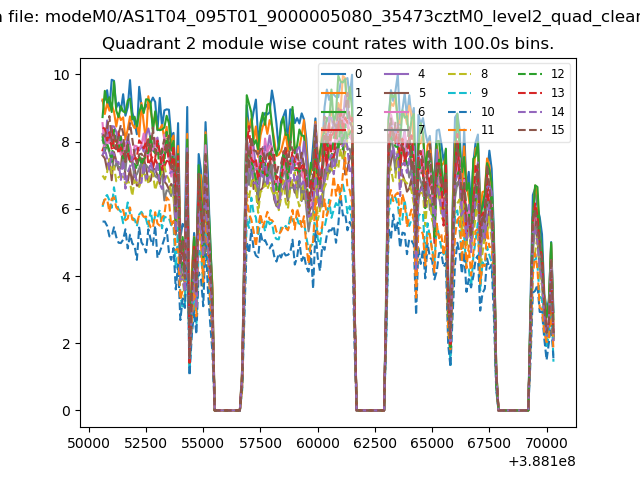
| Module-wise count rates for Quadrant B Data is divided into 100 sec bins |
 |
 |
| Module-wise count rates for Quadrant C Data is divided into 100 sec bins |
 |
 |
| Module-wise count rates for Quadrant D Data is divided into 100 sec bins |
 |
 |
| Parameter | Plot |
|---|---|
| CZT HV Monitor | 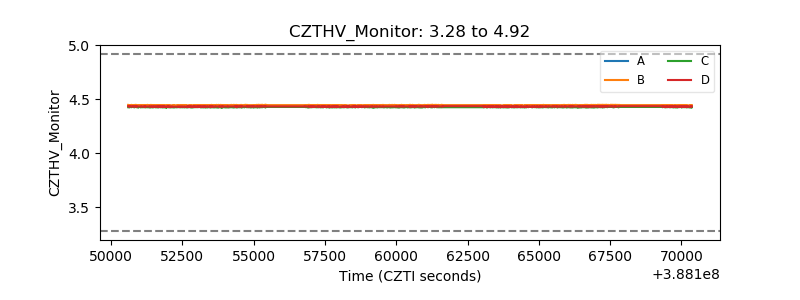 |
| D_VDD | 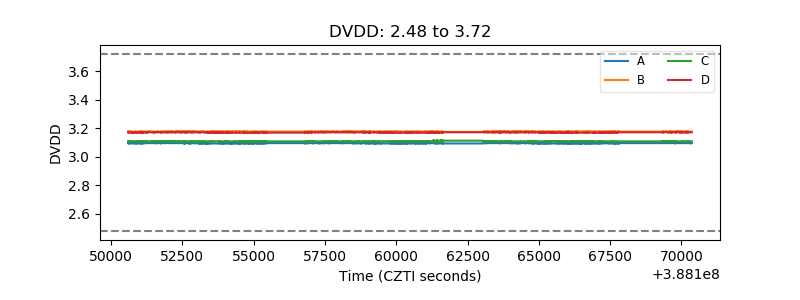 |
| Temperature 1 | 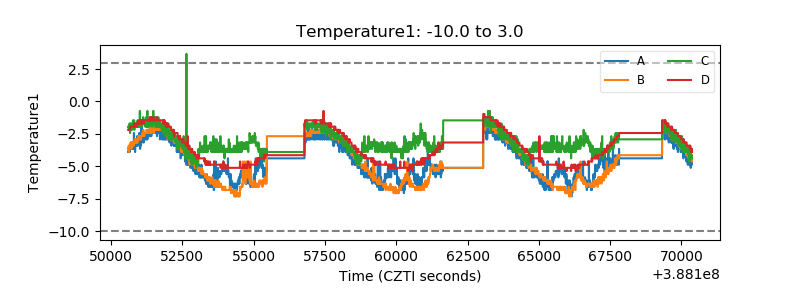 |
| Veto HV Monitor | 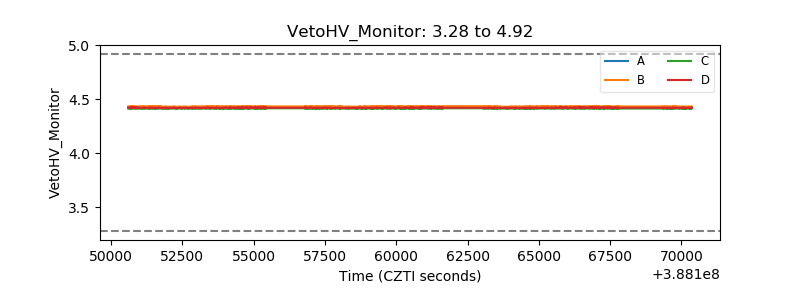 |
| Veto LLD | 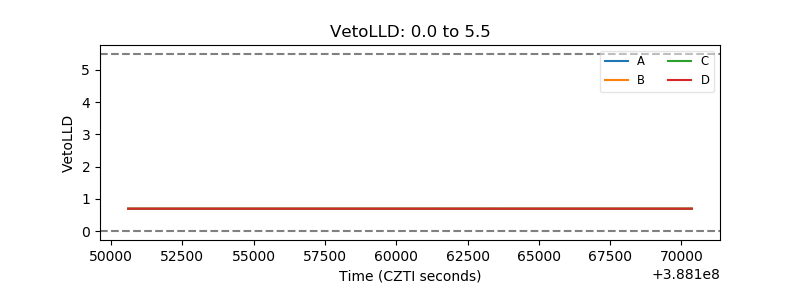 |
| Alpha Counter | 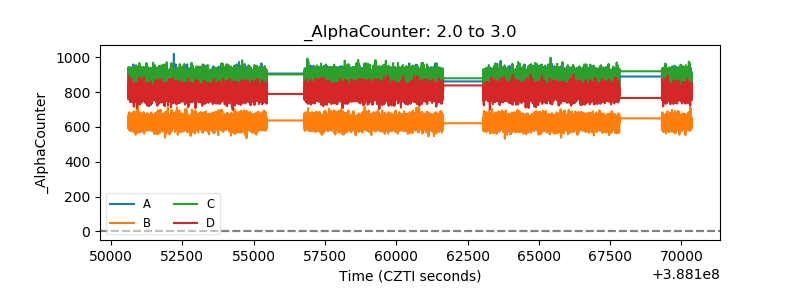 |
| _CPM_Rate | 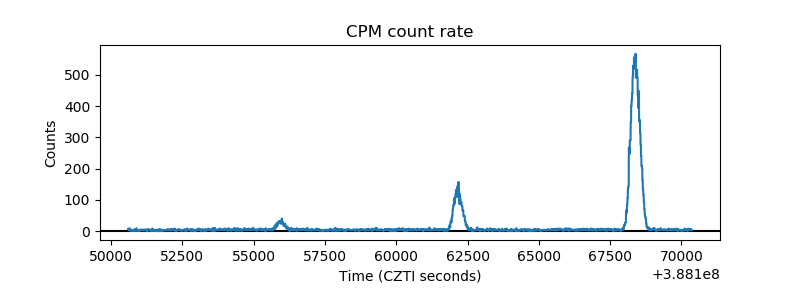 |
| CZT Counter | 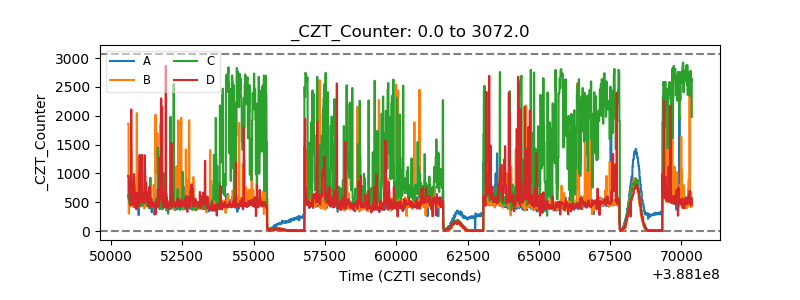 |
| +2.5 Volts monitor | 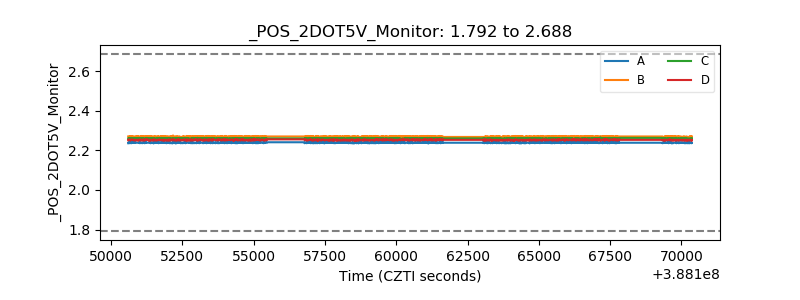 |
| +5 Volts monitor | 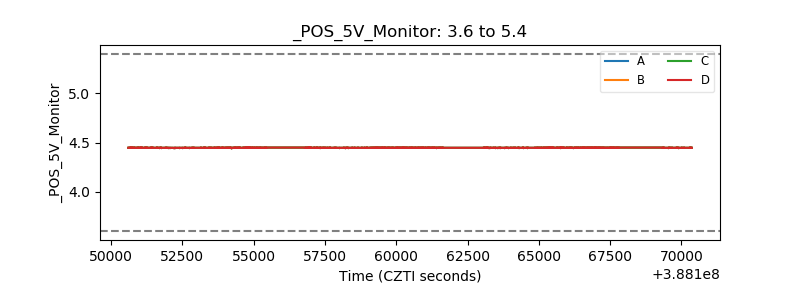 |
| _ROLL_ROT | 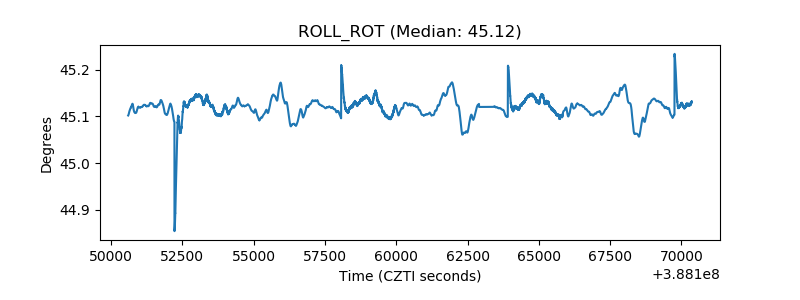 |
| _Roll_DEC | 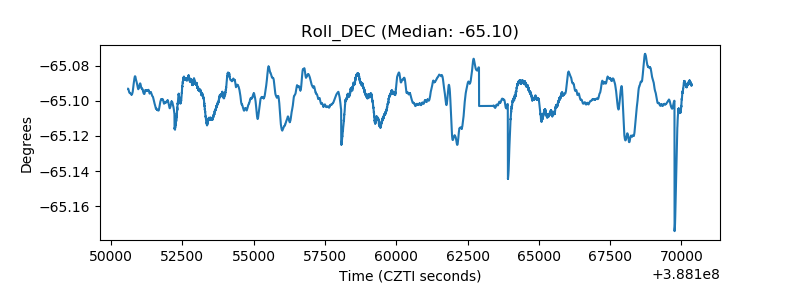 |
| _Roll_RA | 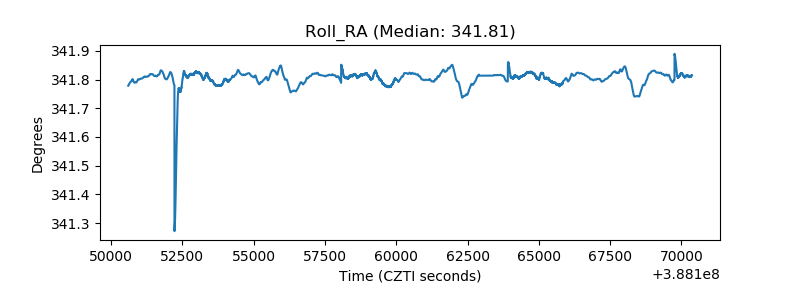 |
| Veto Counter | 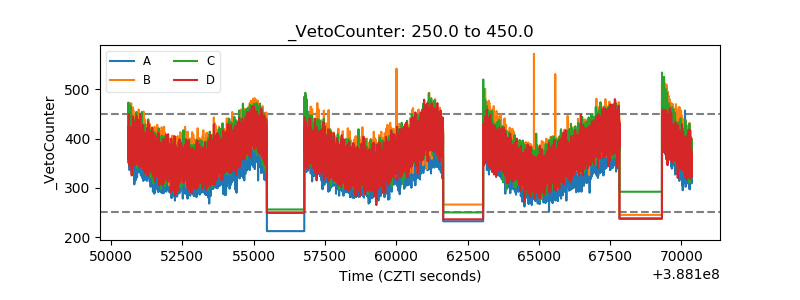 |