| Param | Original file | Final file |
|---|---|---|
| Filename | modeM0/AS1T04_095T01_9000005080_35470cztM0_level2.evt | modeM0/AS1T04_095T01_9000005080_35470cztM0_level2_quad_clean.evt |
| Size (bytes) | 87,315,840 | 21,090,240 |
| Size | 83.3 MB | 20.1 MB |
| Events in quadrant A | 565,534 | 138,018 |
| Events in quadrant B | 620,473 | 141,511 |
| Events in quadrant C | 685,727 | 138,353 |
| Events in quadrant D | 691,295 | 132,959 |
| Mode M0 | |||
|---|---|---|---|
| Quadrant | BADHDUFLAG | Total packets | Discarded packets |
| A | 0 | 2396 | 2 |
| B | 0 | 2577 | 1 |
| C | 0 | 2710 | 1 |
| D | 0 | 2779 | 1 |
| Mode M9 | |||
|---|---|---|---|
| Quadrant | BADHDUFLAG | Total packets | Discarded packets |
| A | 0 | 12 | 0 |
| B | 0 | 12 | 0 |
| C | 0 | 12 | 0 |
| D | 0 | 12 | 0 |
| Mode SS | |||
|---|---|---|---|
| Quadrant | BADHDUFLAG | Total packets | Discarded packets |
| A | 0 | 26 | 0 |
| B | 0 | 26 | 0 |
| C | 0 | 26 | 0 |
| D | 0 | 26 | 0 |
| Quadrant | Total seconds | Saturated seconds | Saturation percentage |
|---|---|---|---|
| A | 1147 | 2 | 0.174368% |
| B | 1147 | 8 | 0.697472% |
| C | 1147 | 40 | 3.487358% |
| D | 1147 | 13 | 1.133391% |
Noise dominated data is calculated using 1-second bins in cleaned event files. If a bin has >2000 counts, and if more than 50% of those come from <1% of pixels, then it is considered to be noise-dominated and hence unusable.
| Quadrant | # 1 sec bins | Bins with >0 counts | Bins with >2000 counts | High rate bins dominated by noise | Noise dominated (total time) | Noise dominated (detector-on time) | Marked lightcurve |
|---|---|---|---|---|---|---|---|
| A | 2429 | 1148 | 0 | 0 | 0.00% | 0.00% |  |
| B | 2429 | 1148 | 4 | 4 | 0.16% | 0.35% |  |
| C | 2429 | 1148 | 31 | 31 | 1.28% | 2.70% |  |
| D | 2429 | 1148 | 8 | 8 | 0.33% | 0.70% |  |
Top three noisy pixels from each quadrant. If the there are fewer than three noisy pixels in the level2.evt file, extra rows are filled as -1
| Pixel properties | Quadrant properties | ||||||
|---|---|---|---|---|---|---|---|
| Quadrant | DetID | PixID | Counts | Sigma | Mean | Median | Sigma |
| A | 10 | 83 | 48781 | 1673.69 | 132 | 129 | 29.1 |
| A | 13 | 6 | 2690 | 88.1 | 132 | 129 | 29.1 |
| A | 10 | 67 | 1626 | 51.5 | 132 | 129 | 29.1 |
| B | 5 | 236 | 45523 | 1678.84 | 129 | 126 | 27.0 |
| B | 5 | 172 | 35290 | 1300.41 | 129 | 126 | 27.0 |
| B | 15 | 85 | 14200 | 520.48 | 129 | 126 | 27.0 |
| C | 0 | 10 | 121905 | 3918.66 | 126 | 127 | 31.1 |
| C | 15 | 214 | 50242 | 1612.64 | 126 | 127 | 31.1 |
| C | 0 | 207 | 16458 | 525.51 | 126 | 127 | 31.1 |
| D | 12 | 217 | 51074 | 1518.39 | 129 | 125 | 33.6 |
| D | 13 | 249 | 28927 | 858.36 | 129 | 125 | 33.6 |
| D | 8 | 195 | 27715 | 822.24 | 129 | 125 | 33.6 |
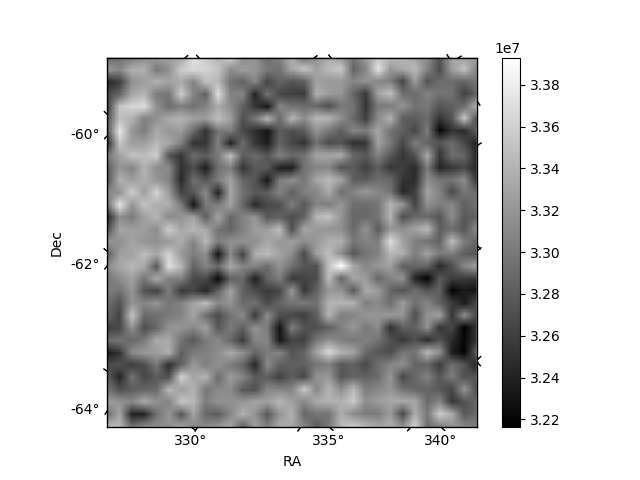
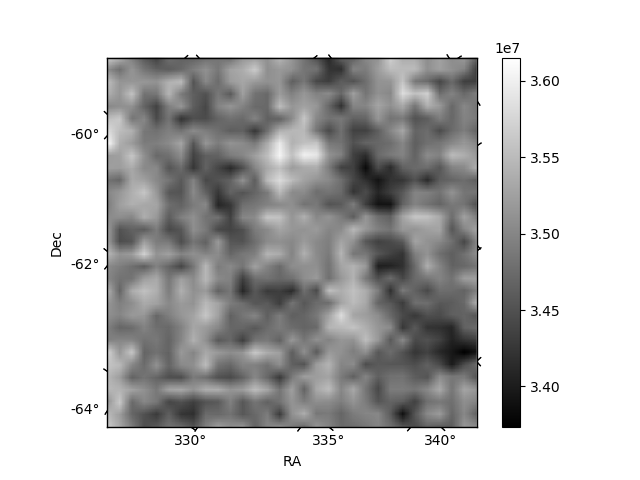
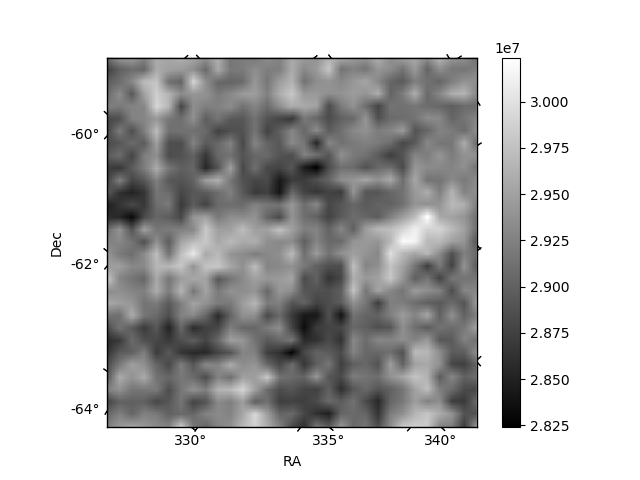
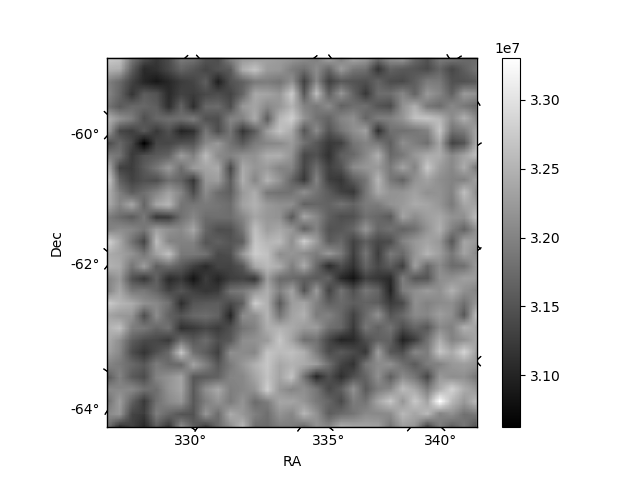
Histogram calculated using DETX and DETY for each event in the final _common_clean file
| Quadrant A | 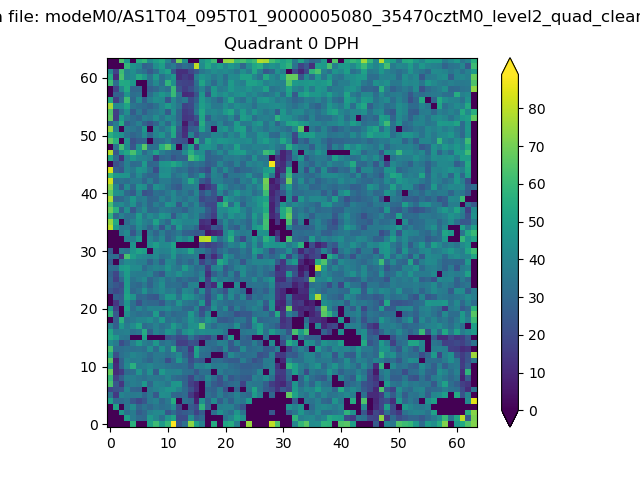 |
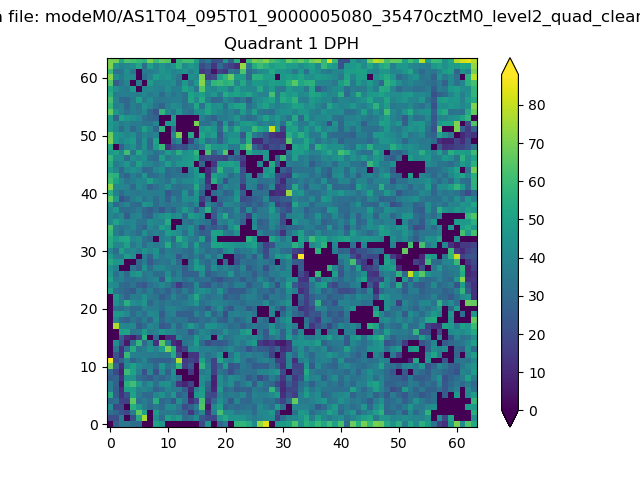 |
Quadrant B |
|---|---|---|---|
| Quadrant D | 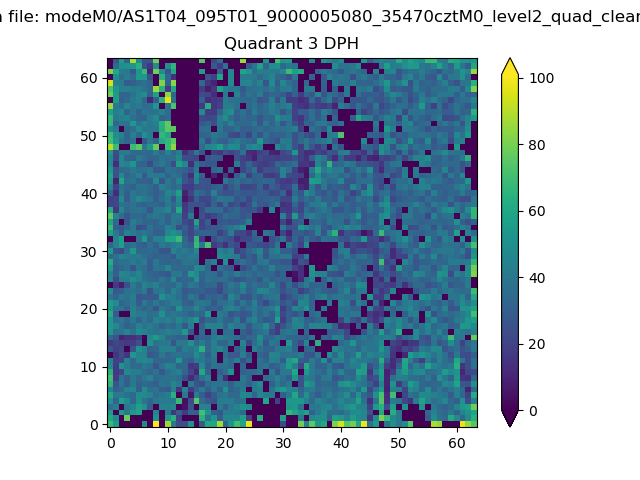 |
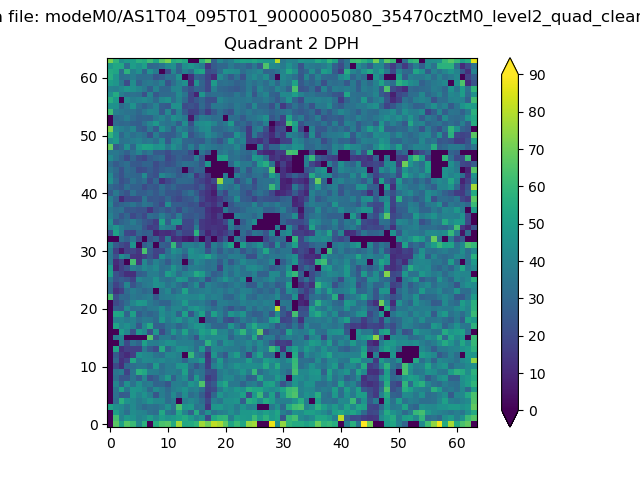 |
Quadrant C |
| Plot type | Count rate plots | Images |
|---|---|---|
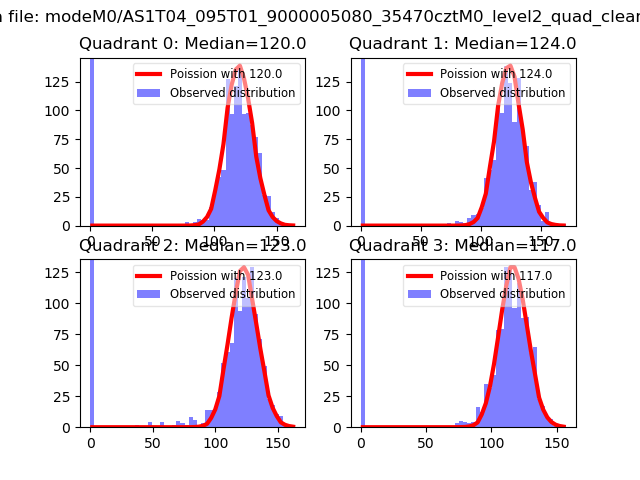
| Comparison with Poisson distribution Blue bars denote a histogram of data divided into 1 sec bins. Red curve is a Poisson curve with rate = median count rate of data. |
 |
 |
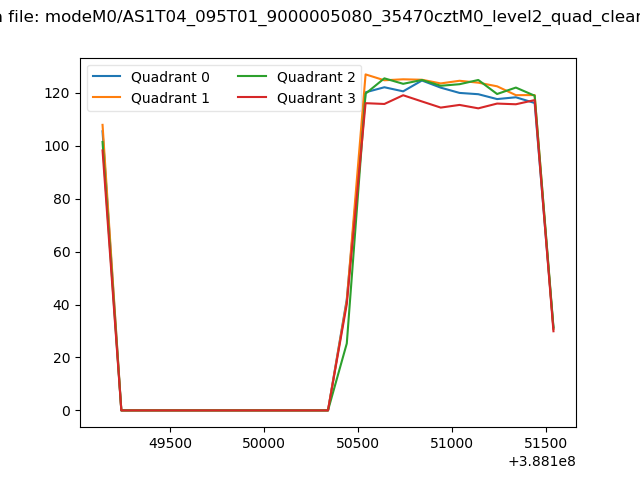
| Quadrant-wise count rates Data is divided into 100 sec bins |
 |
|
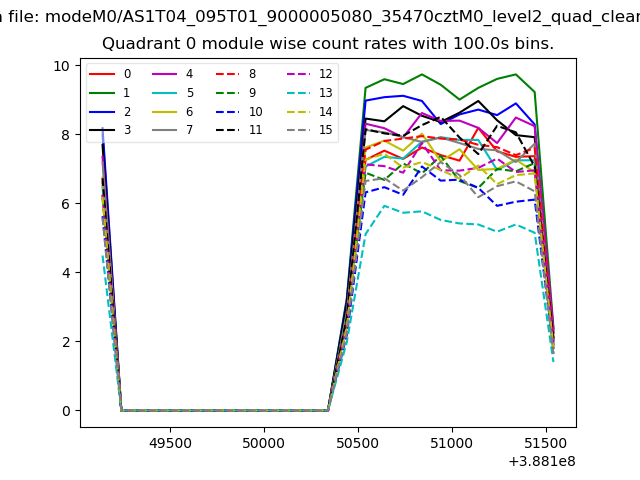
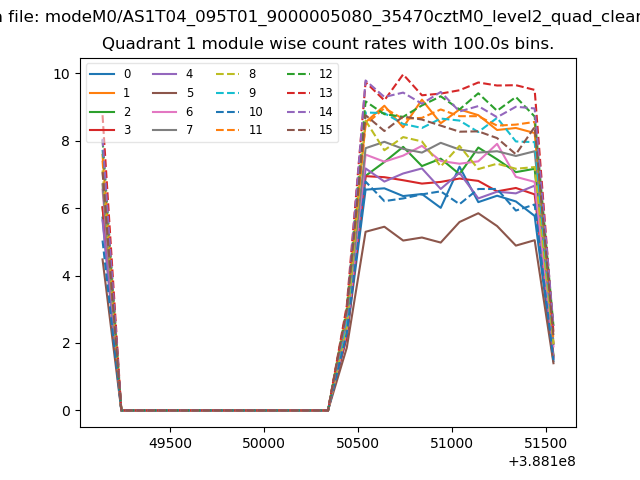
| Module-wise count rates for Quadrant A Data is divided into 100 sec bins |
 |
 |
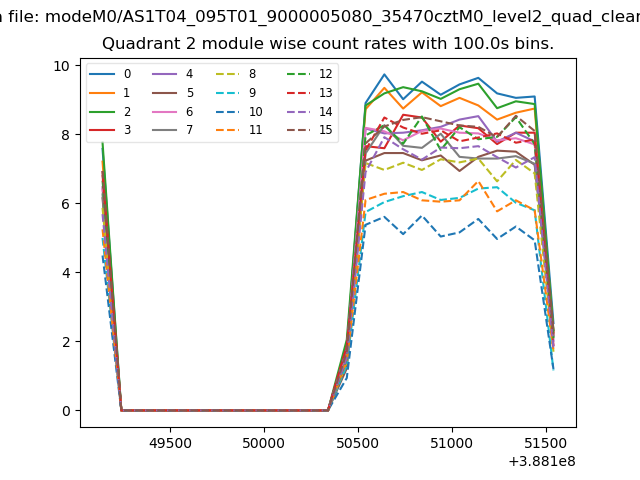
| Module-wise count rates for Quadrant B Data is divided into 100 sec bins |
 |
 |
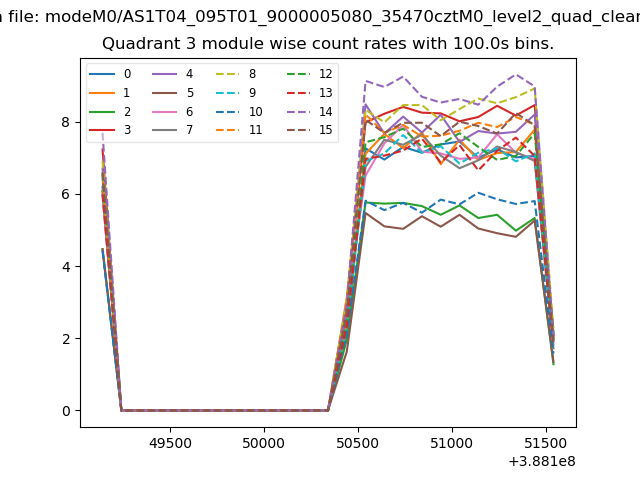
| Module-wise count rates for Quadrant C Data is divided into 100 sec bins |
 |
 |
| Module-wise count rates for Quadrant D Data is divided into 100 sec bins |
 |
 |
| Parameter | Plot |
|---|---|
| CZT HV Monitor |  |
| D_VDD |  |
| Temperature 1 | 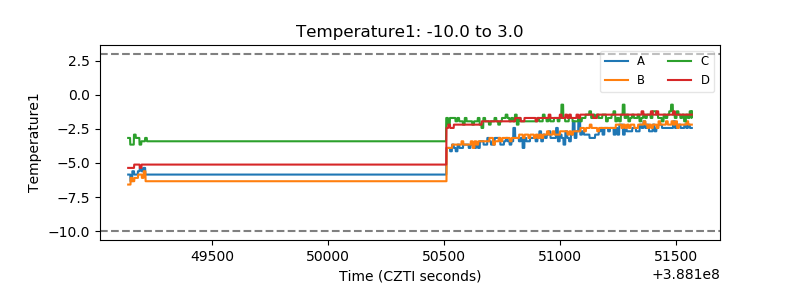 |
| Veto HV Monitor | 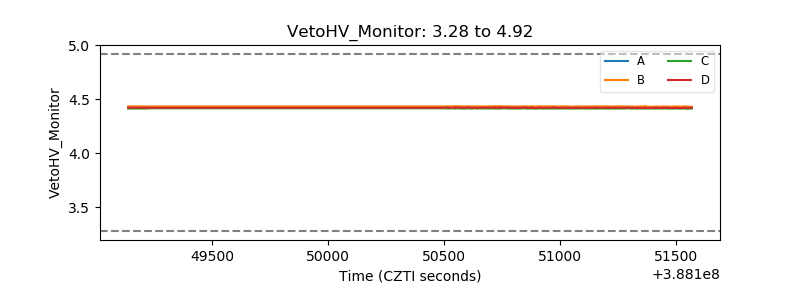 |
| Veto LLD | 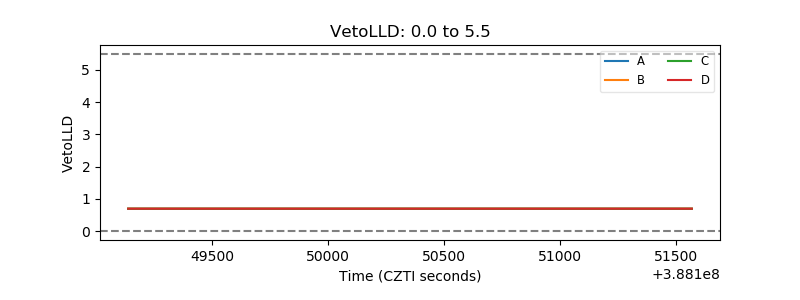 |
| Alpha Counter | 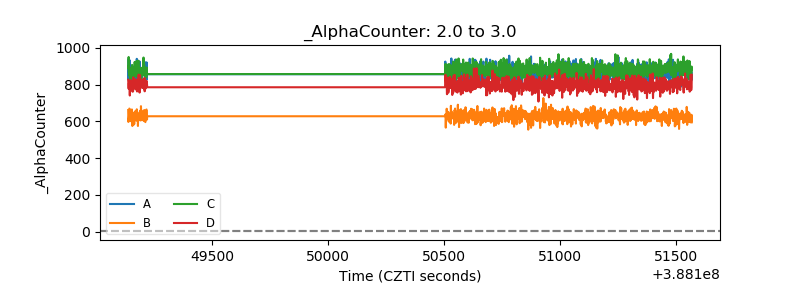 |
| _CPM_Rate | 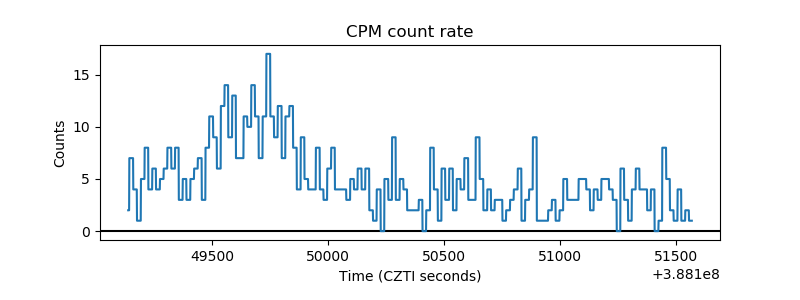 |
| CZT Counter | 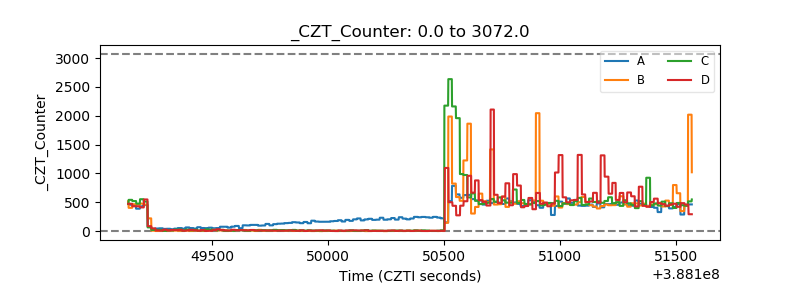 |
| +2.5 Volts monitor | 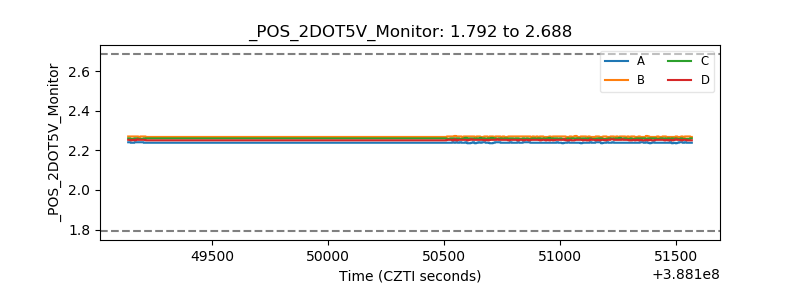 |
| +5 Volts monitor | 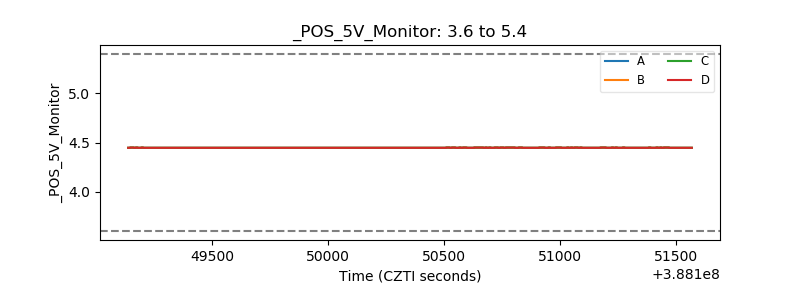 |
| _ROLL_ROT | 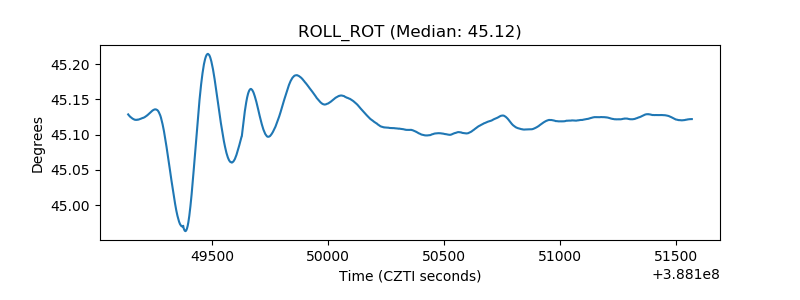 |
| _Roll_DEC | 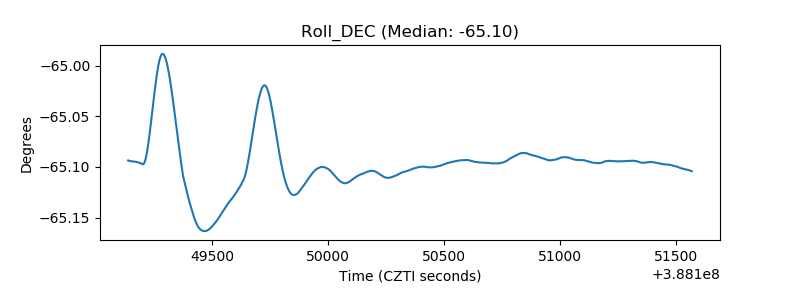 |
| _Roll_RA | 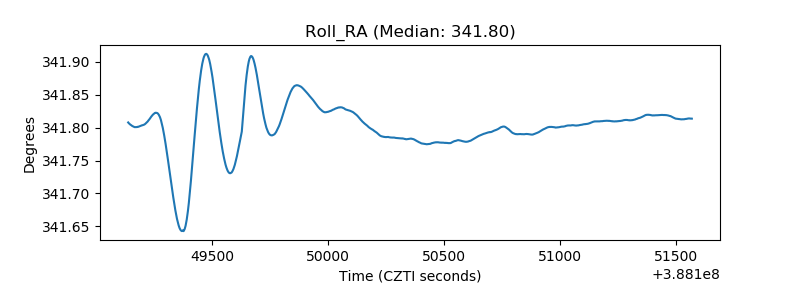 |
| Veto Counter | 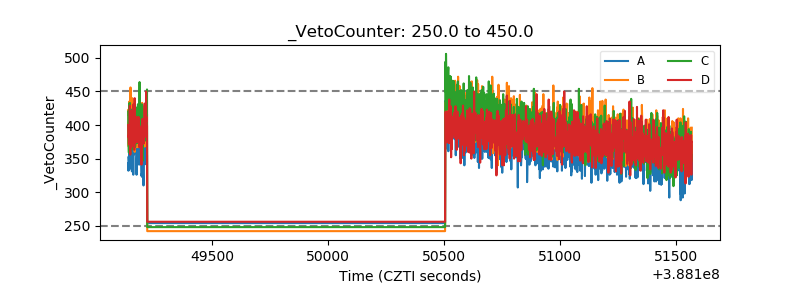 |