| Param | Original file | Final file |
|---|---|---|
| Filename | modeM0/AS1A11_095T06_9000005078_35465cztM0_level2.evt | modeM0/AS1A11_095T06_9000005078_35465cztM0_level2_quad_clean.evt |
| Size (bytes) | 371,511,360 | 57,525,120 |
| Size | 354.3 MB | 54.9 MB |
| Events in quadrant A | 2,546,637 | 355,717 |
| Events in quadrant B | 2,574,533 | 367,101 |
| Events in quadrant C | 3,083,998 | 342,892 |
| Events in quadrant D | 2,709,042 | 328,537 |
| Mode M9 | |||
|---|---|---|---|
| Quadrant | BADHDUFLAG | Total packets | Discarded packets |
| A | 0 | 33 | 0 |
| B | 0 | 33 | 0 |
| C | 0 | 33 | 0 |
| D | 0 | 34 | 0 |
| Mode M0 | |||
|---|---|---|---|
| Quadrant | BADHDUFLAG | Total packets | Discarded packets |
| A | 0 | 10449 | 3 |
| B | 0 | 10421 | 2 |
| C | 0 | 12062 | 2 |
| D | 0 | 11224 | 2 |
| Mode SS | |||
|---|---|---|---|
| Quadrant | BADHDUFLAG | Total packets | Discarded packets |
| A | 0 | 102 | 0 |
| B | 0 | 102 | 0 |
| C | 0 | 102 | 0 |
| D | 0 | 102 | 0 |
| Quadrant | Total seconds | Saturated seconds | Saturation percentage |
|---|---|---|---|
| A | 4950 | 10 | 0.202020% |
| B | 4950 | 24 | 0.484848% |
| C | 4950 | 117 | 2.363636% |
| D | 4950 | 59 | 1.191919% |
Noise dominated data is calculated using 1-second bins in cleaned event files. If a bin has >2000 counts, and if more than 50% of those come from <1% of pixels, then it is considered to be noise-dominated and hence unusable.
| Quadrant | # 1 sec bins | Bins with >0 counts | Bins with >2000 counts | High rate bins dominated by noise | Noise dominated (total time) | Noise dominated (detector-on time) | Marked lightcurve |
|---|---|---|---|---|---|---|---|
| A | 7103 | 4951 | 0 | 0 | 0.00% | 0.00% | 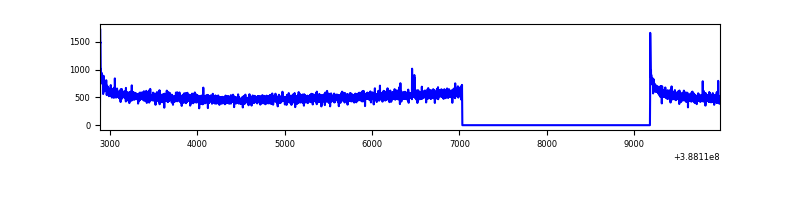 |
| B | 7103 | 4951 | 11 | 11 | 0.15% | 0.22% | 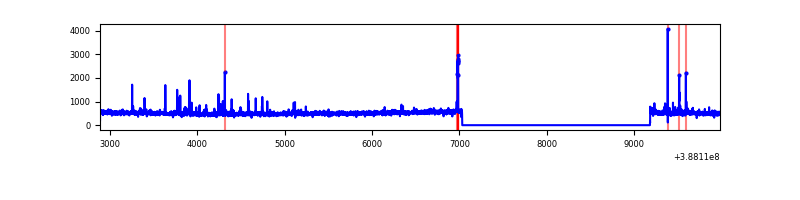 |
| C | 7103 | 4951 | 91 | 91 | 1.28% | 1.84% | 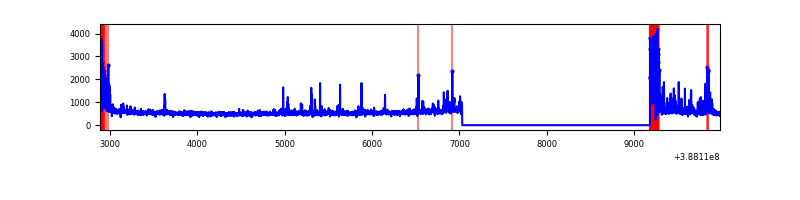 |
| D | 7103 | 4951 | 50 | 50 | 0.70% | 1.01% | 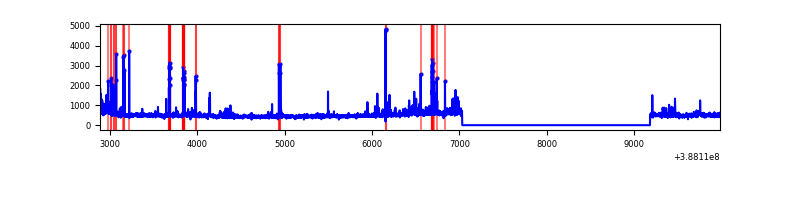 |
Top three noisy pixels from each quadrant. If the there are fewer than three noisy pixels in the level2.evt file, extra rows are filled as -1
| Pixel properties | Quadrant properties | ||||||
|---|---|---|---|---|---|---|---|
| Quadrant | DetID | PixID | Counts | Sigma | Mean | Median | Sigma |
| A | 10 | 83 | 121923 | 968.66 | 623 | 613 | 125.2 |
| A | 13 | 6 | 11937 | 90.42 | 623 | 613 | 125.2 |
| A | 15 | 169 | 8718 | 64.72 | 623 | 613 | 125.2 |
| B | 5 | 172 | 48256 | 402.17 | 623 | 610 | 118.5 |
| B | 5 | 236 | 32968 | 273.13 | 623 | 610 | 118.5 |
| B | 0 | 155 | 15062 | 121.99 | 623 | 610 | 118.5 |
| C | 0 | 10 | 384032 | 2774.0 | 596 | 601 | 138.2 |
| C | 15 | 214 | 205472 | 1482.17 | 596 | 601 | 138.2 |
| C | 0 | 207 | 160436 | 1156.35 | 596 | 601 | 138.2 |
| D | 13 | 249 | 107740 | 746.36 | 591 | 576 | 143.6 |
| D | 8 | 195 | 97670 | 676.22 | 591 | 576 | 143.6 |
| D | 12 | 233 | 69094 | 477.2 | 591 | 576 | 143.6 |
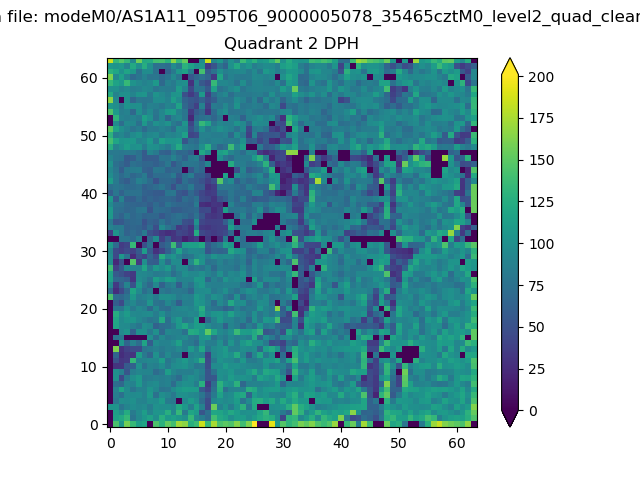
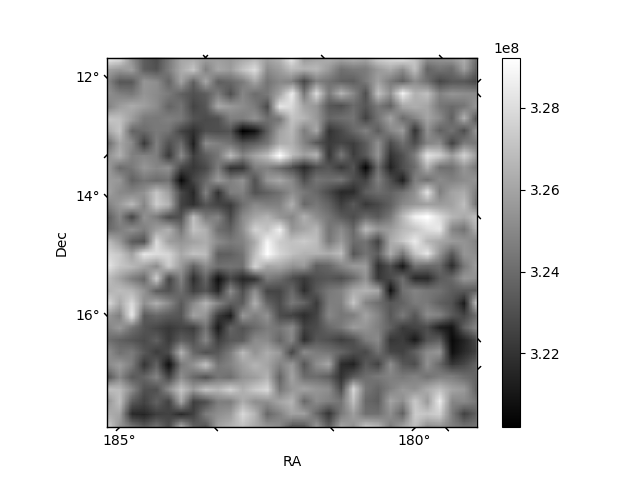
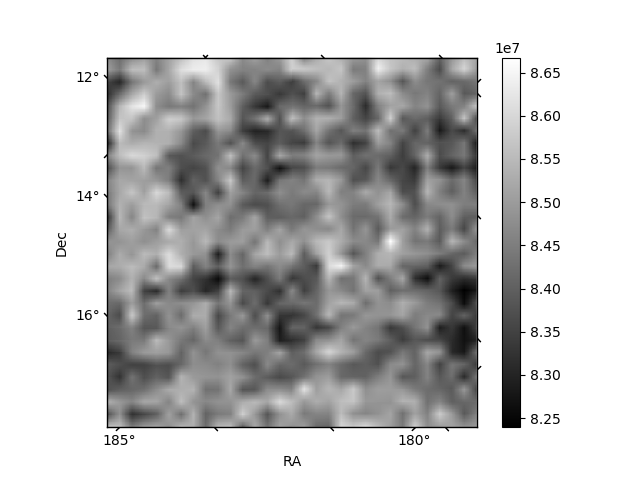
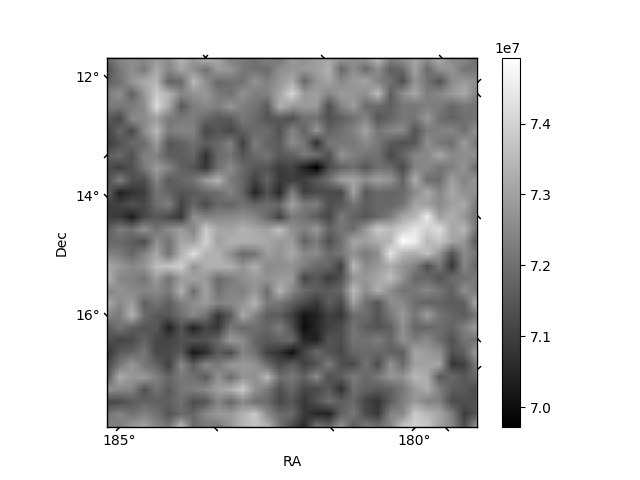
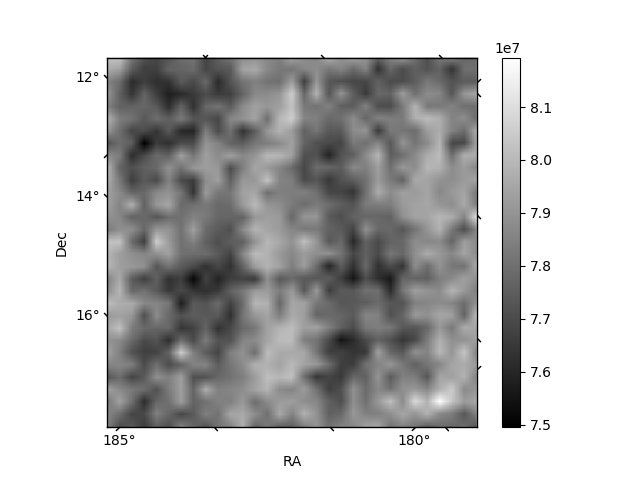
Histogram calculated using DETX and DETY for each event in the final _common_clean file
| Quadrant A | 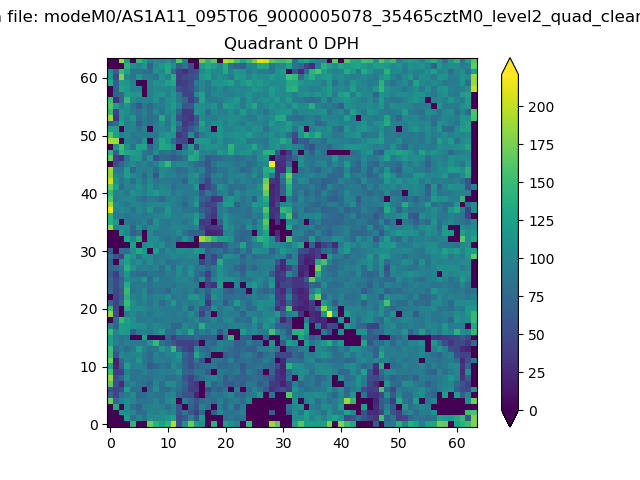 |
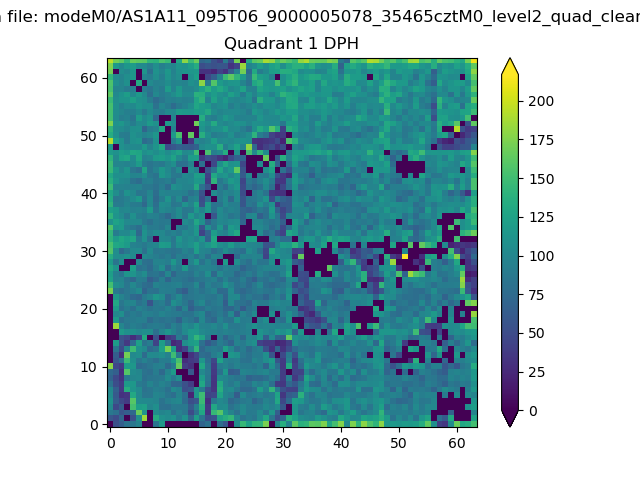 |
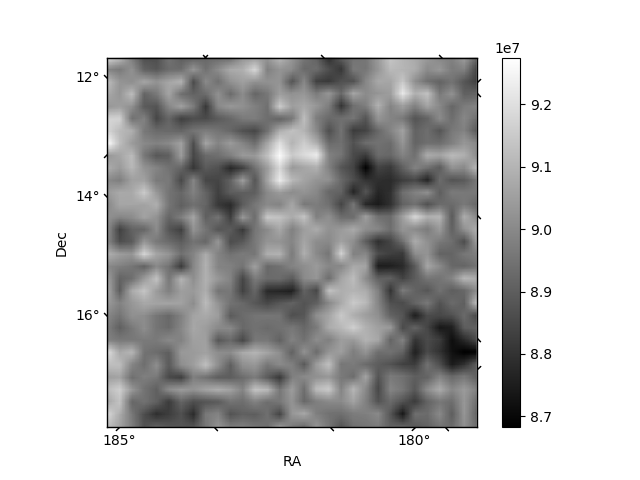
Quadrant B |
|---|---|---|---|
| Quadrant D | 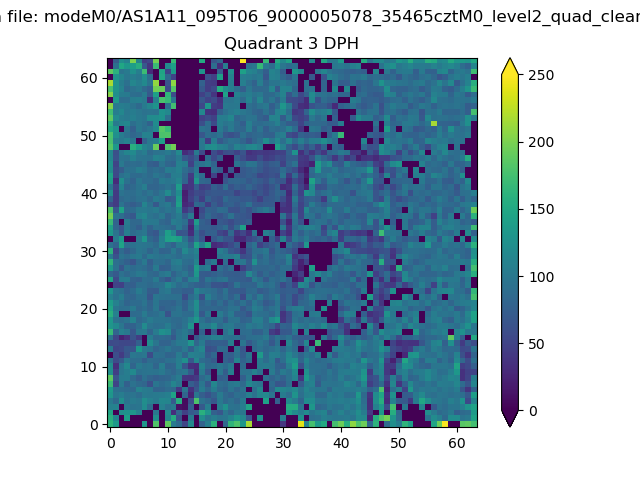 |
 |
Quadrant C |
| Plot type | Count rate plots | Images |
|---|---|---|
| Comparison with Poisson distribution Blue bars denote a histogram of data divided into 1 sec bins. Red curve is a Poisson curve with rate = median count rate of data. |
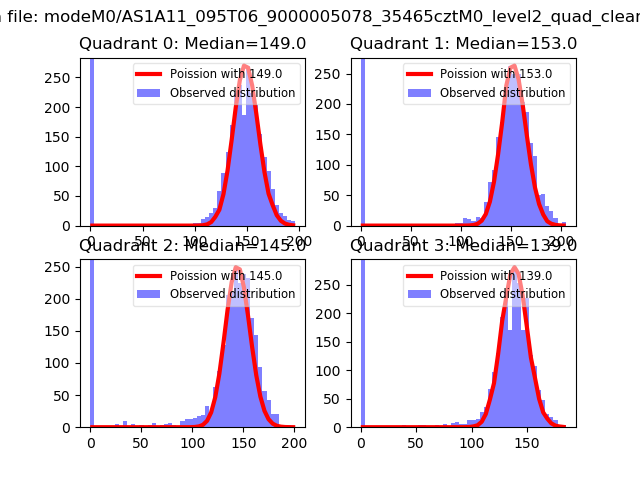 |
 |
| Quadrant-wise count rates Data is divided into 100 sec bins |
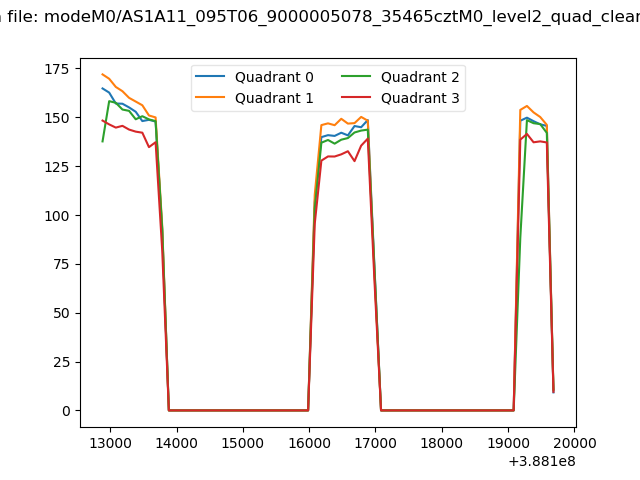 |
|
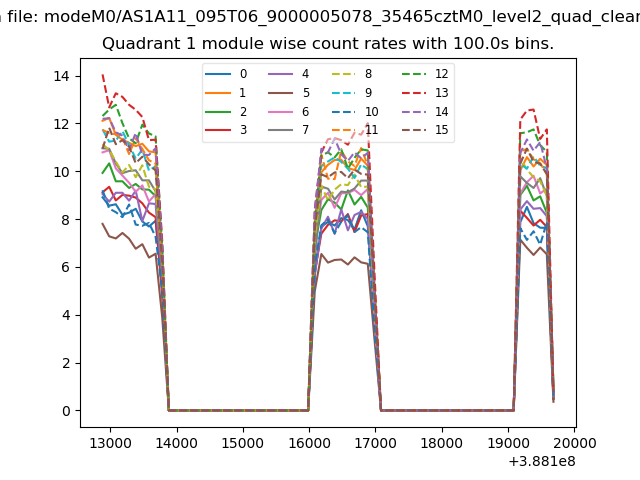
| Module-wise count rates for Quadrant A Data is divided into 100 sec bins |
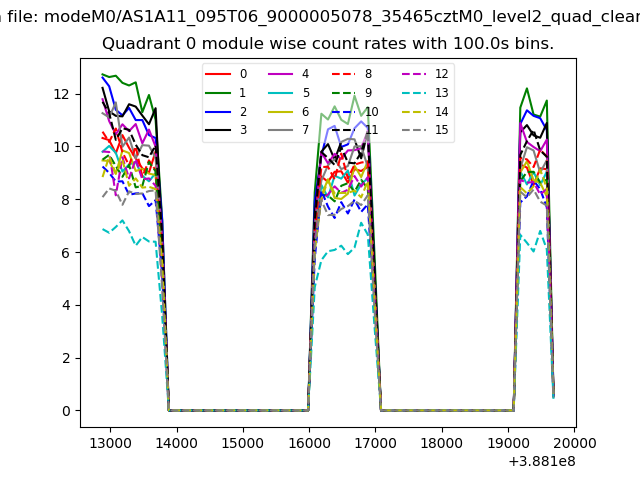 |
 |
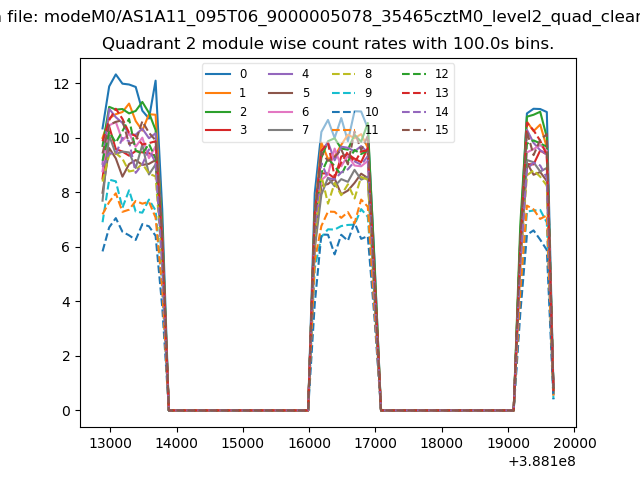
| Module-wise count rates for Quadrant B Data is divided into 100 sec bins |
 |
 |
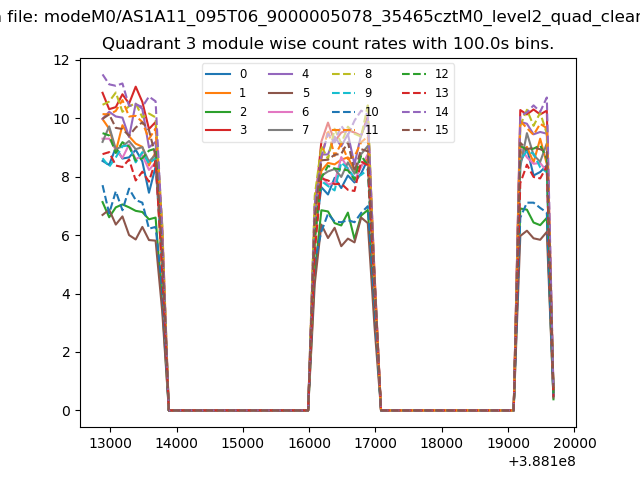
| Module-wise count rates for Quadrant C Data is divided into 100 sec bins |
 |
 |
| Module-wise count rates for Quadrant D Data is divided into 100 sec bins |
 |
 |
| Parameter | Plot |
|---|---|
| CZT HV Monitor | 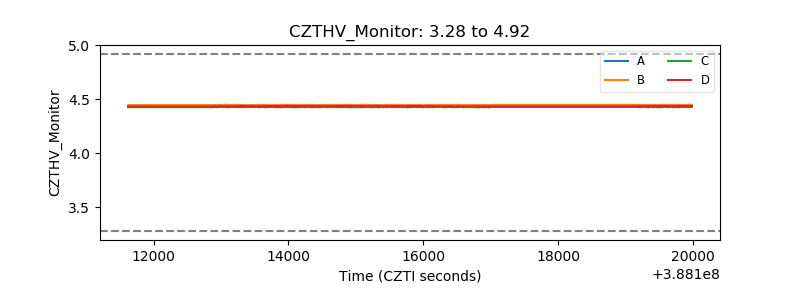 |
| D_VDD | 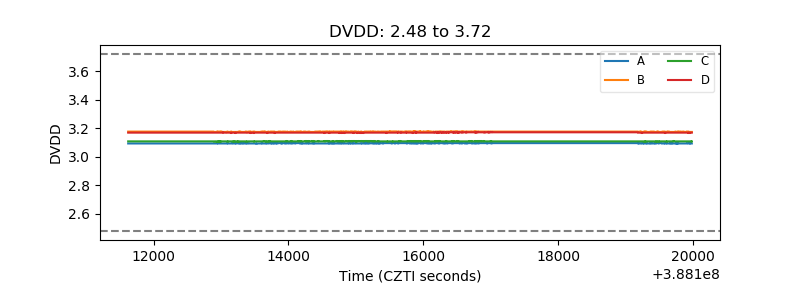 |
| Temperature 1 | 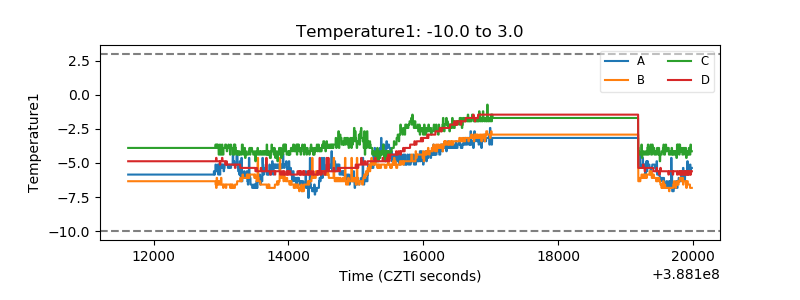 |
| Veto HV Monitor | 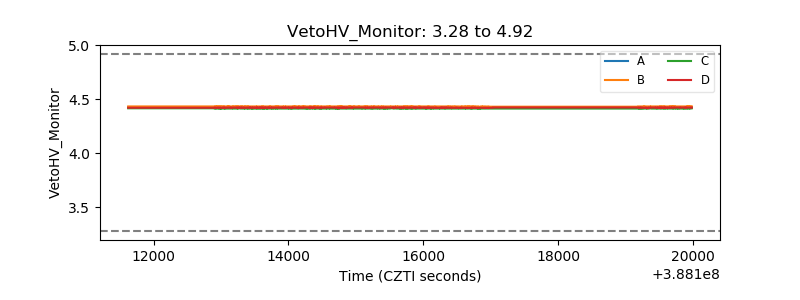 |
| Veto LLD | 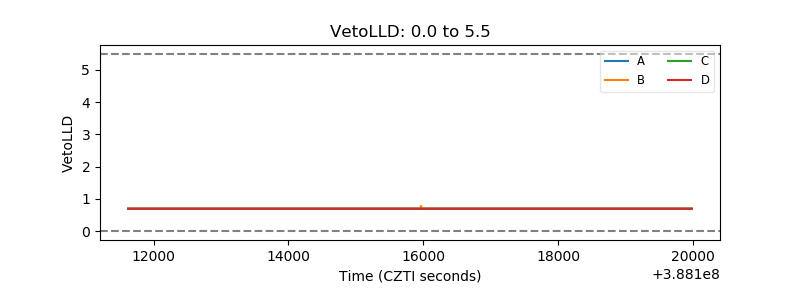 |
| Alpha Counter | 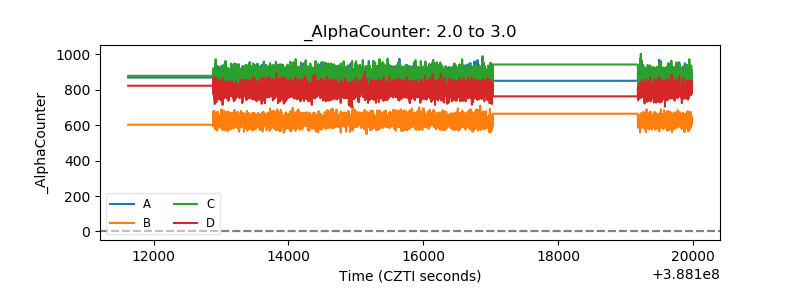 |
| _CPM_Rate | 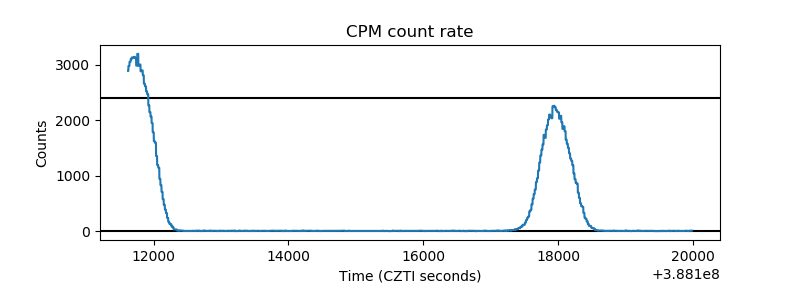 |
| CZT Counter | 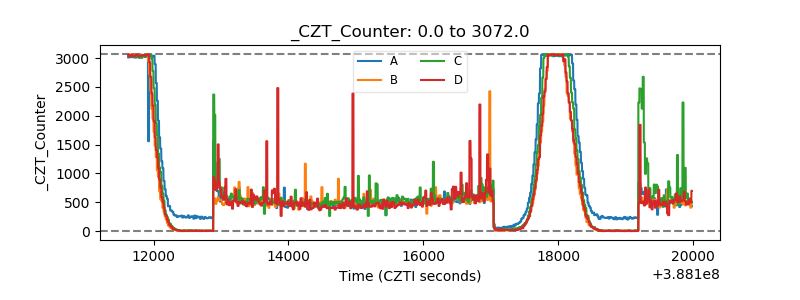 |
| +2.5 Volts monitor | 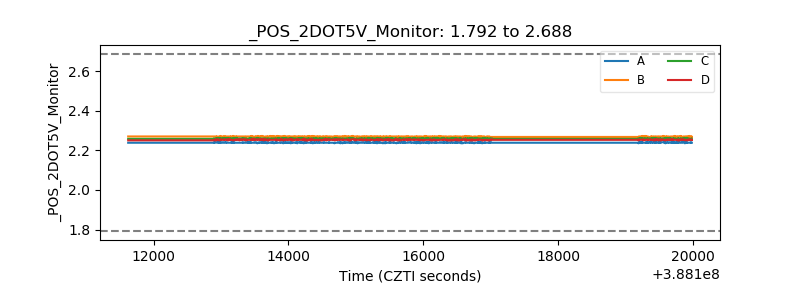 |
| +5 Volts monitor | 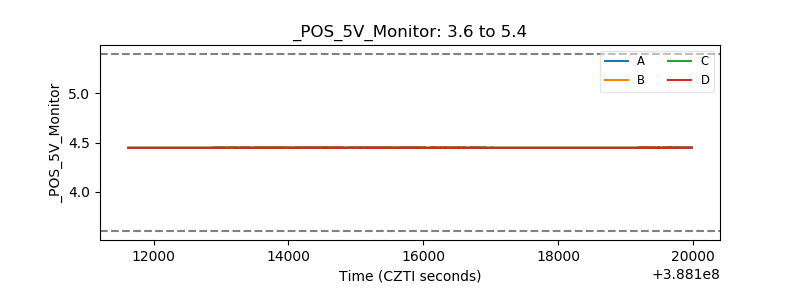 |
| _ROLL_ROT | 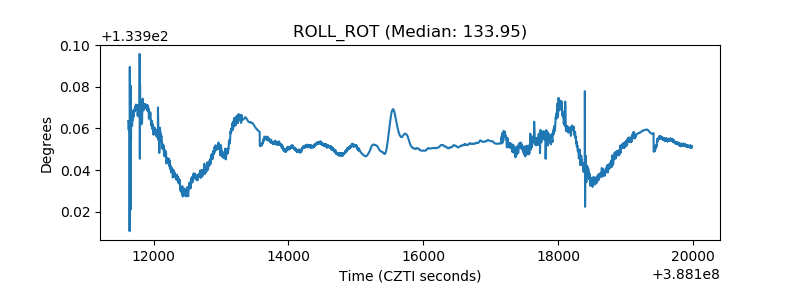 |
| _Roll_DEC | 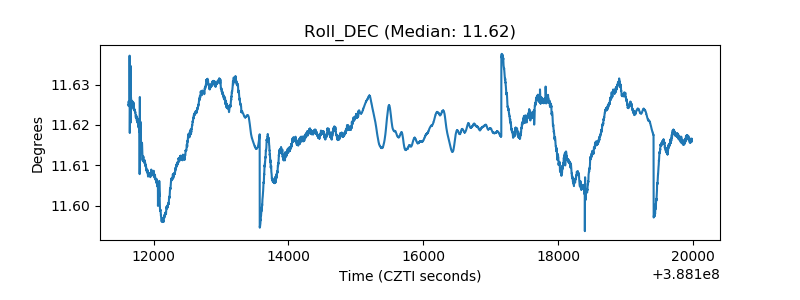 |
| _Roll_RA | 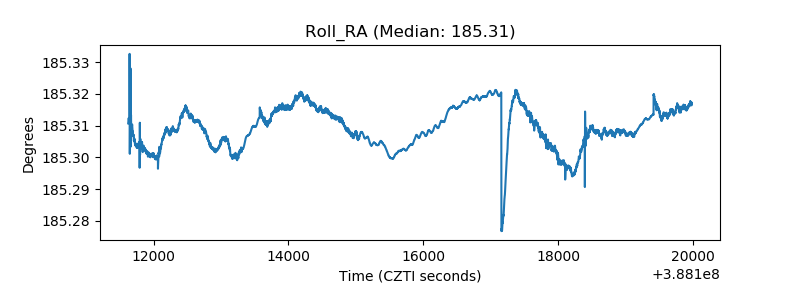 |
| Veto Counter | 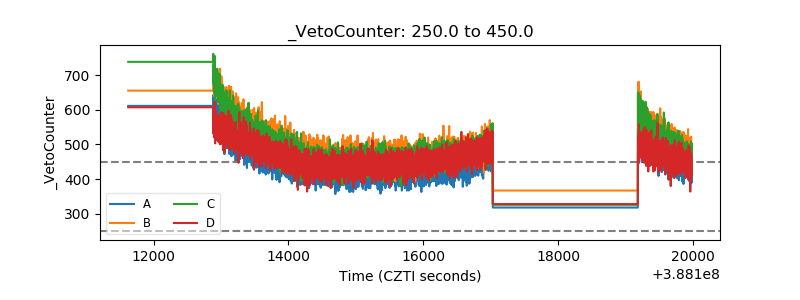 |