| Param | Original file | Final file |
|---|---|---|
| Filename | modeM0/AS1A11_095T06_9000005078_35462cztM0_level2.evt | modeM0/AS1A11_095T06_9000005078_35462cztM0_level2_quad_clean.evt |
| Size (bytes) | 408,559,680 | 67,749,120 |
| Size | 389.6 MB | 64.6 MB |
| Events in quadrant A | 3,061,462 | 424,489 |
| Events in quadrant B | 2,920,385 | 433,933 |
| Events in quadrant C | 3,099,729 | 416,987 |
| Events in quadrant D | 2,930,825 | 404,209 |
| Mode M9 | |||
|---|---|---|---|
| Quadrant | BADHDUFLAG | Total packets | Discarded packets |
| A | 0 | 33 | 0 |
| B | 0 | 33 | 0 |
| C | 0 | 33 | 0 |
| D | 0 | 34 | 0 |
| Mode M0 | |||
|---|---|---|---|
| Quadrant | BADHDUFLAG | Total packets | Discarded packets |
| A | 0 | 12572 | 3 |
| B | 0 | 12011 | 2 |
| C | 0 | 12386 | 2 |
| D | 0 | 12210 | 2 |
| Mode SS | |||
|---|---|---|---|
| Quadrant | BADHDUFLAG | Total packets | Discarded packets |
| A | 0 | 110 | 0 |
| B | 0 | 110 | 0 |
| C | 0 | 110 | 0 |
| D | 0 | 110 | 0 |
| Quadrant | Total seconds | Saturated seconds | Saturation percentage |
|---|---|---|---|
| A | 5302 | 113 | 2.131271% |
| B | 5302 | 71 | 1.339117% |
| C | 5302 | 109 | 2.055828% |
| D | 5302 | 37 | 0.697850% |
Noise dominated data is calculated using 1-second bins in cleaned event files. If a bin has >2000 counts, and if more than 50% of those come from <1% of pixels, then it is considered to be noise-dominated and hence unusable.
| Quadrant | # 1 sec bins | Bins with >0 counts | Bins with >2000 counts | High rate bins dominated by noise | Noise dominated (total time) | Noise dominated (detector-on time) | Marked lightcurve |
|---|---|---|---|---|---|---|---|
| A | 7154 | 5303 | 72 | 72 | 1.01% | 1.36% | 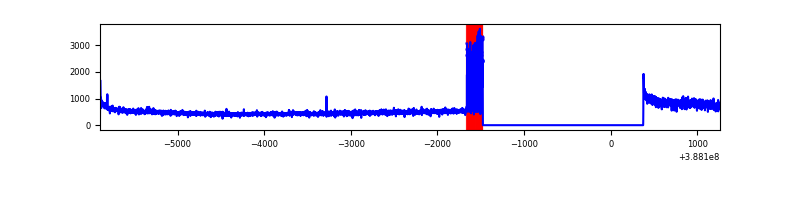 |
| B | 7154 | 5303 | 31 | 31 | 0.43% | 0.58% | 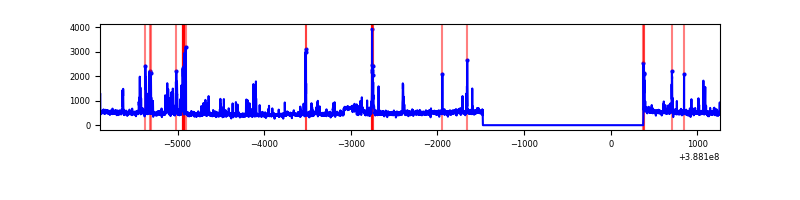 |
| C | 7154 | 5303 | 76 | 76 | 1.06% | 1.43% | 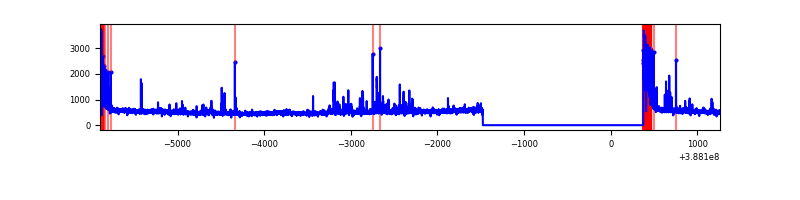 |
| D | 7154 | 5303 | 30 | 30 | 0.42% | 0.57% | 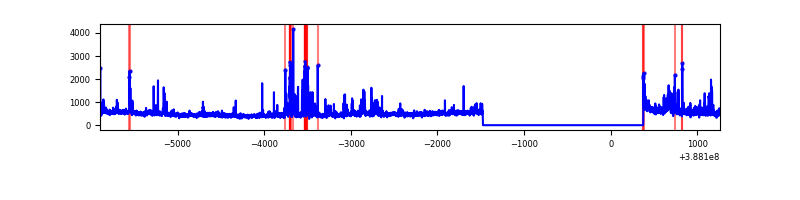 |
Top three noisy pixels from each quadrant. If the there are fewer than three noisy pixels in the level2.evt file, extra rows are filled as -1
| Pixel properties | Quadrant properties | ||||||
|---|---|---|---|---|---|---|---|
| Quadrant | DetID | PixID | Counts | Sigma | Mean | Median | Sigma |
| A | 15 | 169 | 512704 | 4047.43 | 624 | 610 | 126.5 |
| A | 10 | 83 | 123004 | 967.36 | 624 | 610 | 126.5 |
| A | 13 | 6 | 11070 | 82.67 | 624 | 610 | 126.5 |
| B | 5 | 236 | 267184 | 2199.34 | 628 | 612 | 121.2 |
| B | 5 | 172 | 102557 | 841.09 | 628 | 612 | 121.2 |
| B | 5 | 200 | 72320 | 591.62 | 628 | 612 | 121.2 |
| C | 0 | 10 | 328464 | 2285.6 | 612 | 616 | 143.4 |
| C | 15 | 214 | 219147 | 1523.49 | 612 | 616 | 143.4 |
| C | 0 | 207 | 135026 | 937.04 | 612 | 616 | 143.4 |
| D | 13 | 249 | 146743 | 982.59 | 612 | 597 | 148.7 |
| D | 1 | 52 | 105778 | 707.17 | 612 | 597 | 148.7 |
| D | 8 | 195 | 69372 | 462.4 | 612 | 597 | 148.7 |
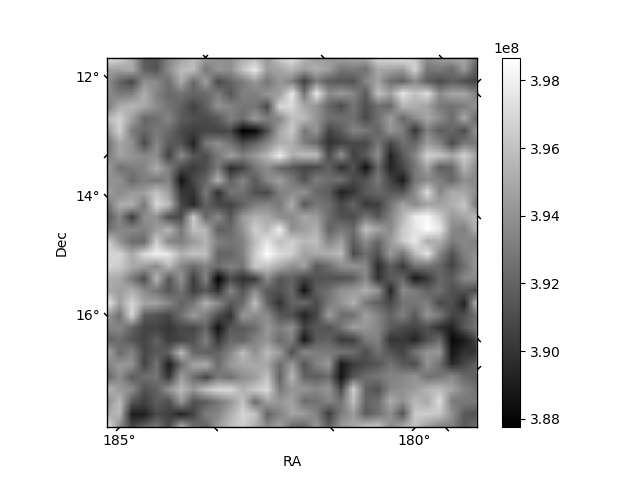
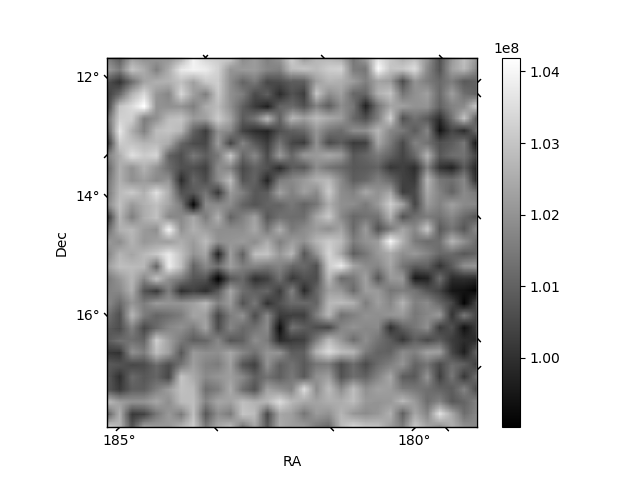
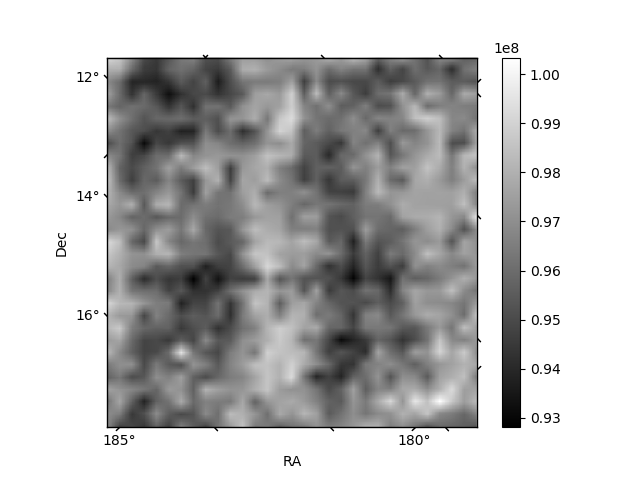
Histogram calculated using DETX and DETY for each event in the final _common_clean file
| Quadrant A | 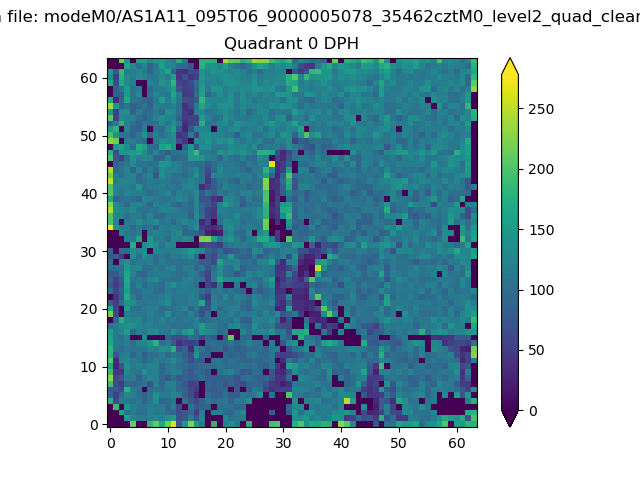 |
 |
Quadrant B |
|---|---|---|---|
| Quadrant D | 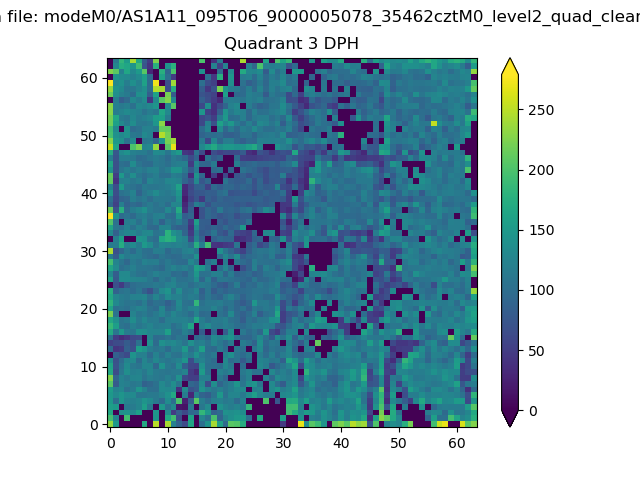 |
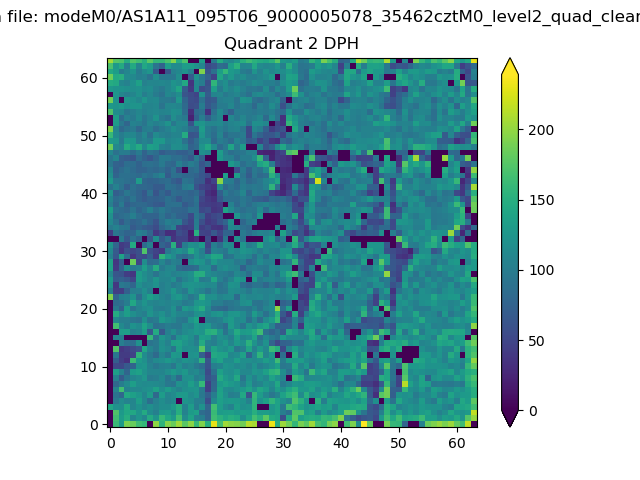 |
Quadrant C |
| Plot type | Count rate plots | Images |
|---|---|---|
| Comparison with Poisson distribution Blue bars denote a histogram of data divided into 1 sec bins. Red curve is a Poisson curve with rate = median count rate of data. |
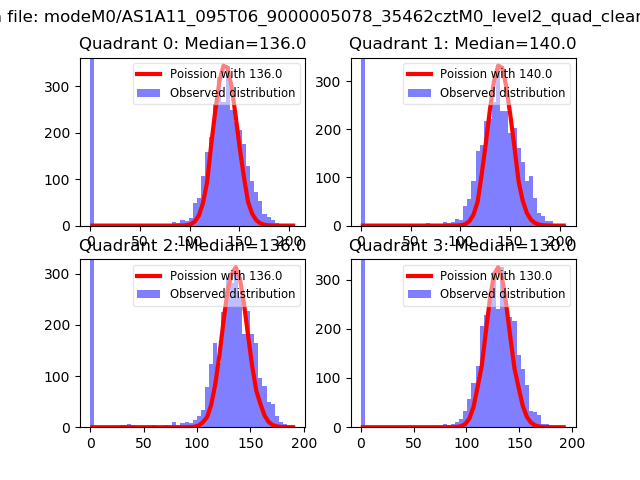 |
 |
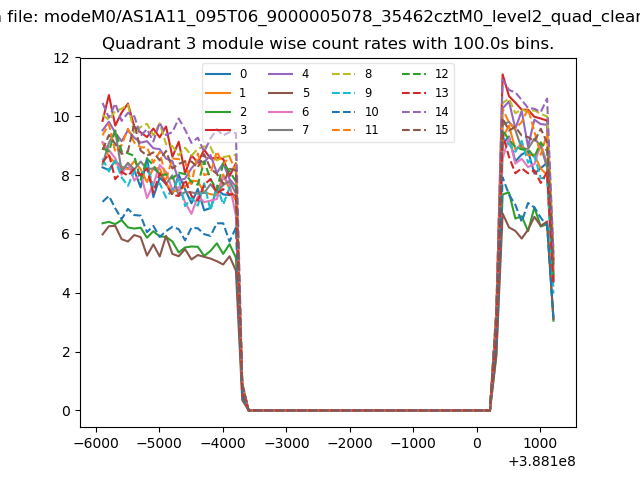
| Quadrant-wise count rates Data is divided into 100 sec bins |
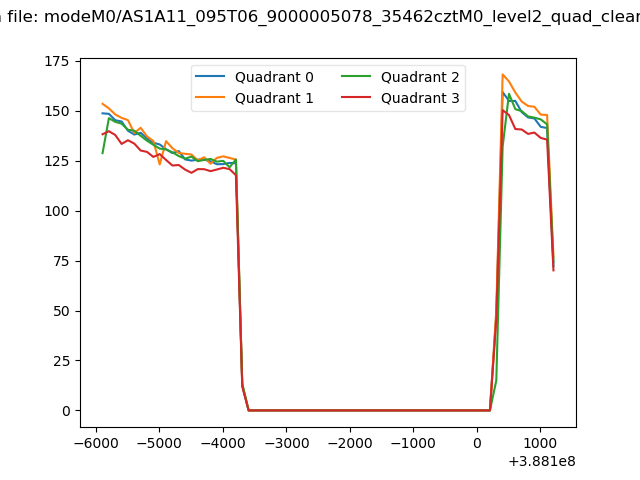 |
|
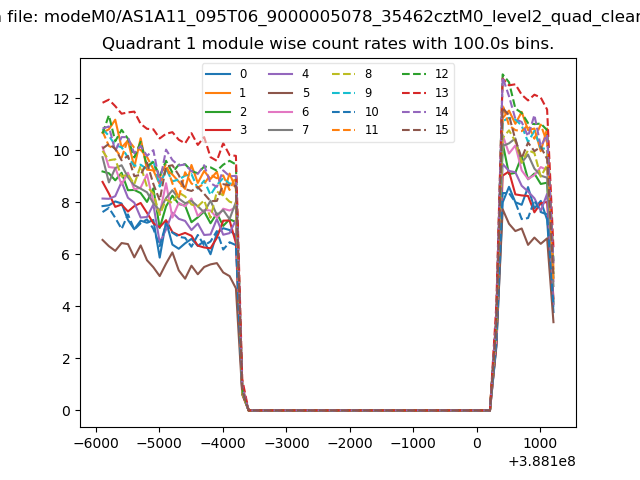
| Module-wise count rates for Quadrant A Data is divided into 100 sec bins |
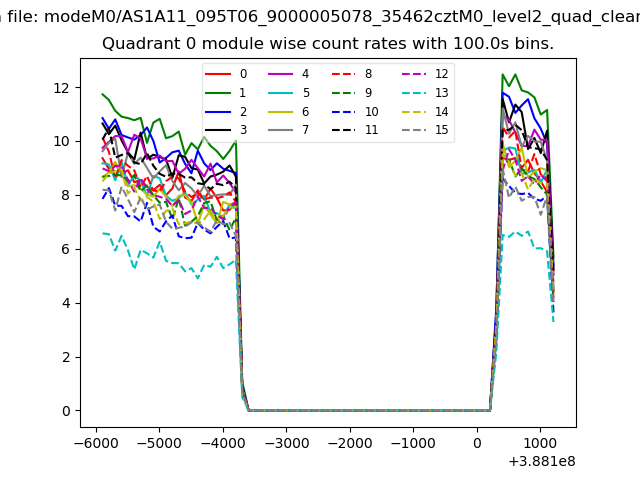 |
 |
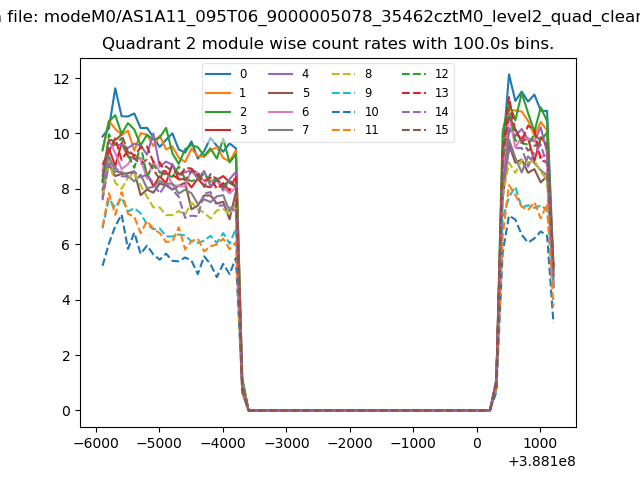
| Module-wise count rates for Quadrant B Data is divided into 100 sec bins |
 |
 |
| Module-wise count rates for Quadrant C Data is divided into 100 sec bins |
 |
 |
| Module-wise count rates for Quadrant D Data is divided into 100 sec bins |
 |
 |
| Parameter | Plot |
|---|---|
| CZT HV Monitor | 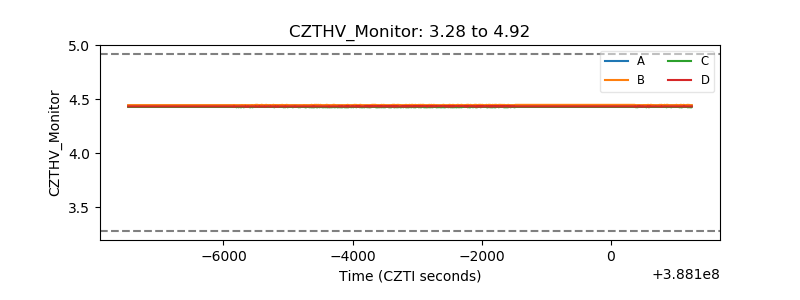 |
| D_VDD | 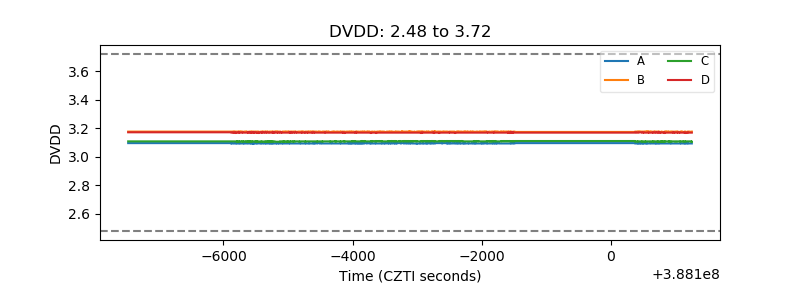 |
| Temperature 1 | 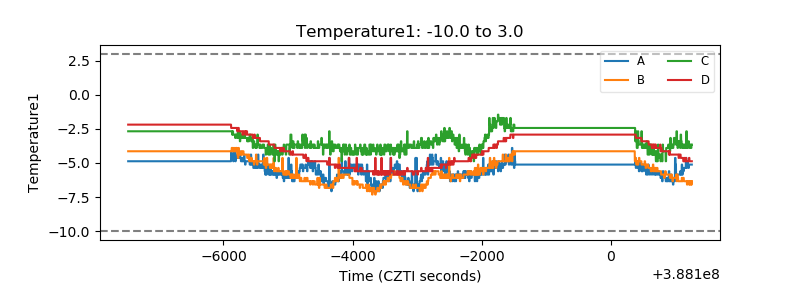 |
| Veto HV Monitor | 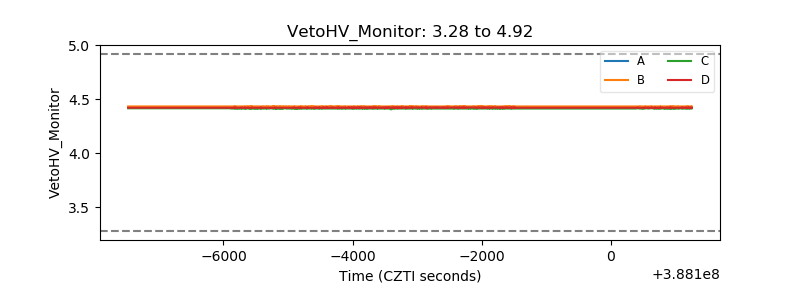 |
| Veto LLD | 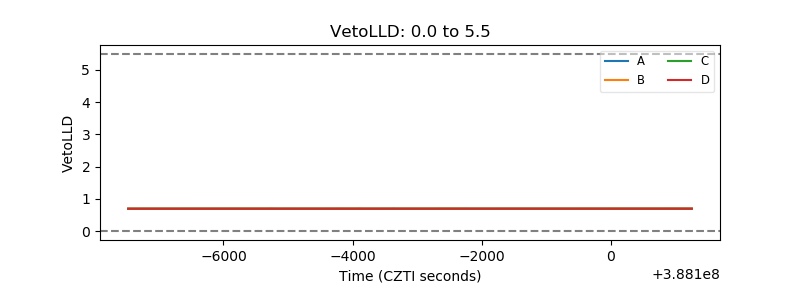 |
| Alpha Counter | 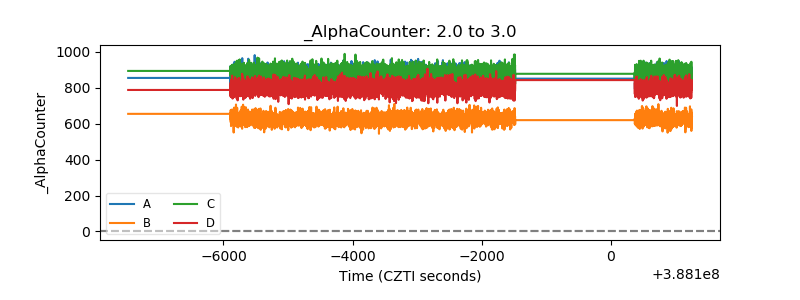 |
| _CPM_Rate | 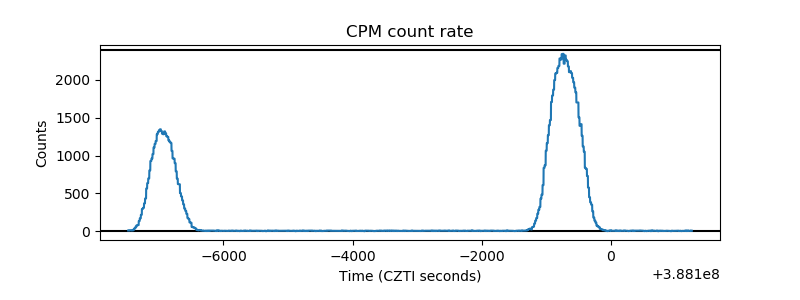 |
| CZT Counter | 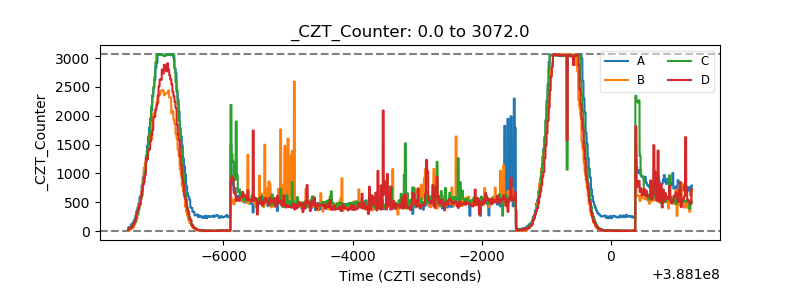 |
| +2.5 Volts monitor | 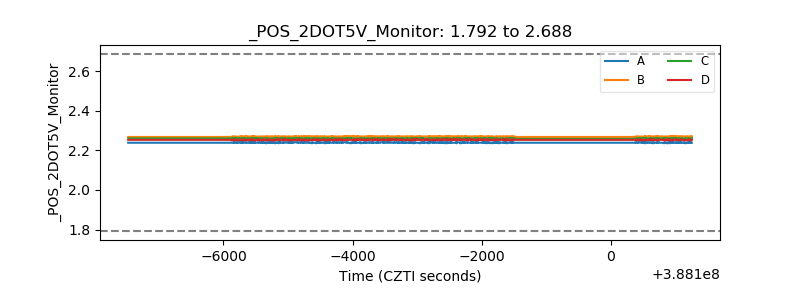 |
| +5 Volts monitor | 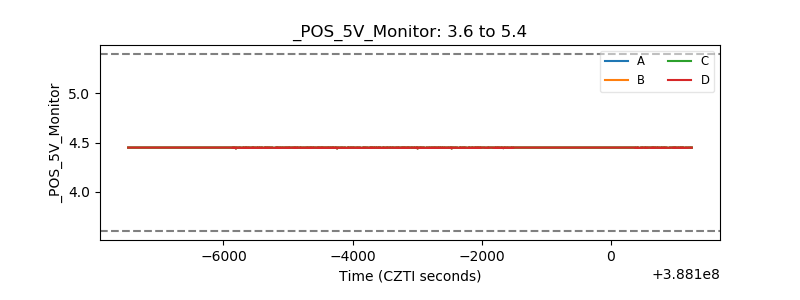 |
| _ROLL_ROT | 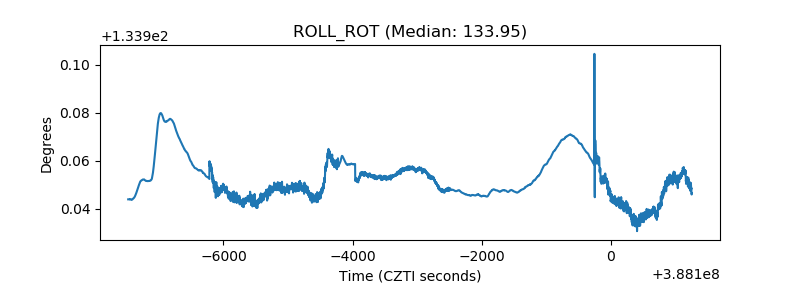 |
| _Roll_DEC | 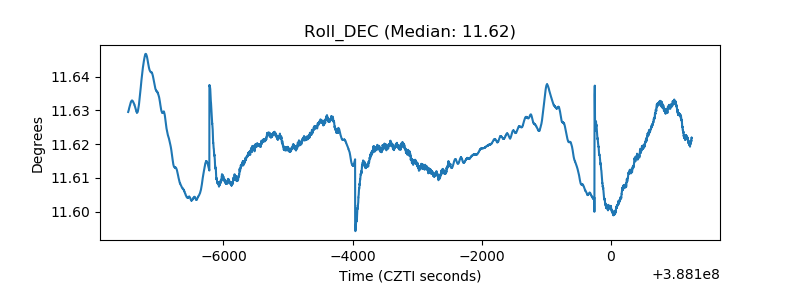 |
| _Roll_RA | 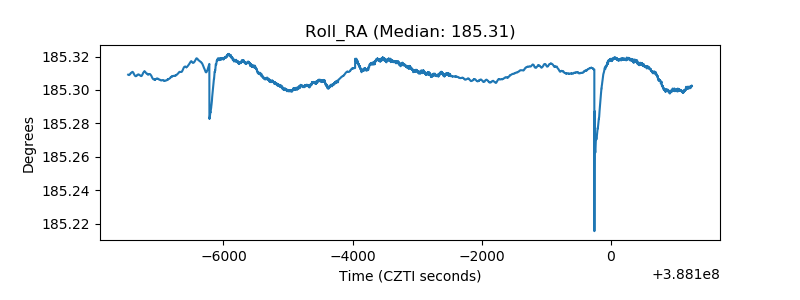 |
| Veto Counter | 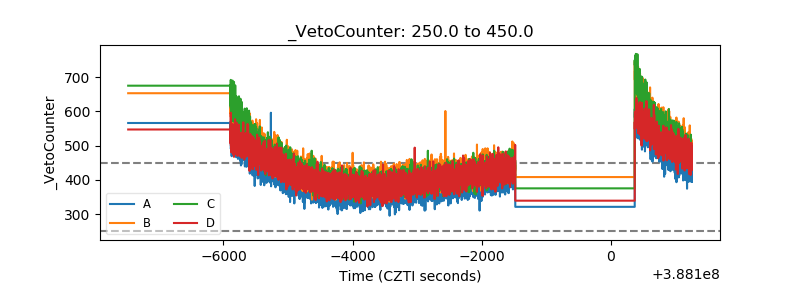 |