| Param | Original file | Final file |
|---|---|---|
| Filename | modeM0/AS1A11_095T06_9000005078_35458cztM0_level2.evt | modeM0/AS1A11_095T06_9000005078_35458cztM0_level2_quad_clean.evt |
| Size (bytes) | 716,728,320 | 108,636,480 |
| Size | 683.5 MB | 103.6 MB |
| Events in quadrant A | 3,785,176 | 708,113 |
| Events in quadrant B | 8,707,366 | 659,264 |
| Events in quadrant C | 4,273,133 | 695,180 |
| Events in quadrant D | 4,396,615 | 668,571 |
| Mode M9 | |||
|---|---|---|---|
| Quadrant | BADHDUFLAG | Total packets | Discarded packets |
| A | 0 | 28 | 0 |
| B | 0 | 28 | 0 |
| C | 0 | 28 | 0 |
| D | 0 | 28 | 0 |
| Mode M0 | |||
|---|---|---|---|
| Quadrant | BADHDUFLAG | Total packets | Discarded packets |
| A | 0 | 16431 | 3 |
| B | 0 | 31194 | 2 |
| C | 0 | 17436 | 2 |
| D | 0 | 18299 | 2 |
| Mode SS | |||
|---|---|---|---|
| Quadrant | BADHDUFLAG | Total packets | Discarded packets |
| A | 0 | 166 | 0 |
| B | 0 | 166 | 0 |
| C | 0 | 166 | 0 |
| D | 0 | 166 | 0 |
| Quadrant | Total seconds | Saturated seconds | Saturation percentage |
|---|---|---|---|
| A | 8030 | 14 | 0.174346% |
| B | 8030 | 1666 | 20.747198% |
| C | 8030 | 119 | 1.481943% |
| D | 8030 | 155 | 1.930262% |
Noise dominated data is calculated using 1-second bins in cleaned event files. If a bin has >2000 counts, and if more than 50% of those come from <1% of pixels, then it is considered to be noise-dominated and hence unusable.
| Quadrant | # 1 sec bins | Bins with >0 counts | Bins with >2000 counts | High rate bins dominated by noise | Noise dominated (total time) | Noise dominated (detector-on time) | Marked lightcurve |
|---|---|---|---|---|---|---|---|
| A | 10866 | 8033 | 0 | 0 | 0.00% | 0.00% | 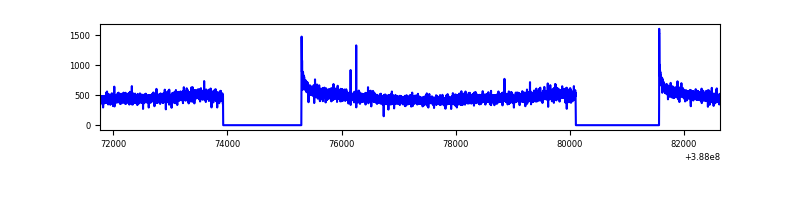 |
| B | 10866 | 8033 | 1207 | 1207 | 11.11% | 15.03% | 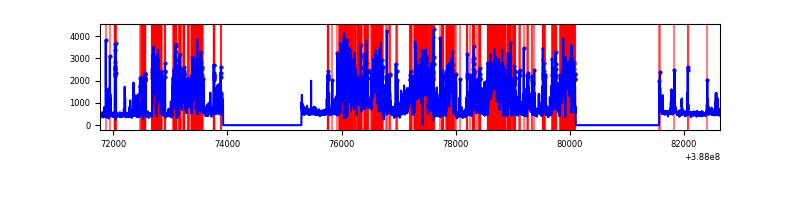 |
| C | 10866 | 8033 | 77 | 77 | 0.71% | 0.96% | 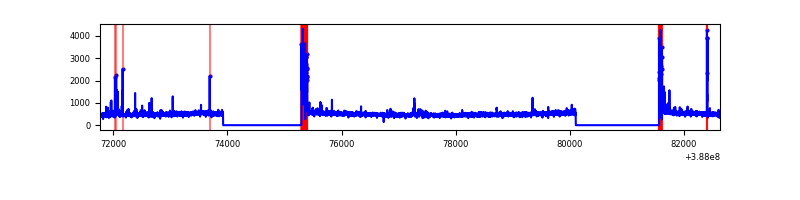 |
| D | 10866 | 8033 | 134 | 134 | 1.23% | 1.67% | 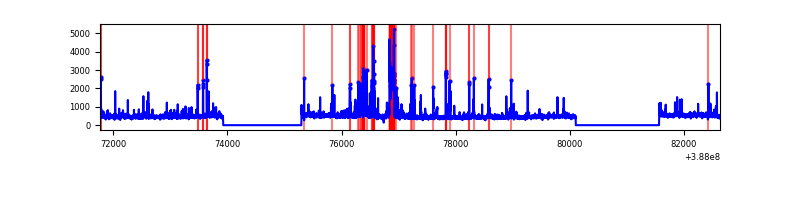 |
Top three noisy pixels from each quadrant. If the there are fewer than three noisy pixels in the level2.evt file, extra rows are filled as -1
| Pixel properties | Quadrant properties | ||||||
|---|---|---|---|---|---|---|---|
| Quadrant | DetID | PixID | Counts | Sigma | Mean | Median | Sigma |
| A | 10 | 83 | 151234 | 794.01 | 937 | 918 | 189.3 |
| A | 13 | 6 | 14589 | 72.21 | 937 | 918 | 189.3 |
| A | 13 | 254 | 11693 | 56.92 | 937 | 918 | 189.3 |
| B | 5 | 236 | 4721838 | 28215.5 | 861 | 835 | 167.3 |
| B | 5 | 200 | 203227 | 1209.61 | 861 | 835 | 167.3 |
| B | 5 | 172 | 161659 | 961.18 | 861 | 835 | 167.3 |
| C | 0 | 10 | 339463 | 1593.48 | 907 | 913 | 212.5 |
| C | 15 | 214 | 322923 | 1515.63 | 907 | 913 | 212.5 |
| C | 0 | 207 | 66024 | 306.46 | 907 | 913 | 212.5 |
| D | 13 | 249 | 350159 | 1573.69 | 906 | 880 | 221.9 |
| D | 2 | 153 | 124345 | 556.28 | 906 | 880 | 221.9 |
| D | 12 | 233 | 110010 | 491.69 | 906 | 880 | 221.9 |
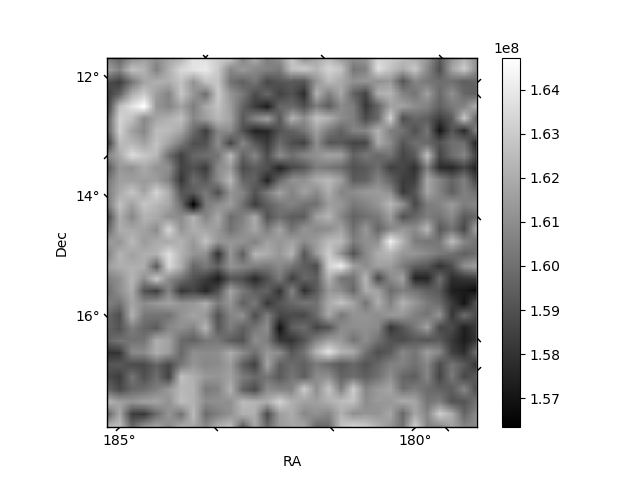
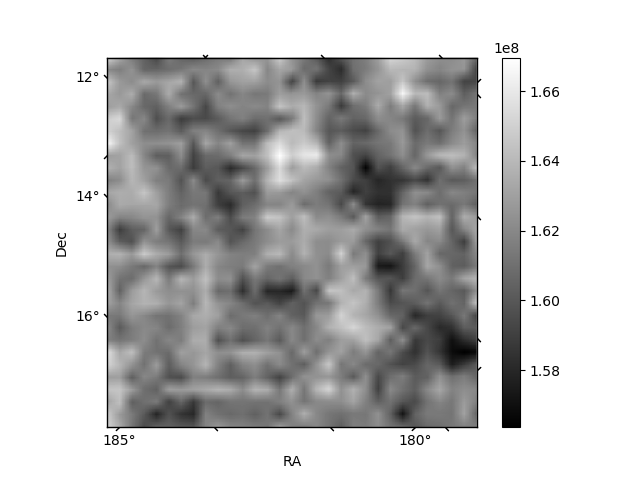
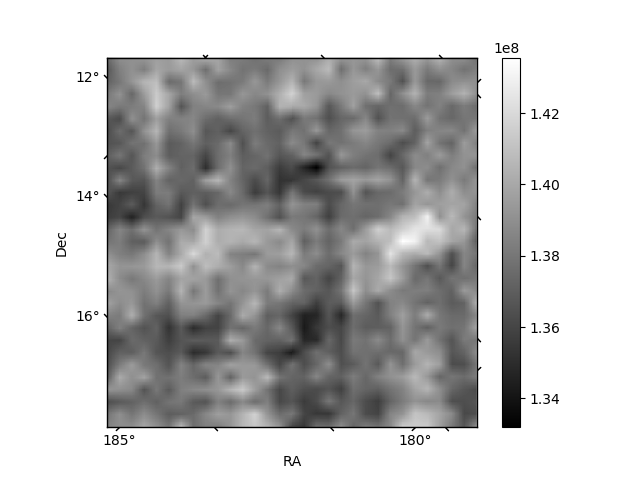
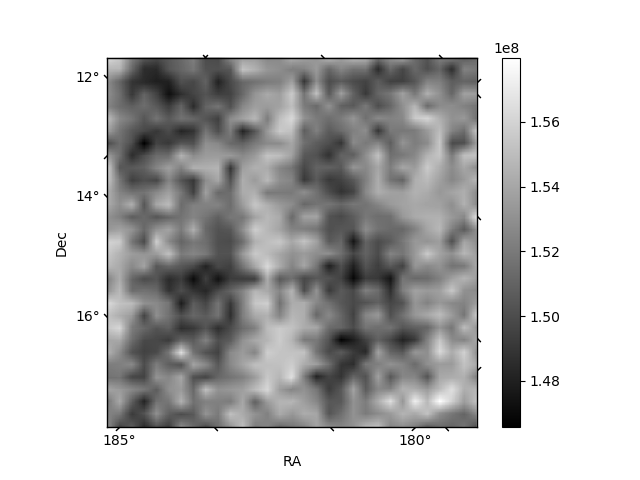
Histogram calculated using DETX and DETY for each event in the final _common_clean file
| Quadrant A | 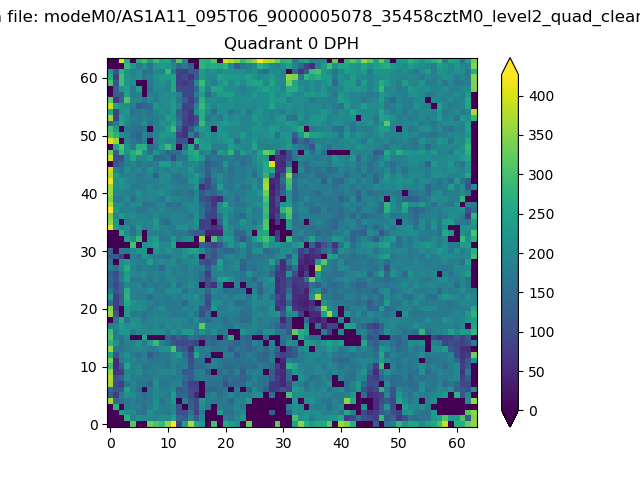 |
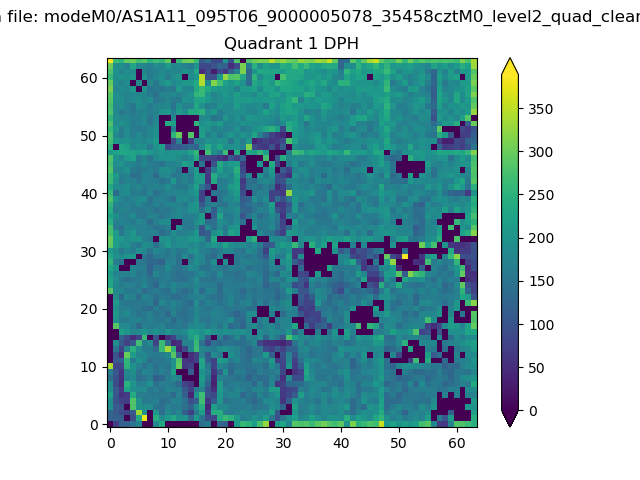 |
Quadrant B |
|---|---|---|---|
| Quadrant D | 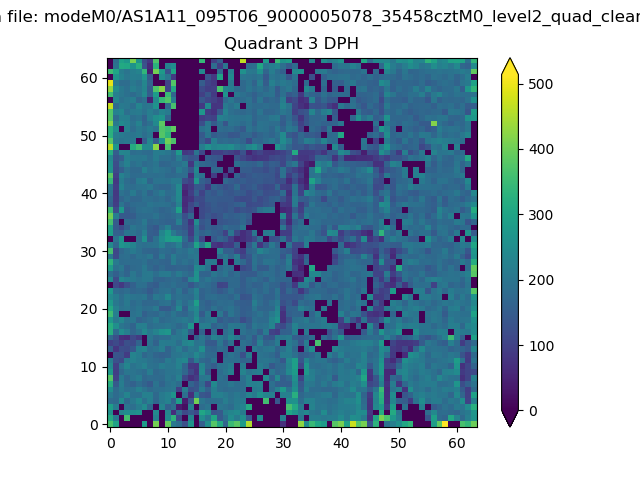 |
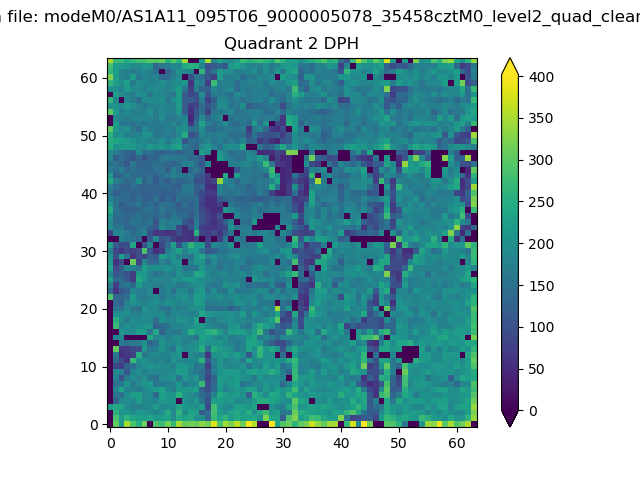 |
Quadrant C |
| Plot type | Count rate plots | Images |
|---|---|---|
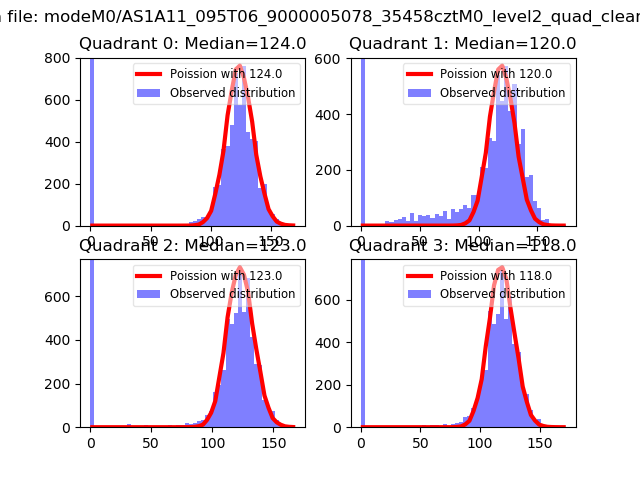
| Comparison with Poisson distribution Blue bars denote a histogram of data divided into 1 sec bins. Red curve is a Poisson curve with rate = median count rate of data. |
 |
 |
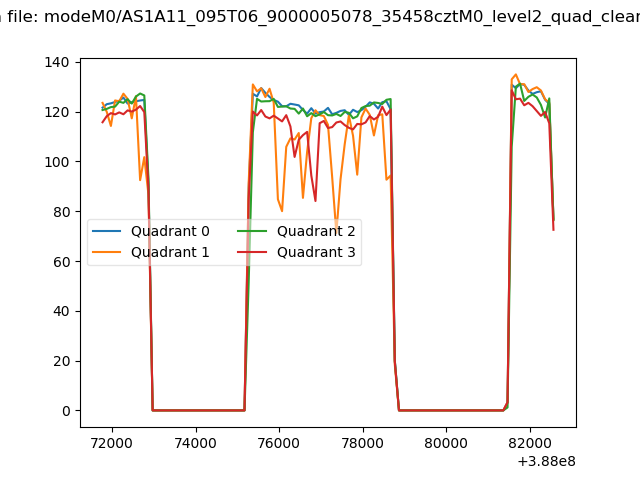
| Quadrant-wise count rates Data is divided into 100 sec bins |
 |
|
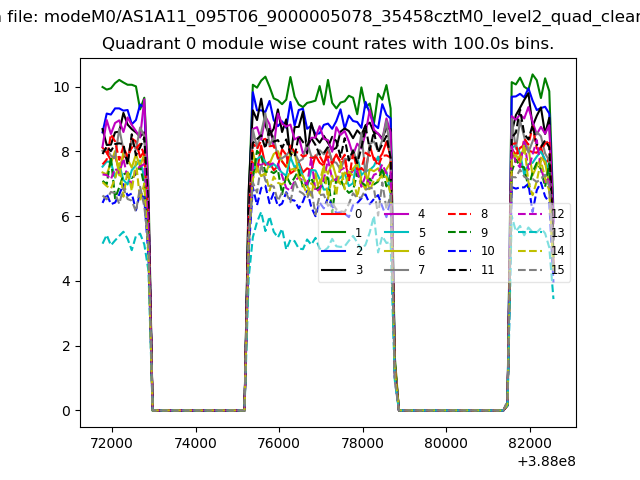
| Module-wise count rates for Quadrant A Data is divided into 100 sec bins |
 |
 |
| Module-wise count rates for Quadrant B Data is divided into 100 sec bins |
 |
 |
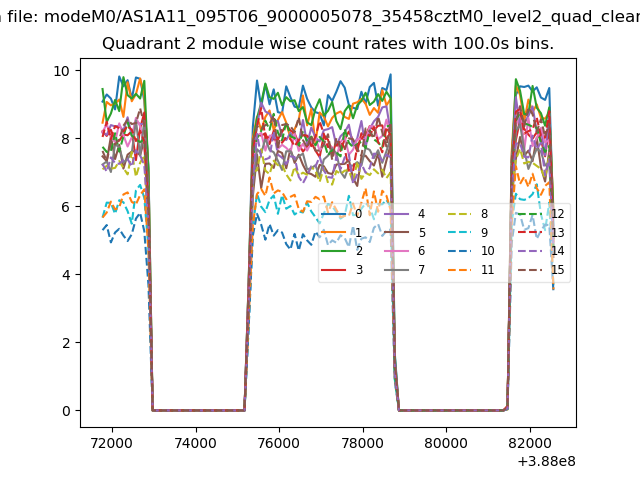
| Module-wise count rates for Quadrant C Data is divided into 100 sec bins |
 |
 |
| Module-wise count rates for Quadrant D Data is divided into 100 sec bins |
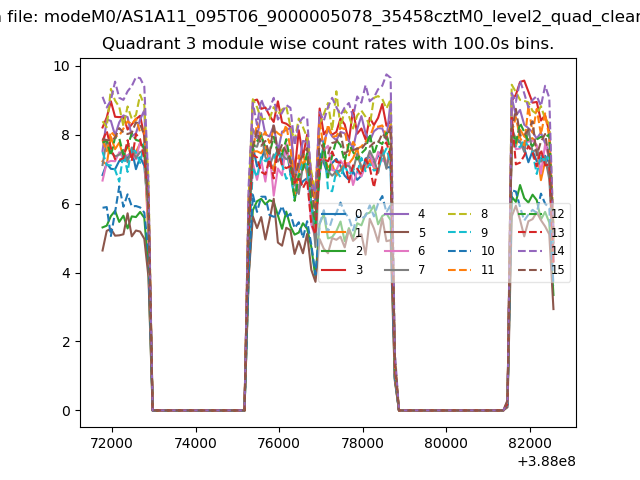 |
 |
| Parameter | Plot |
|---|---|
| CZT HV Monitor | 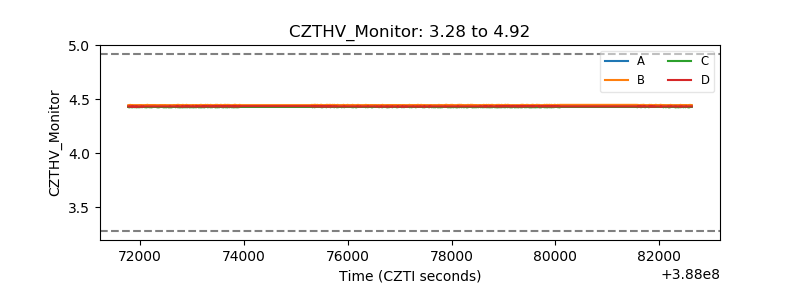 |
| D_VDD | 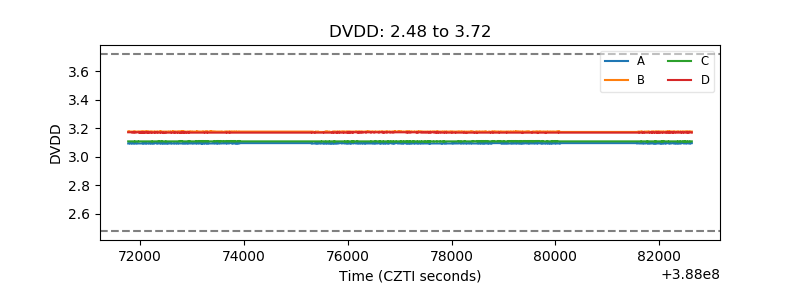 |
| Temperature 1 | 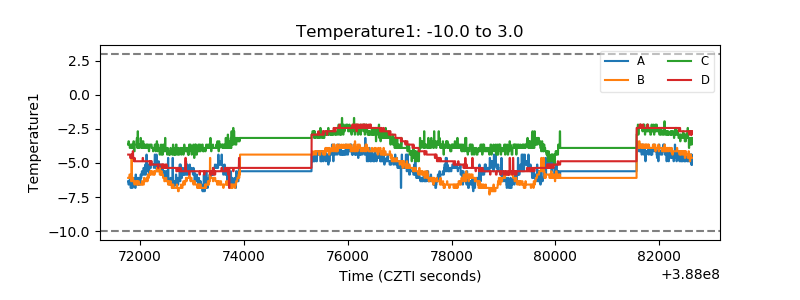 |
| Veto HV Monitor | 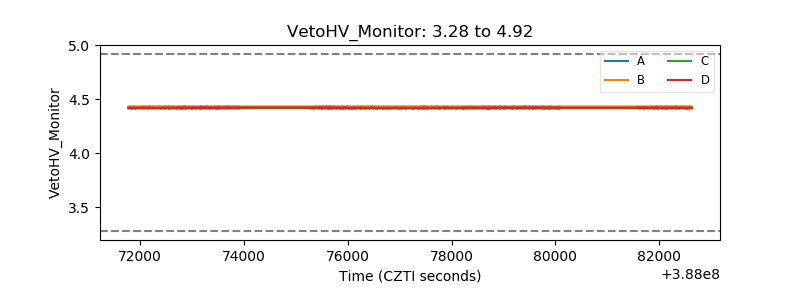 |
| Veto LLD | 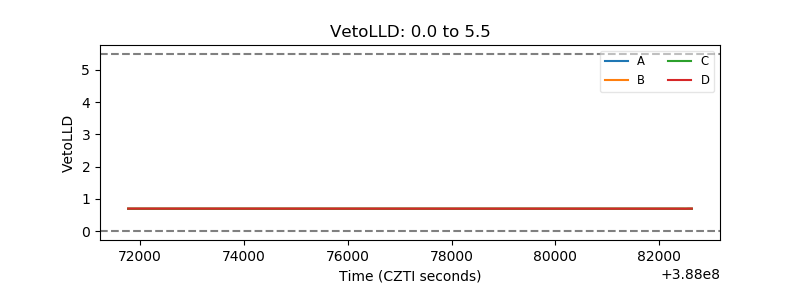 |
| Alpha Counter | 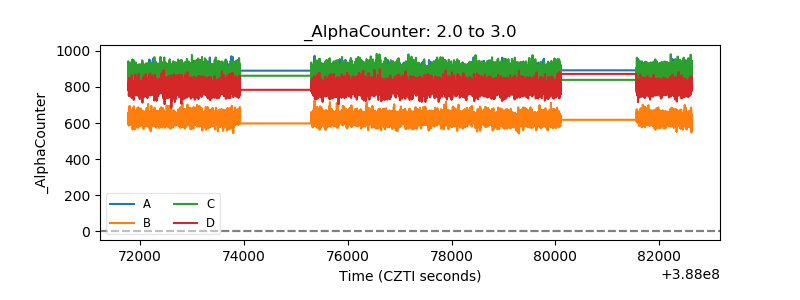 |
| _CPM_Rate | 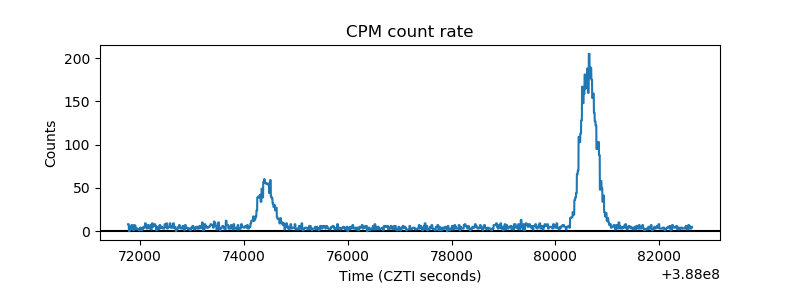 |
| CZT Counter | 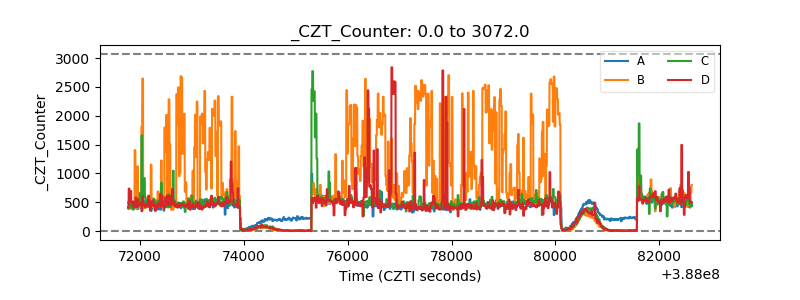 |
| +2.5 Volts monitor | 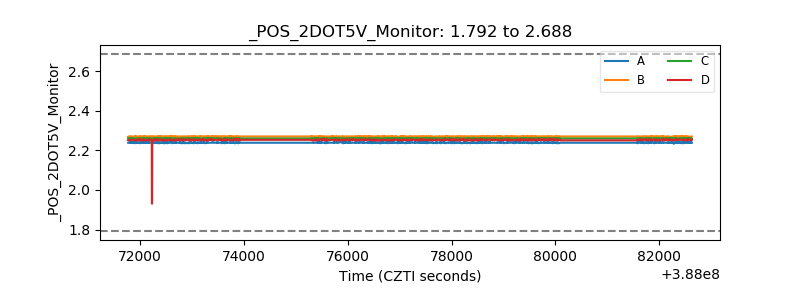 |
| +5 Volts monitor | 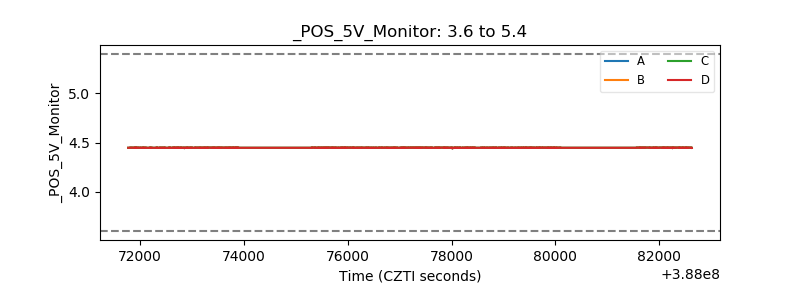 |
| _ROLL_ROT | 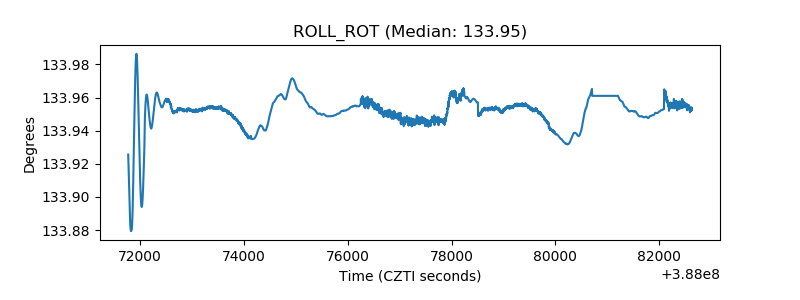 |
| _Roll_DEC | 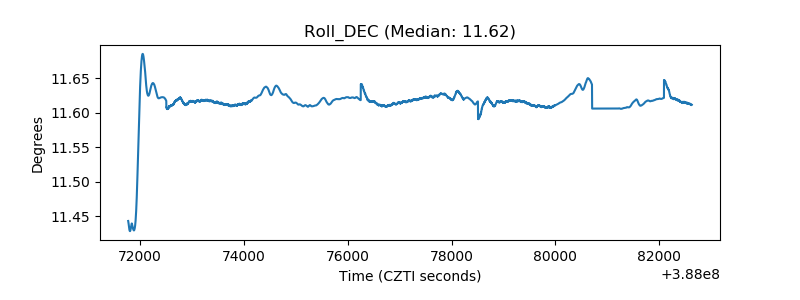 |
| _Roll_RA | 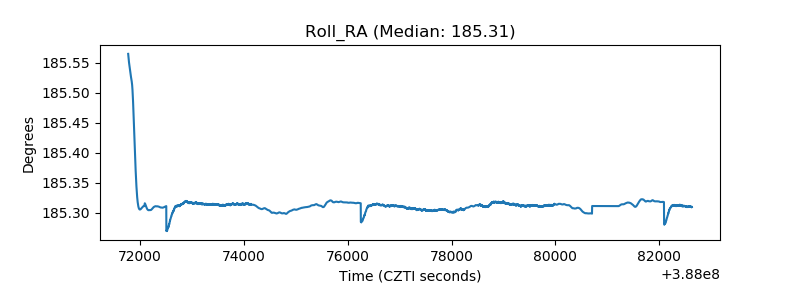 |
| Veto Counter | 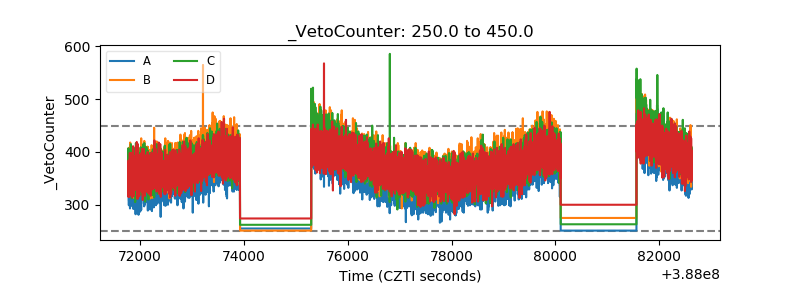 |