| Param | Original file | Final file |
|---|---|---|
| Filename | modeM0/AS1A11_095T06_9000005078cztM0_level2_bc.evt | modeM0/AS1A11_095T06_9000005078cztM0_level2_quad_clean.evt |
| Size (bytes) | 2,210,034,240 | 643,017,600 |
| Size | 2.1 GB | 613.2 MB |
| Events in quadrant A | 13,224,242 | 4,035,986 |
| Events in quadrant B | 15,926,561 | 4,044,611 |
| Events in quadrant C | 16,752,444 | 3,953,663 |
| Events in quadrant D | 17,391,872 | 3,777,960 |
| Mode M9 | |||
|---|---|---|---|
| Quadrant | BADHDUFLAG | Total packets | Discarded packets |
| A | 0 | 201 | 0 |
| B | 0 | 202 | 0 |
| C | 0 | 202 | 0 |
| D | 0 | 202 | 0 |
| Mode M0 | |||
|---|---|---|---|
| Quadrant | BADHDUFLAG | Total packets | Discarded packets |
| A | 0 | 114118 | 0 |
| B | 0 | 127406 | 0 |
| C | 0 | 124206 | 0 |
| D | 0 | 127394 | 0 |
| Mode SS | |||
|---|---|---|---|
| Quadrant | BADHDUFLAG | Total packets | Discarded packets |
| A | 0 | 1094 | 0 |
| B | 0 | 1094 | 0 |
| C | 0 | 1094 | 0 |
| D | 0 | 1094 | 0 |
| Quadrant | Total seconds | Saturated seconds | Saturation percentage |
|---|---|---|---|
| A | 53383 | 186 | 0.348426% |
| B | 53383 | 1664 | 3.117097% |
| C | 53383 | 945 | 1.770226% |
| D | 53383 | 1012 | 1.895735% |
Noise dominated data is calculated using 1-second bins in cleaned event files. If a bin has >2000 counts, and if more than 50% of those come from <1% of pixels, then it is considered to be noise-dominated and hence unusable.
| Quadrant | # 1 sec bins | Bins with >0 counts | Bins with >2000 counts | High rate bins dominated by noise | Noise dominated (total time) | Noise dominated (detector-on time) | Marked lightcurve |
|---|---|---|---|---|---|---|---|
| A | 75911 | 53396 | 37 | 37 | 0.05% | 0.07% | 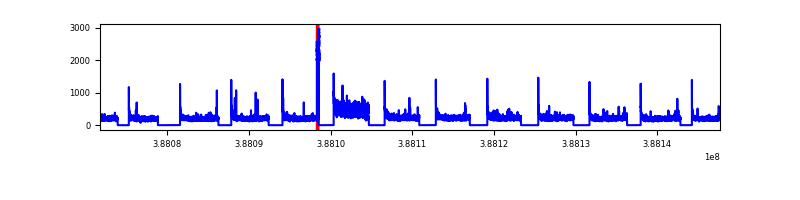 |
| B | 75911 | 53385 | 64 | 64 | 0.08% | 0.12% | 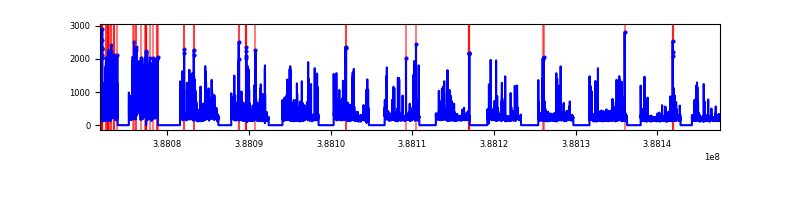 |
| C | 75911 | 53385 | 182 | 182 | 0.24% | 0.34% | 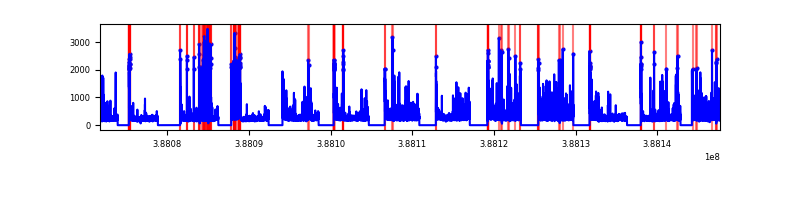 |
| D | 75911 | 53385 | 379 | 379 | 0.50% | 0.71% | 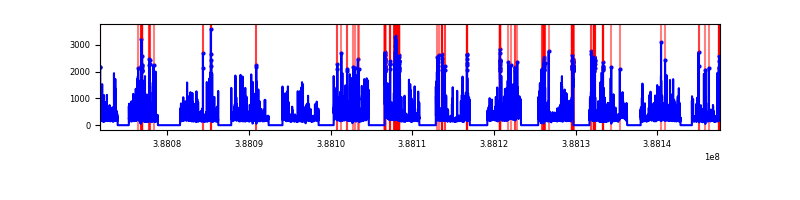 |
Top three noisy pixels from each quadrant. If the there are fewer than three noisy pixels in the level2.evt file, extra rows are filled as -1
| Pixel properties | Quadrant properties | ||||||
|---|---|---|---|---|---|---|---|
| Quadrant | DetID | PixID | Counts | Sigma | Mean | Median | Sigma |
| A | 15 | 169 | 1450898 | 2371.4 | 2773 | 2729 | 610.7 |
| A | 10 | 83 | 924304 | 1509.1 | 2773 | 2729 | 610.7 |
| A | 13 | 6 | 108847 | 173.77 | 2773 | 2729 | 610.7 |
| B | 5 | 236 | 3451953 | 6387.29 | 2784 | 2721 | 540.0 |
| B | 5 | 172 | 688065 | 1269.12 | 2784 | 2721 | 540.0 |
| B | 5 | 200 | 400046 | 735.77 | 2784 | 2721 | 540.0 |
| C | 0 | 10 | 2508282 | 4085.33 | 2705 | 2682 | 613.3 |
| C | 15 | 214 | 2062094 | 3357.83 | 2705 | 2682 | 613.3 |
| C | 0 | 207 | 1484481 | 2416.04 | 2705 | 2682 | 613.3 |
| D | 13 | 249 | 1589920 | 2483.25 | 2704 | 2622 | 639.2 |
| D | 8 | 195 | 1171105 | 1828.04 | 2704 | 2622 | 639.2 |
| D | 7 | 80 | 1168246 | 1823.56 | 2704 | 2622 | 639.2 |
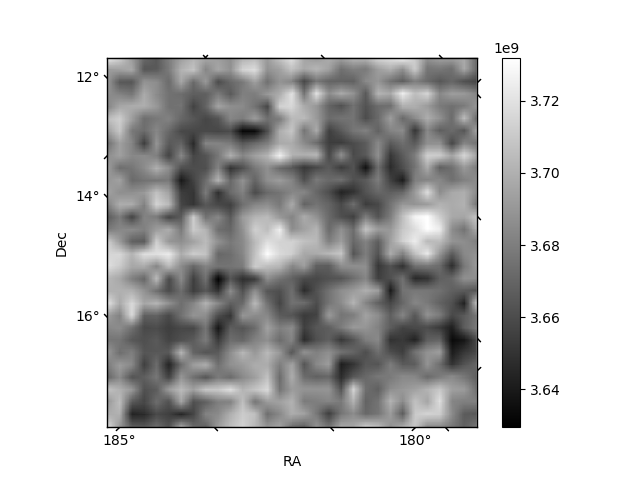
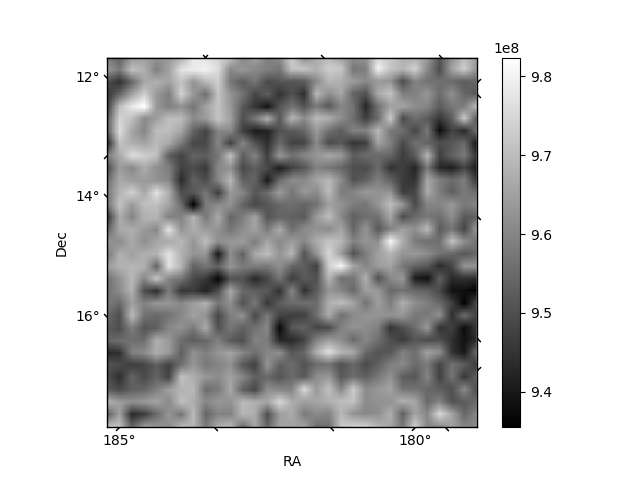
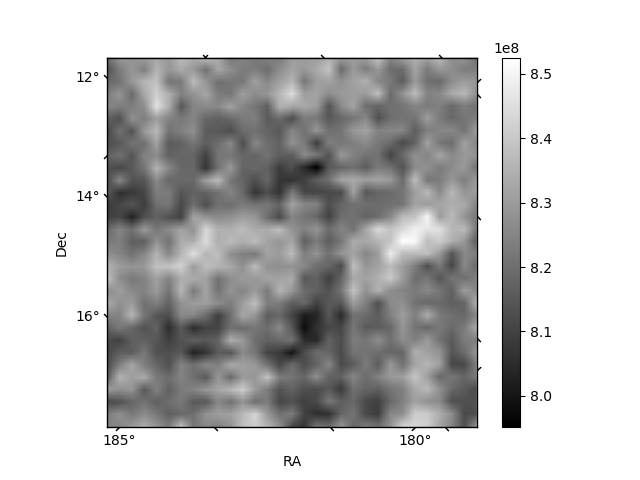
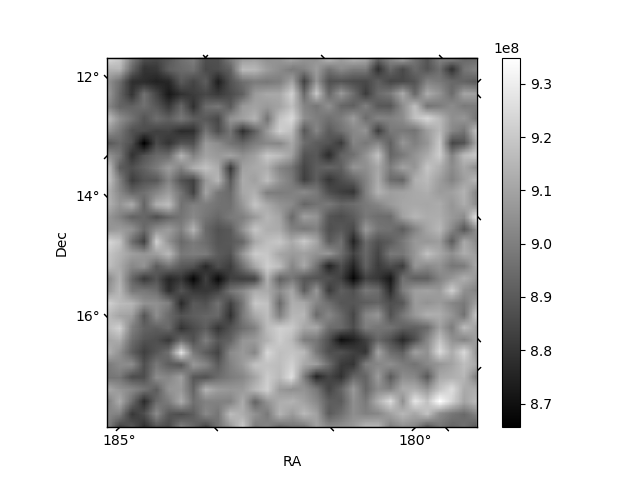
Histogram calculated using DETX and DETY for each event in the final _common_clean file
| Quadrant A | 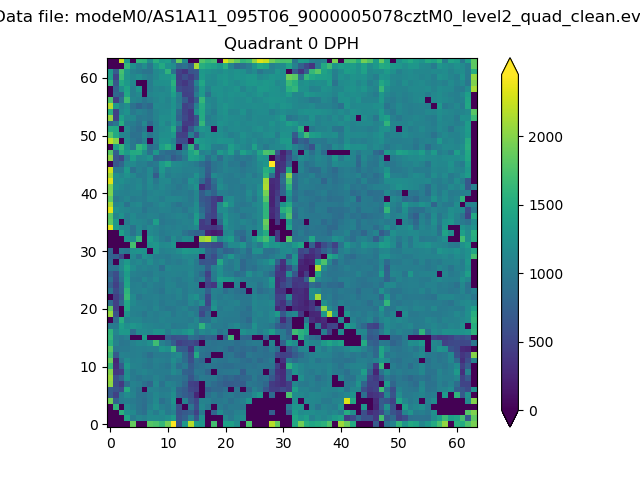 |
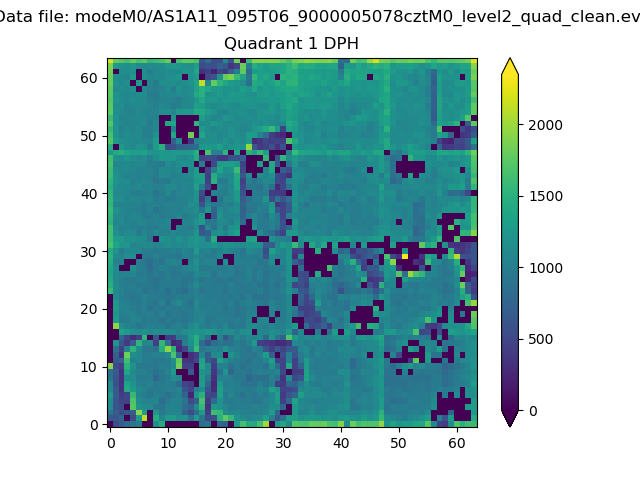 |
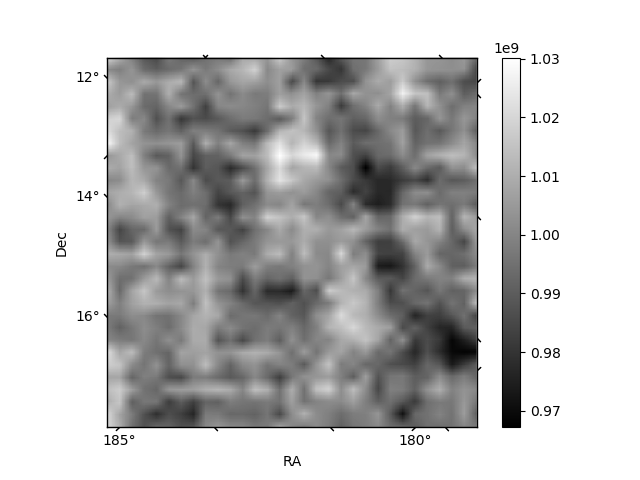
Quadrant B |
|---|---|---|---|
| Quadrant D | 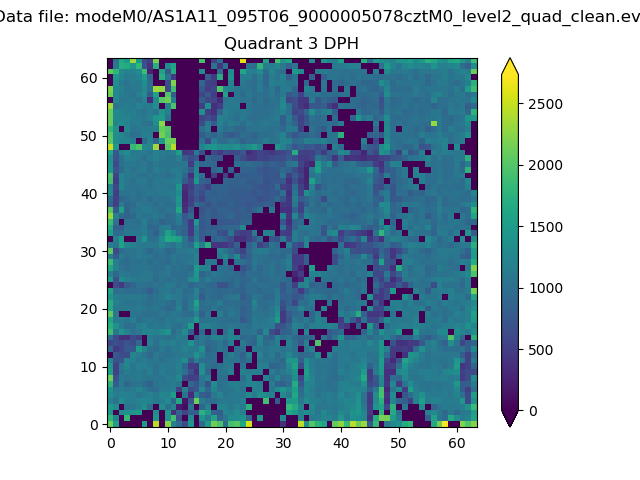 |
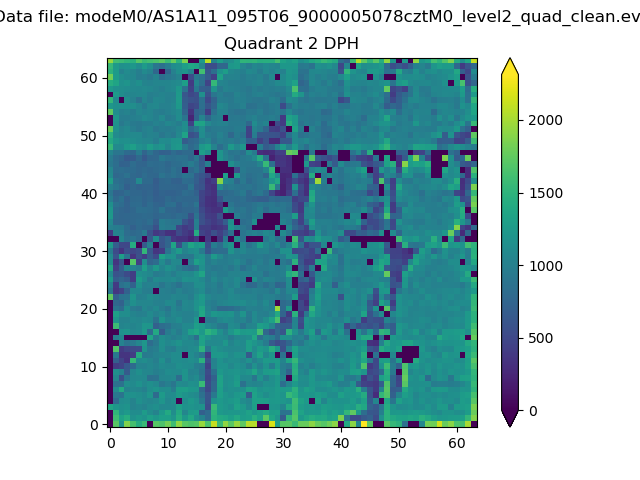 |
Quadrant C |
| Plot type | Count rate plots | Images |
|---|---|---|
| Comparison with Poisson distribution Blue bars denote a histogram of data divided into 1 sec bins. Red curve is a Poisson curve with rate = median count rate of data. |
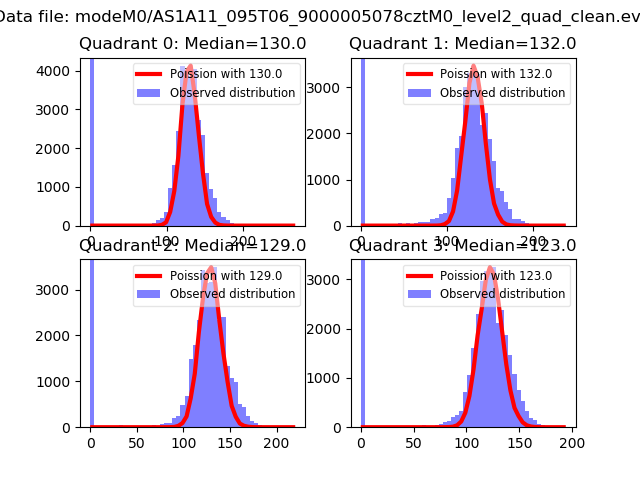 |
 |
| Quadrant-wise count rates Data is divided into 100 sec bins |
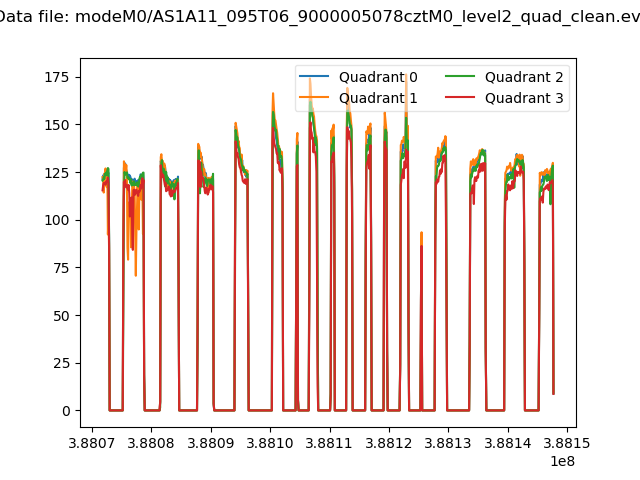 |
|
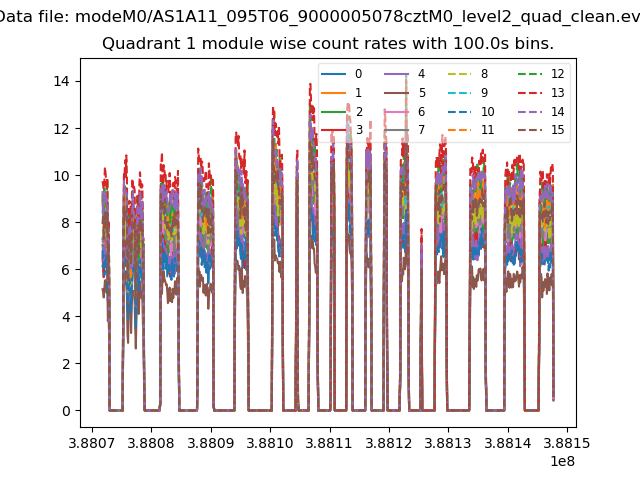
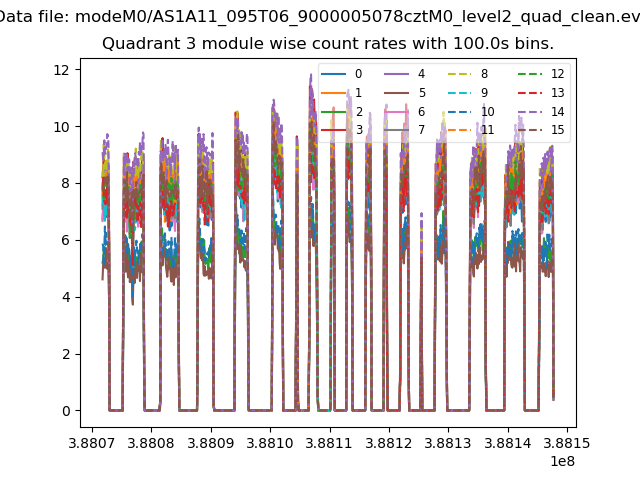
| Module-wise count rates for Quadrant A Data is divided into 100 sec bins |
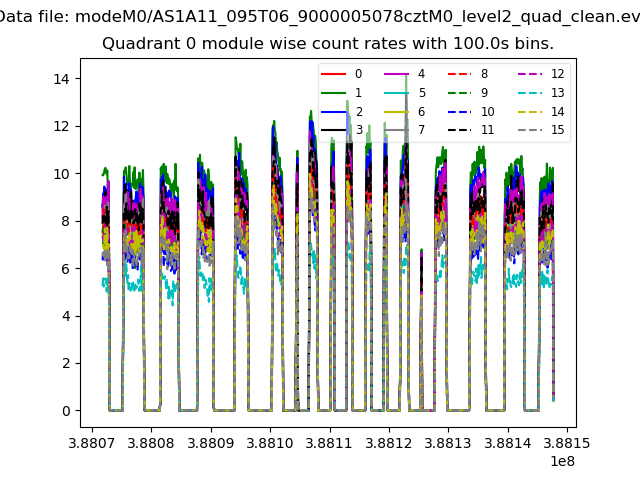 |
 |
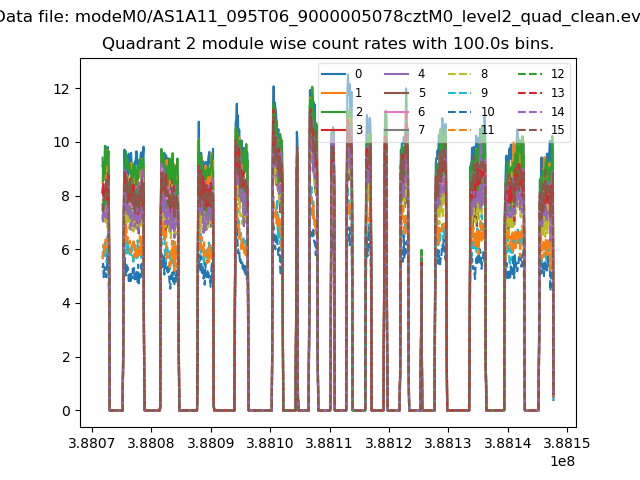
| Module-wise count rates for Quadrant B Data is divided into 100 sec bins |
 |
 |
| Module-wise count rates for Quadrant C Data is divided into 100 sec bins |
 |
 |
| Module-wise count rates for Quadrant D Data is divided into 100 sec bins |
 |
 |
| Parameter | Plot |
|---|---|
| CZT HV Monitor | 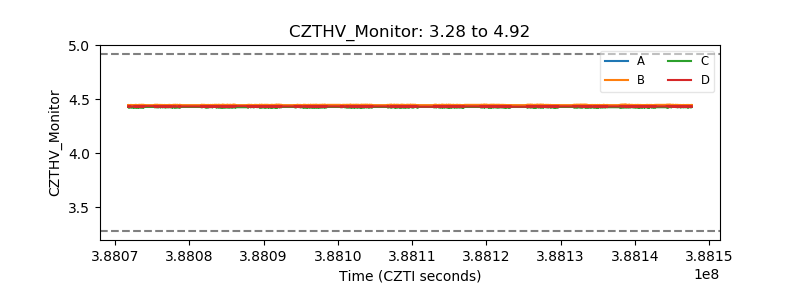 |
| D_VDD | 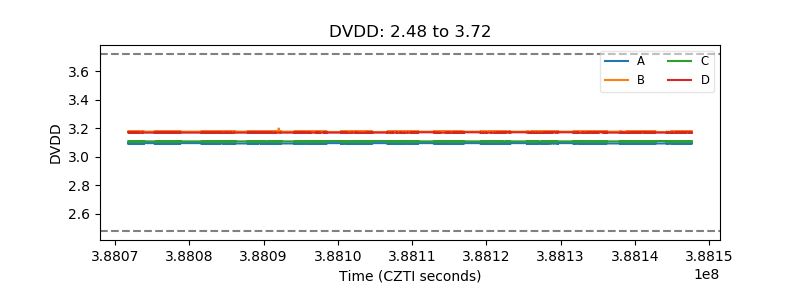 |
| Temperature 1 | 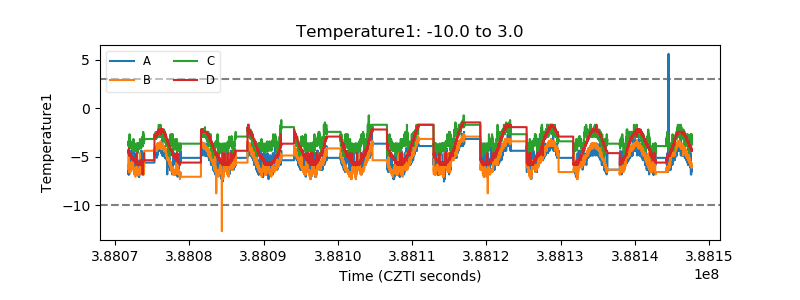 |
| Veto HV Monitor | 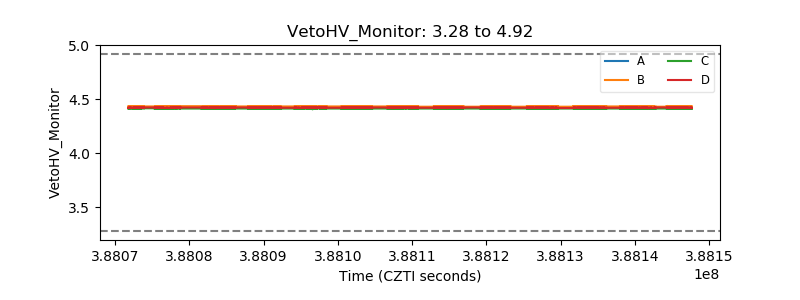 |
| Veto LLD | 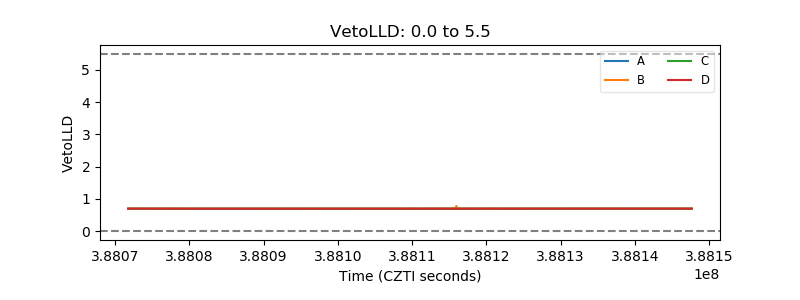 |
| Alpha Counter | 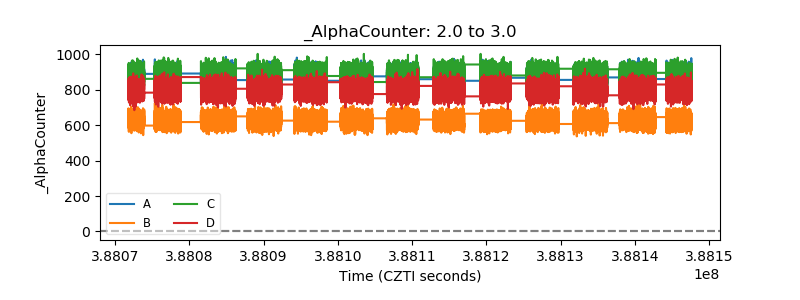 |
| _CPM_Rate | 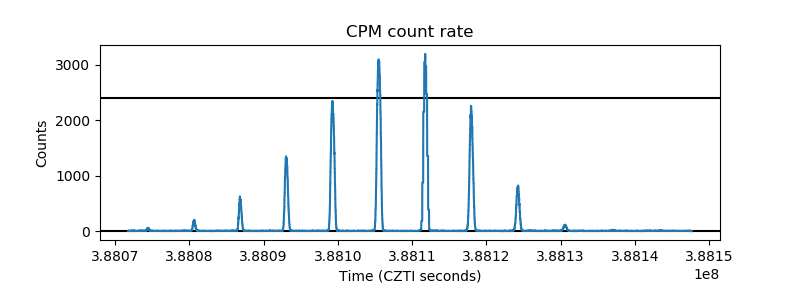 |
| CZT Counter | 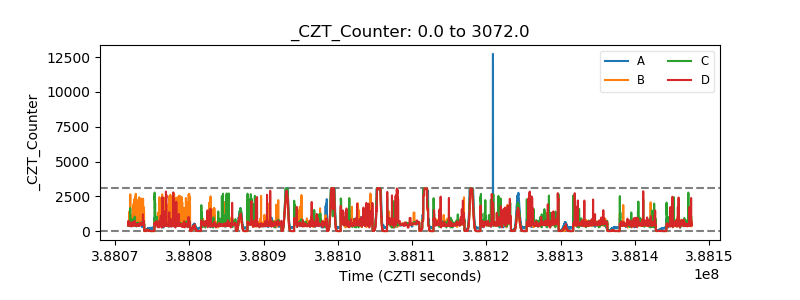 |
| +2.5 Volts monitor | 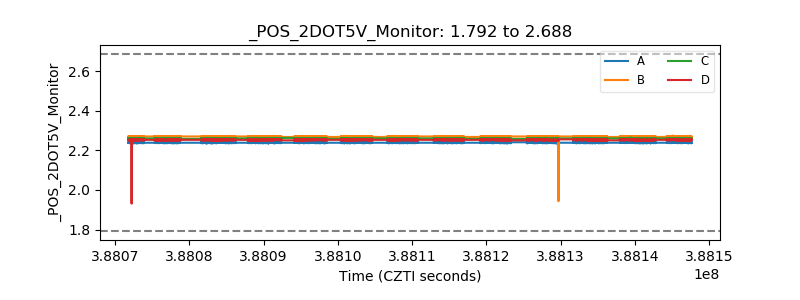 |
| +5 Volts monitor | 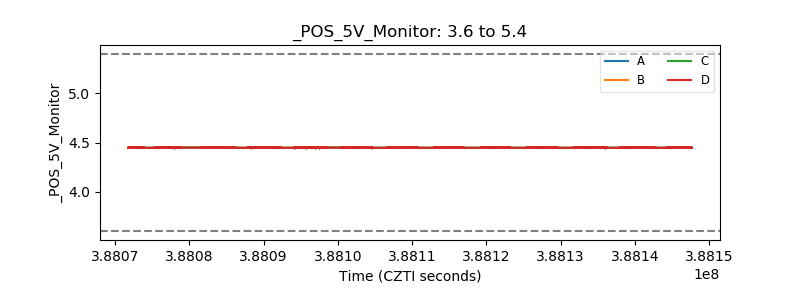 |
| _ROLL_ROT | 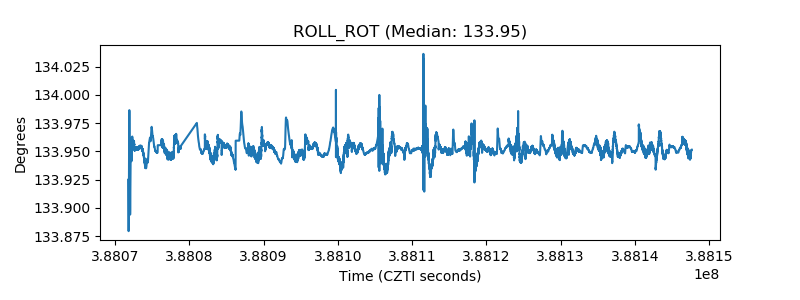 |
| _Roll_DEC | 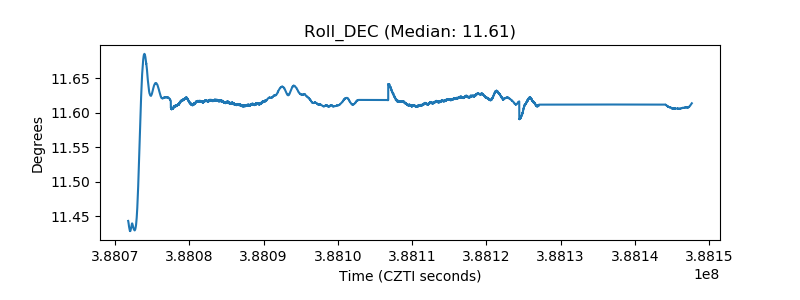 |
| _Roll_RA | 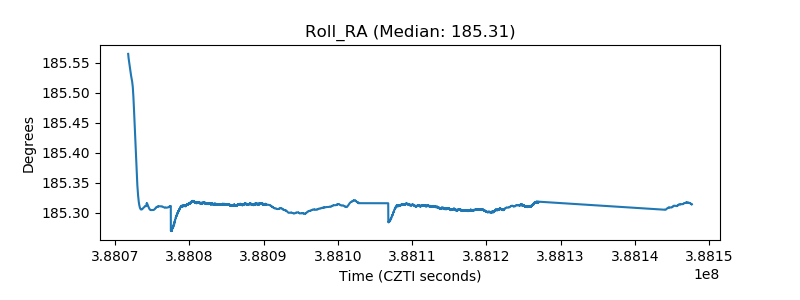 |
| Veto Counter | 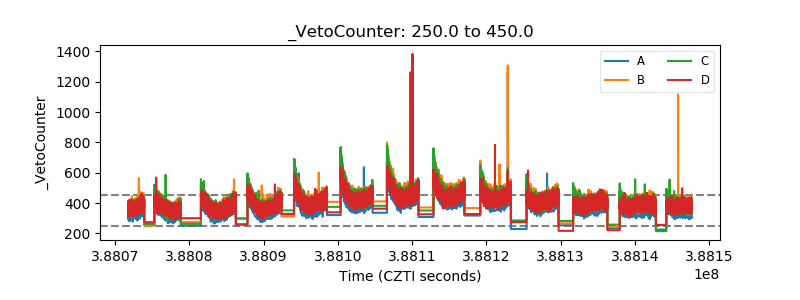 |