| Param | Original file | Final file |
|---|---|---|
| Filename | modeM0/AS1A11_068T03_9000005076_35458cztM0_level2.evt | modeM0/AS1A11_068T03_9000005076_35458cztM0_level2_quad_clean.evt |
| Size (bytes) | 184,740,480 | 40,446,720 |
| Size | 176.2 MB | 38.6 MB |
| Events in quadrant A | 1,078,954 | 273,587 |
| Events in quadrant B | 1,748,102 | 268,232 |
| Events in quadrant C | 1,336,014 | 264,514 |
| Events in quadrant D | 1,277,550 | 256,562 |
| Mode SS | |||
|---|---|---|---|
| Quadrant | BADHDUFLAG | Total packets | Discarded packets |
| A | 0 | 44 | 0 |
| B | 0 | 44 | 0 |
| C | 0 | 44 | 0 |
| D | 0 | 44 | 0 |
| Mode M0 | |||
|---|---|---|---|
| Quadrant | BADHDUFLAG | Total packets | Discarded packets |
| A | 0 | 4627 | 1 |
| B | 0 | 6628 | 1 |
| C | 0 | 5358 | 1 |
| D | 0 | 5144 | 1 |
| Mode M9 | |||
|---|---|---|---|
| Quadrant | BADHDUFLAG | Total packets | Discarded packets |
| A | 0 | 6 | 0 |
| B | 0 | 6 | 0 |
| C | 0 | 6 | 0 |
| D | 0 | 7 | 0 |
| Quadrant | Total seconds | Saturated seconds | Saturation percentage |
|---|---|---|---|
| A | 2241 | 2 | 0.089246% |
| B | 2241 | 157 | 7.005801% |
| C | 2241 | 73 | 3.257474% |
| D | 2241 | 30 | 1.338688% |
Noise dominated data is calculated using 1-second bins in cleaned event files. If a bin has >2000 counts, and if more than 50% of those come from <1% of pixels, then it is considered to be noise-dominated and hence unusable.
| Quadrant | # 1 sec bins | Bins with >0 counts | Bins with >2000 counts | High rate bins dominated by noise | Noise dominated (total time) | Noise dominated (detector-on time) | Marked lightcurve |
|---|---|---|---|---|---|---|---|
| A | 2241 | 2241 | 0 | 0 | 0.00% | 0.00% |  |
| B | 2241 | 2241 | 111 | 111 | 4.95% | 4.95% |  |
| C | 2241 | 2241 | 50 | 50 | 2.23% | 2.23% |  |
| D | 2241 | 2241 | 20 | 20 | 0.89% | 0.89% |  |
Top three noisy pixels from each quadrant. If the there are fewer than three noisy pixels in the level2.evt file, extra rows are filled as -1
| Pixel properties | Quadrant properties | ||||||
|---|---|---|---|---|---|---|---|
| Quadrant | DetID | PixID | Counts | Sigma | Mean | Median | Sigma |
| A | 10 | 83 | 60686 | 1122.46 | 260 | 254 | 53.8 |
| A | 13 | 6 | 7423 | 133.16 | 260 | 254 | 53.8 |
| A | 13 | 254 | 3915 | 68.0 | 260 | 254 | 53.8 |
| B | 5 | 236 | 361329 | 7216.51 | 250 | 243 | 50.0 |
| B | 5 | 172 | 197652 | 3945.33 | 250 | 243 | 50.0 |
| B | 4 | 251 | 102272 | 2039.11 | 250 | 243 | 50.0 |
| C | 0 | 10 | 198616 | 3385.57 | 247 | 248 | 58.6 |
| C | 15 | 214 | 92254 | 1570.28 | 247 | 248 | 58.6 |
| C | 0 | 207 | 79584 | 1354.04 | 247 | 248 | 58.6 |
| D | 1 | 47 | 79671 | 1241.44 | 253 | 247 | 64.0 |
| D | 13 | 249 | 70288 | 1094.77 | 253 | 247 | 64.0 |
| D | 8 | 195 | 55354 | 861.35 | 253 | 247 | 64.0 |
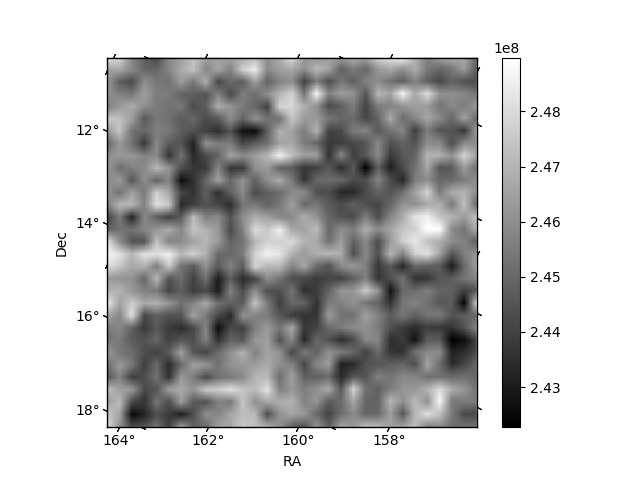
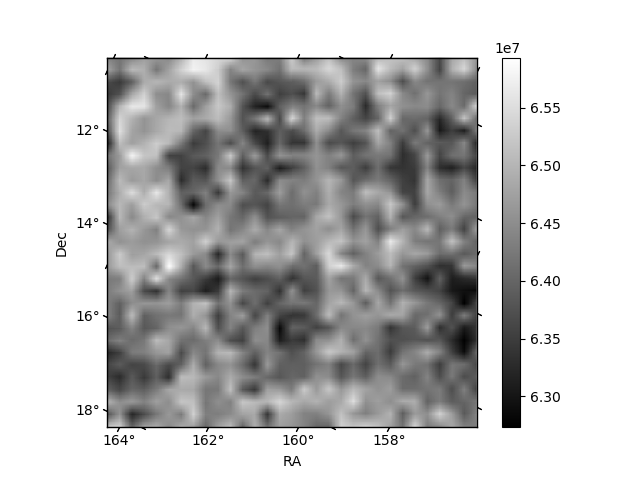
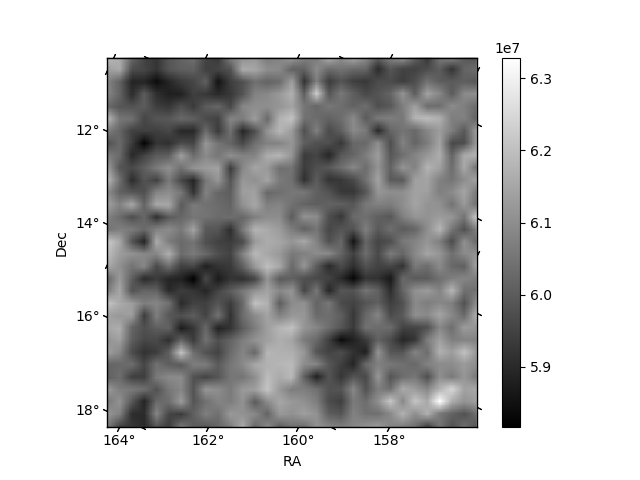
Histogram calculated using DETX and DETY for each event in the final _common_clean file
| Quadrant A | 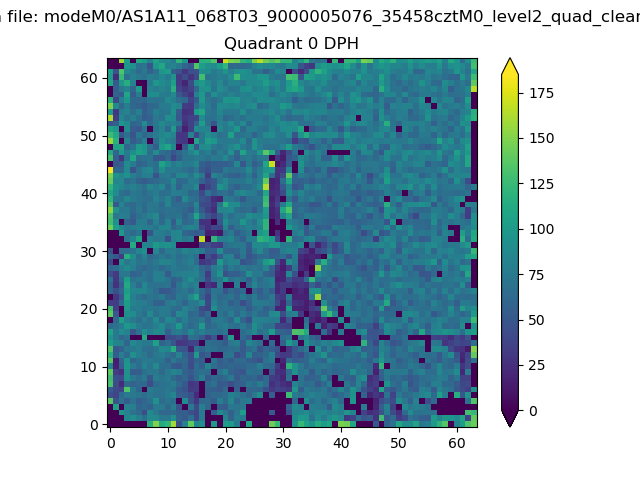 |
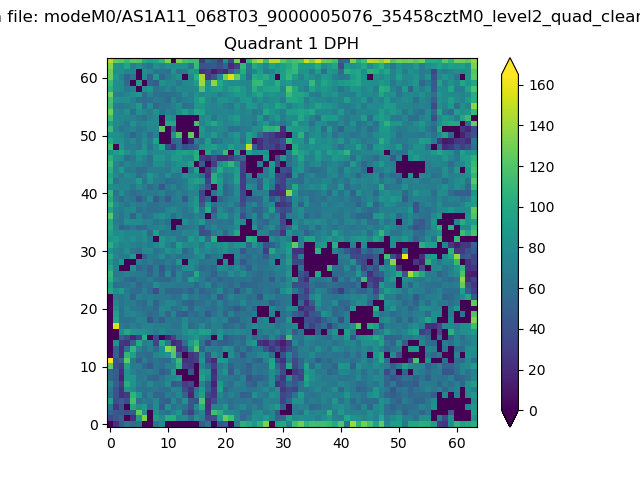 |
Quadrant B |
|---|---|---|---|
| Quadrant D | 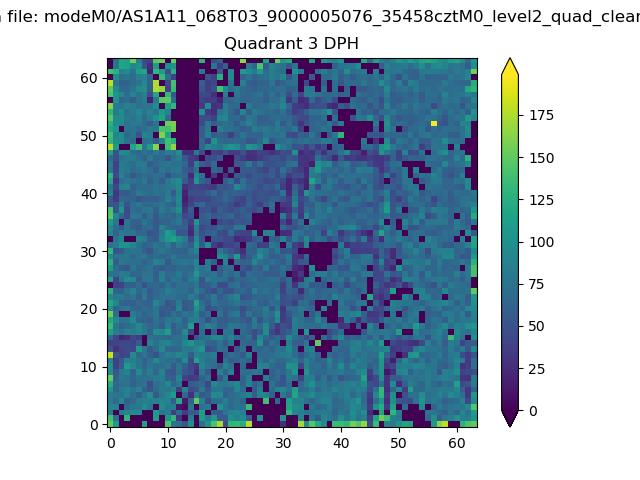 |
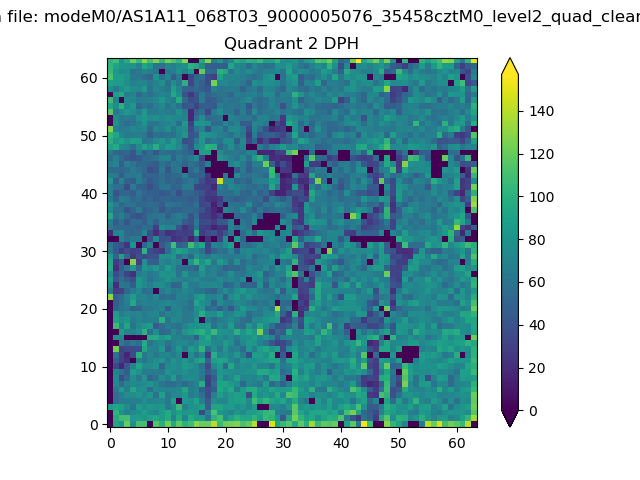 |
Quadrant C |
| Plot type | Count rate plots | Images |
|---|---|---|
| Comparison with Poisson distribution Blue bars denote a histogram of data divided into 1 sec bins. Red curve is a Poisson curve with rate = median count rate of data. |
 |
 |
| Quadrant-wise count rates Data is divided into 100 sec bins |
 |
|
| Module-wise count rates for Quadrant A Data is divided into 100 sec bins |
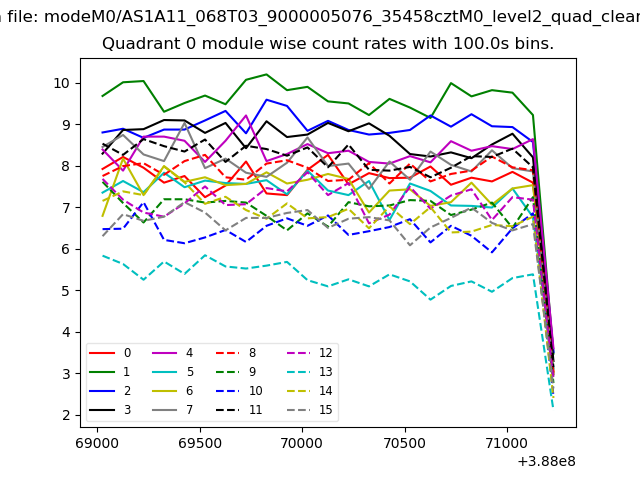 |
 |
| Module-wise count rates for Quadrant B Data is divided into 100 sec bins |
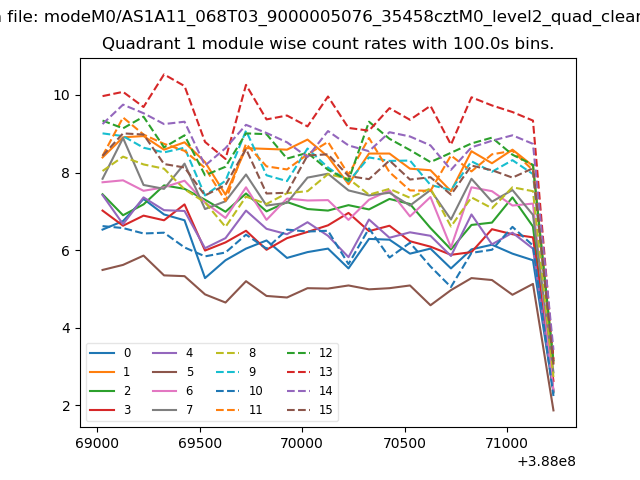 |
 |
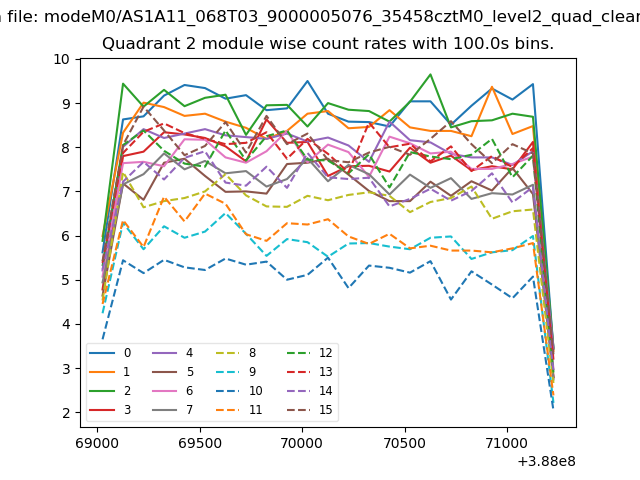
| Module-wise count rates for Quadrant C Data is divided into 100 sec bins |
 |
 |
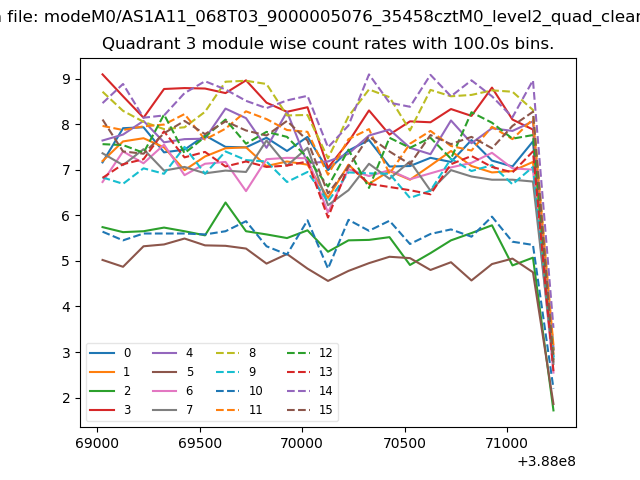
| Module-wise count rates for Quadrant D Data is divided into 100 sec bins |
 |
 |
| Parameter | Plot |
|---|---|
| CZT HV Monitor | 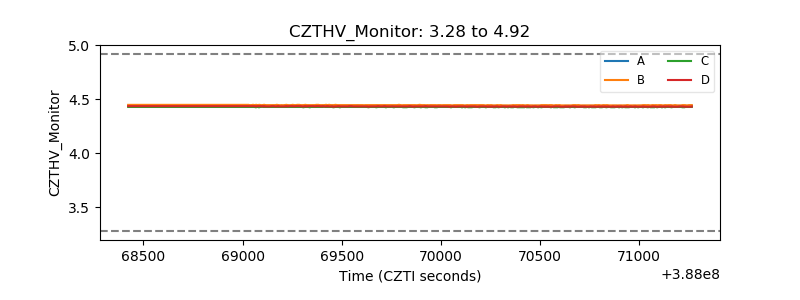 |
| D_VDD | 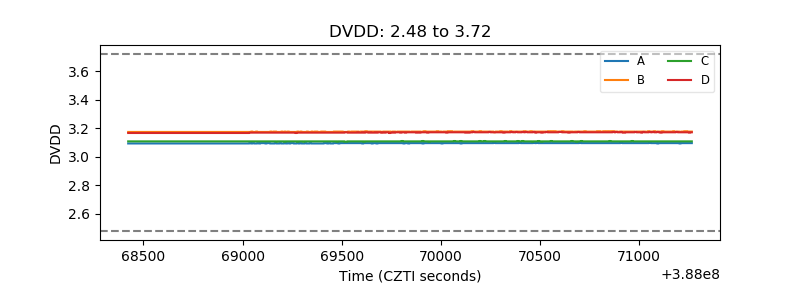 |
| Temperature 1 | 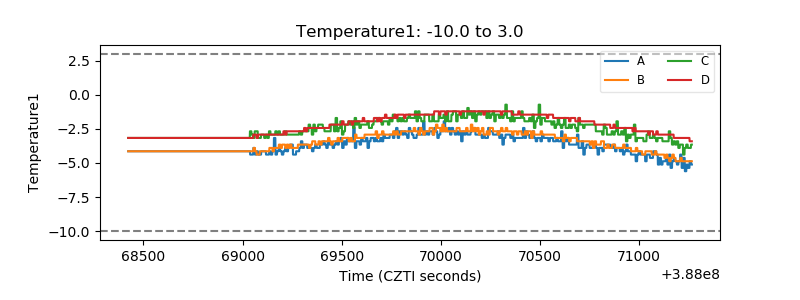 |
| Veto HV Monitor | 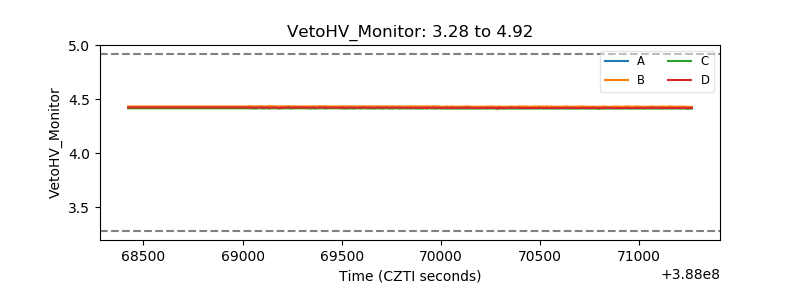 |
| Veto LLD | 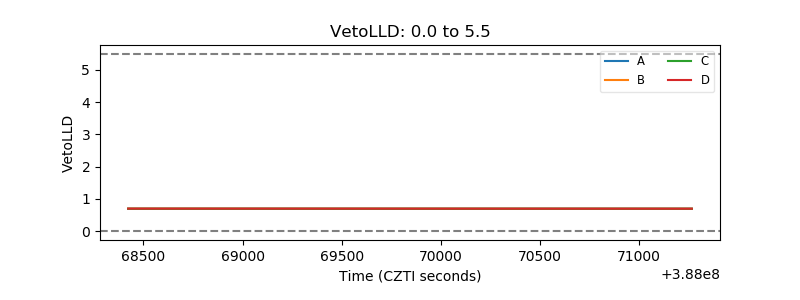 |
| Alpha Counter |  |
| _CPM_Rate | 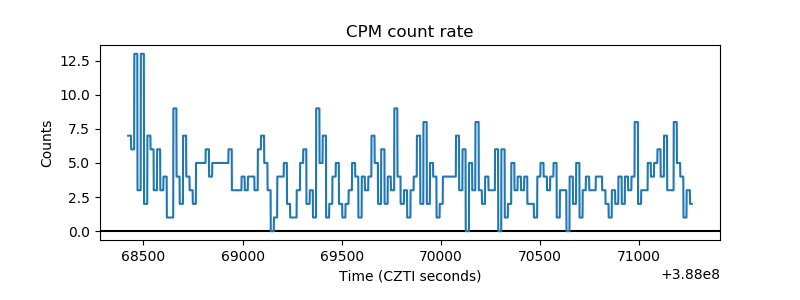 |
| CZT Counter | 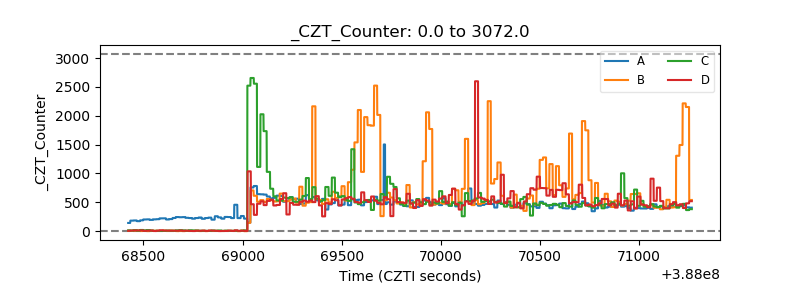 |
| +2.5 Volts monitor | 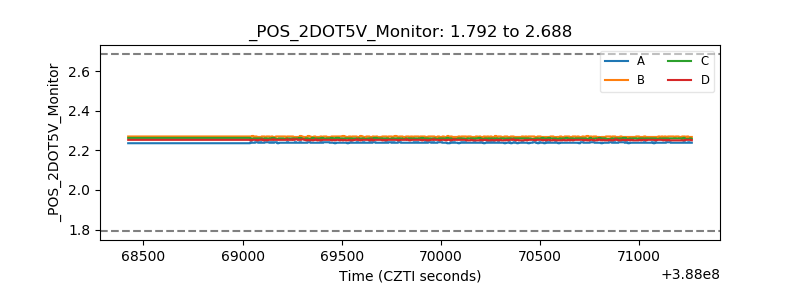 |
| +5 Volts monitor |  |
| _ROLL_ROT |  |
| _Roll_DEC | 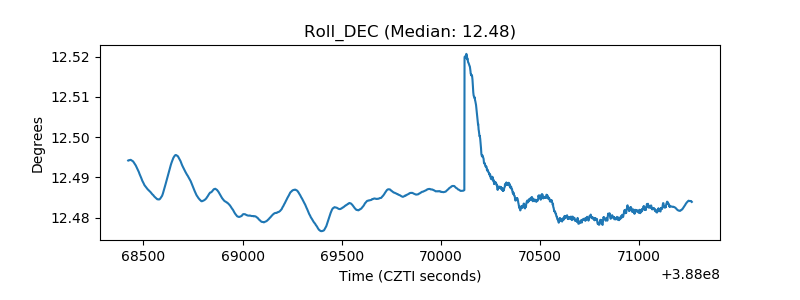 |
| _Roll_RA | 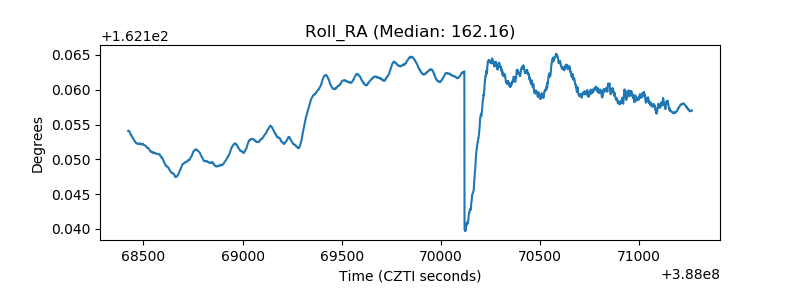 |
| Veto Counter | 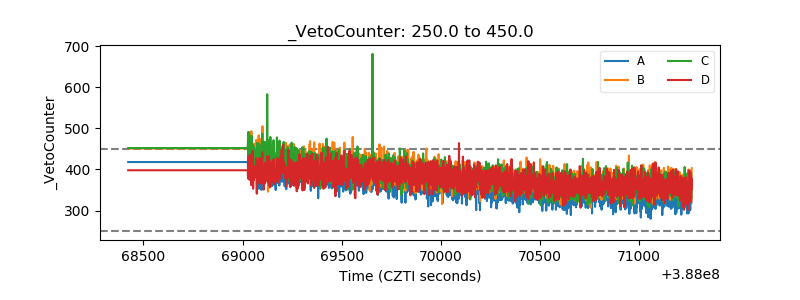 |