| Param | Original file | Final file |
|---|---|---|
| Filename | modeM0/AS1A11_068T03_9000005076_35455cztM0_level2.evt | modeM0/AS1A11_068T03_9000005076_35455cztM0_level2_quad_clean.evt |
| Size (bytes) | 606,729,600 | 79,153,920 |
| Size | 578.6 MB | 75.5 MB |
| Events in quadrant A | 2,912,965 | 528,156 |
| Events in quadrant B | 8,233,240 | 438,300 |
| Events in quadrant C | 3,265,575 | 523,793 |
| Events in quadrant D | 3,559,859 | 490,245 |
| Mode SS | |||
|---|---|---|---|
| Quadrant | BADHDUFLAG | Total packets | Discarded packets |
| A | 0 | 120 | 0 |
| B | 0 | 120 | 0 |
| C | 0 | 120 | 0 |
| D | 0 | 120 | 0 |
| Mode M0 | |||
|---|---|---|---|
| Quadrant | BADHDUFLAG | Total packets | Discarded packets |
| A | 0 | 12301 | 3 |
| B | 0 | 28408 | 2 |
| C | 0 | 13075 | 2 |
| D | 0 | 14390 | 2 |
| Mode M9 | |||
|---|---|---|---|
| Quadrant | BADHDUFLAG | Total packets | Discarded packets |
| A | 0 | 24 | 0 |
| B | 0 | 24 | 0 |
| C | 0 | 24 | 0 |
| D | 0 | 25 | 0 |
| Quadrant | Total seconds | Saturated seconds | Saturation percentage |
|---|---|---|---|
| A | 5951 | 8 | 0.134431% |
| B | 5951 | 2110 | 35.456226% |
| C | 5951 | 71 | 1.193077% |
| D | 5951 | 210 | 3.528819% |
Noise dominated data is calculated using 1-second bins in cleaned event files. If a bin has >2000 counts, and if more than 50% of those come from <1% of pixels, then it is considered to be noise-dominated and hence unusable.
| Quadrant | # 1 sec bins | Bins with >0 counts | Bins with >2000 counts | High rate bins dominated by noise | Noise dominated (total time) | Noise dominated (detector-on time) | Marked lightcurve |
|---|---|---|---|---|---|---|---|
| A | 7294 | 5952 | 2 | 2 | 0.03% | 0.03% | 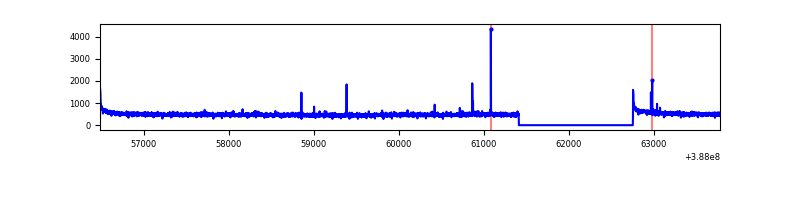 |
| B | 7294 | 5952 | 1624 | 1624 | 22.26% | 27.28% | 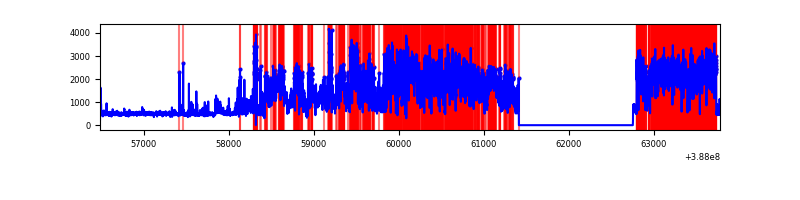 |
| C | 7294 | 5952 | 41 | 41 | 0.56% | 0.69% | 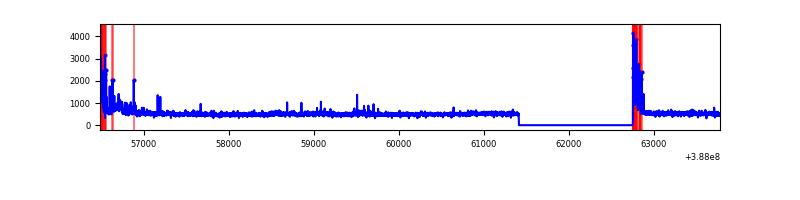 |
| D | 7294 | 5952 | 143 | 143 | 1.96% | 2.40% | 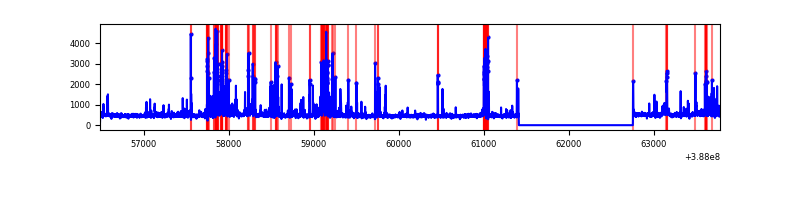 |
Top three noisy pixels from each quadrant. If the there are fewer than three noisy pixels in the level2.evt file, extra rows are filled as -1
| Pixel properties | Quadrant properties | ||||||
|---|---|---|---|---|---|---|---|
| Quadrant | DetID | PixID | Counts | Sigma | Mean | Median | Sigma |
| A | 10 | 83 | 136240 | 966.07 | 698 | 683 | 140.3 |
| A | 13 | 6 | 49713 | 349.42 | 698 | 683 | 140.3 |
| A | 9 | 143 | 22634 | 156.44 | 698 | 683 | 140.3 |
| B | 4 | 251 | 5369540 | 45328.15 | 606 | 591 | 118.4 |
| B | 5 | 236 | 181025 | 1523.34 | 606 | 591 | 118.4 |
| B | 5 | 172 | 152548 | 1282.92 | 606 | 591 | 118.4 |
| C | 15 | 214 | 246205 | 1552.98 | 675 | 678 | 158.1 |
| C | 0 | 10 | 235202 | 1483.39 | 675 | 678 | 158.1 |
| C | 14 | 67 | 65556 | 410.36 | 675 | 678 | 158.1 |
| D | 10 | 118 | 197677 | 1191.36 | 670 | 652 | 165.4 |
| D | 12 | 233 | 197102 | 1187.89 | 670 | 652 | 165.4 |
| D | 12 | 6 | 171799 | 1034.88 | 670 | 652 | 165.4 |
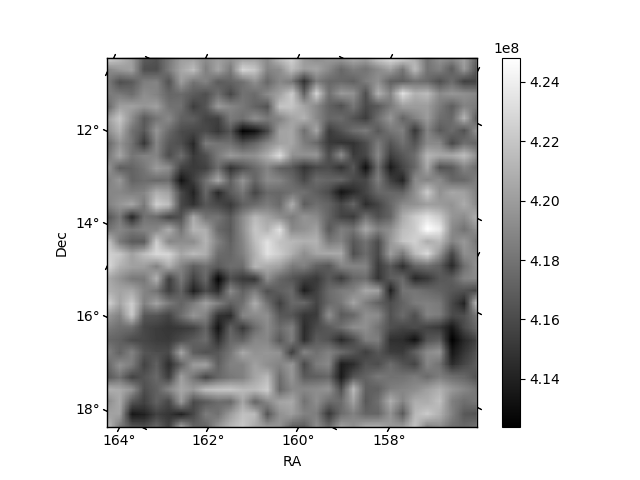
Histogram calculated using DETX and DETY for each event in the final _common_clean file
| Quadrant A | 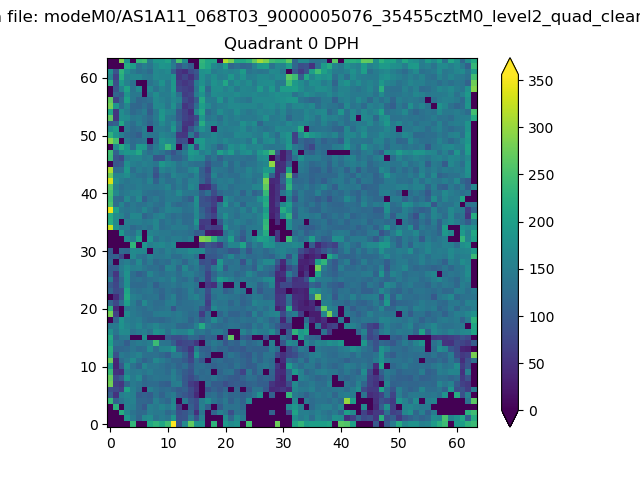 |
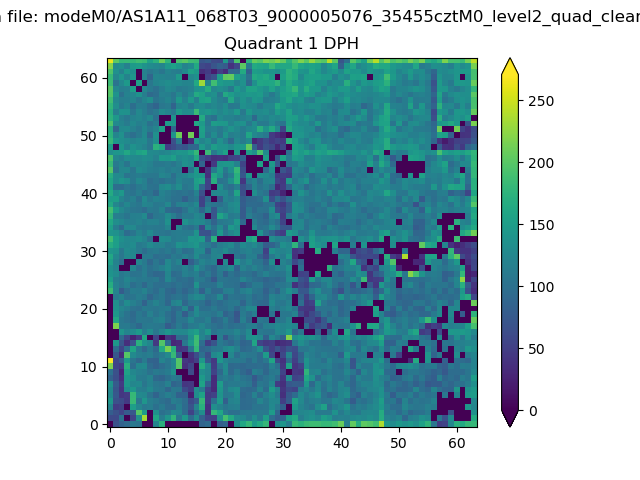 |
Quadrant B |
|---|---|---|---|
| Quadrant D | 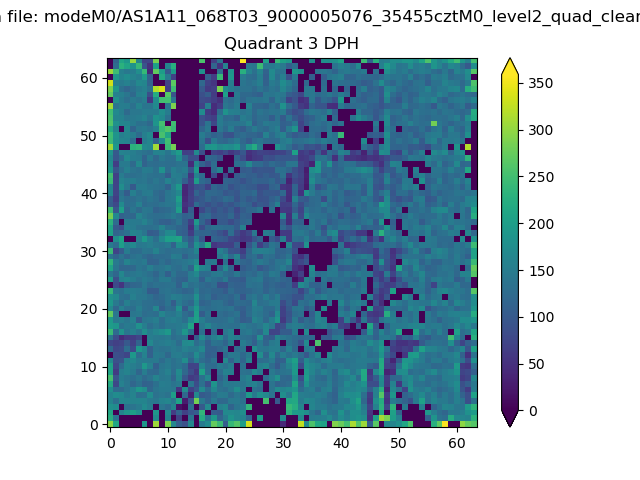 |
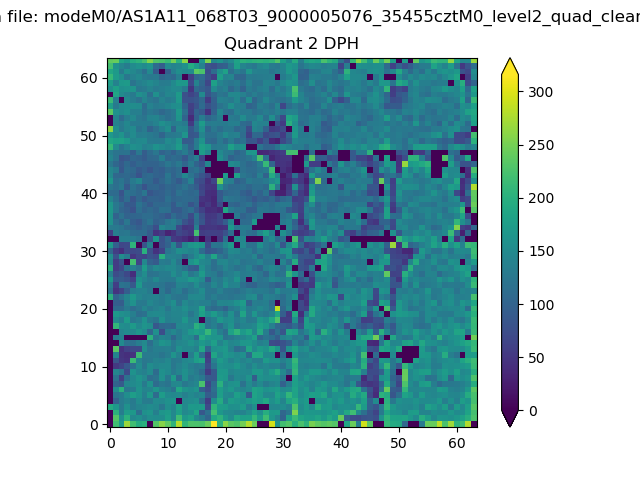 |
Quadrant C |
| Plot type | Count rate plots | Images |
|---|---|---|
| Comparison with Poisson distribution Blue bars denote a histogram of data divided into 1 sec bins. Red curve is a Poisson curve with rate = median count rate of data. |
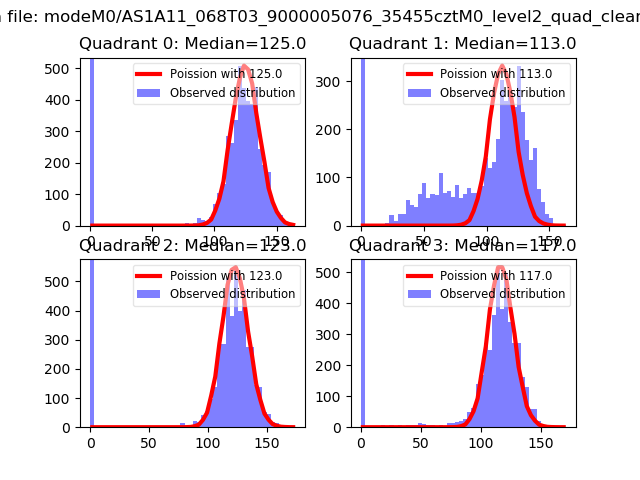 |
 |
| Quadrant-wise count rates Data is divided into 100 sec bins |
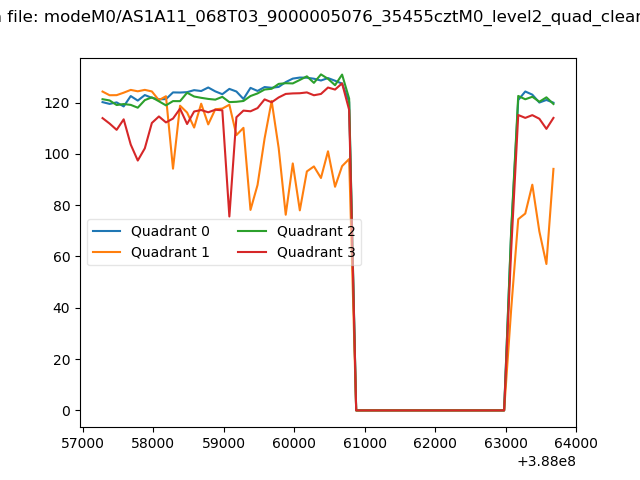 |
|
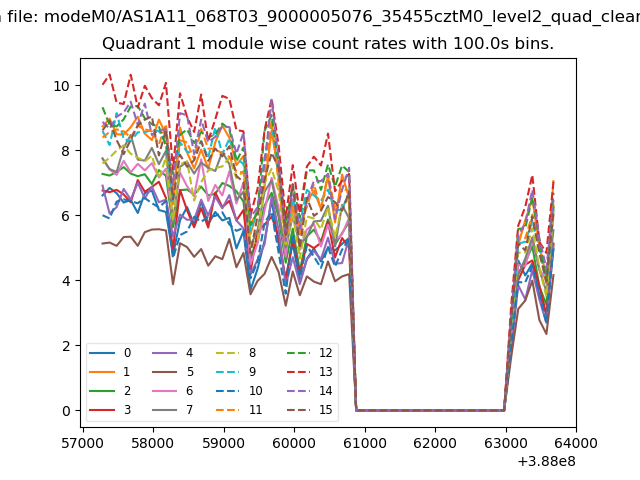
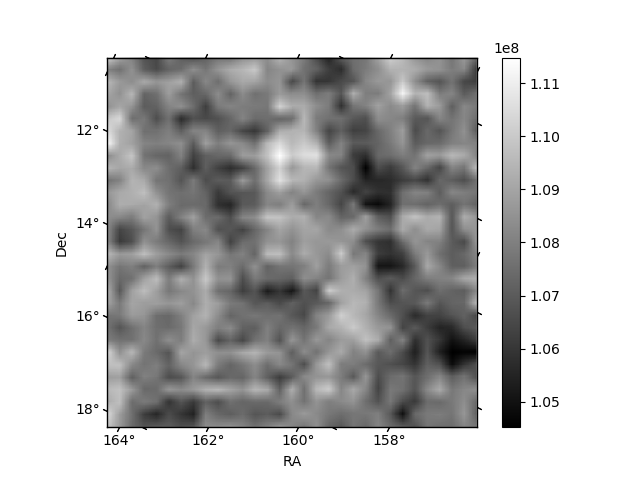
| Module-wise count rates for Quadrant A Data is divided into 100 sec bins |
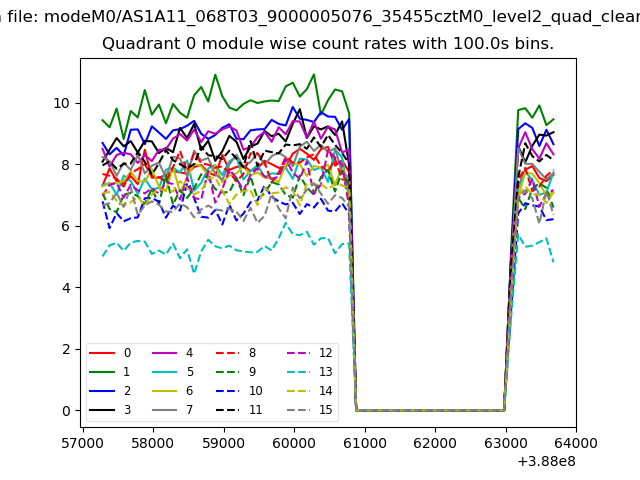 |
 |
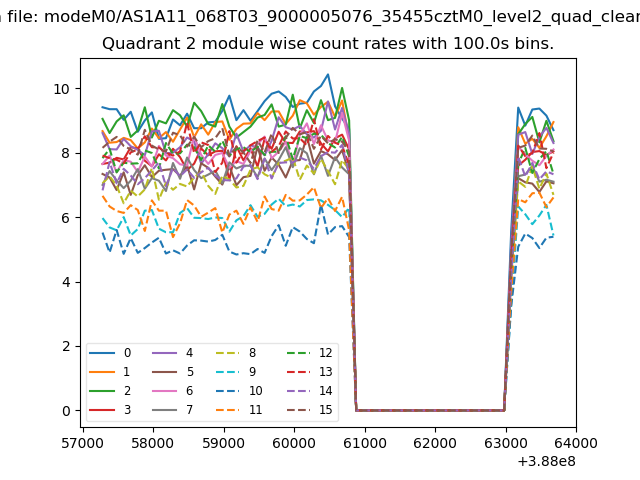
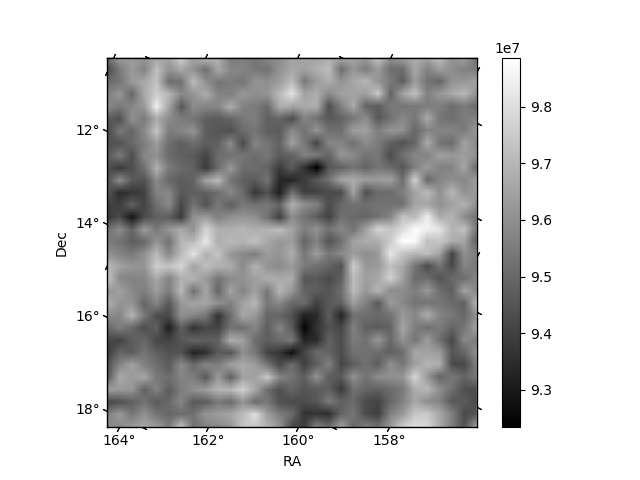
| Module-wise count rates for Quadrant B Data is divided into 100 sec bins |
 |
 |
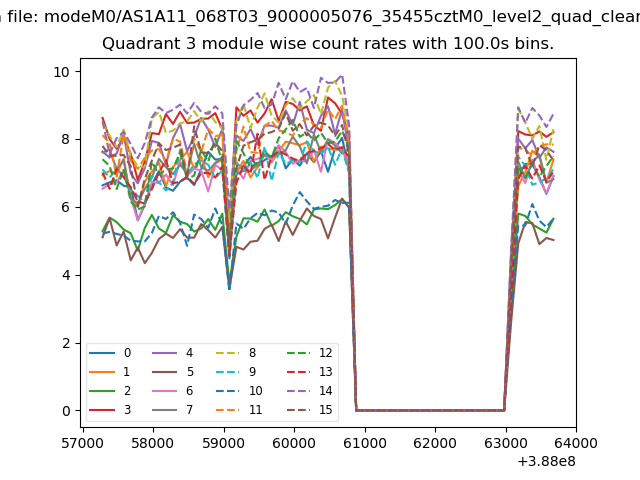
| Module-wise count rates for Quadrant C Data is divided into 100 sec bins |
 |
 |
| Module-wise count rates for Quadrant D Data is divided into 100 sec bins |
 |
 |
| Parameter | Plot |
|---|---|
| CZT HV Monitor | 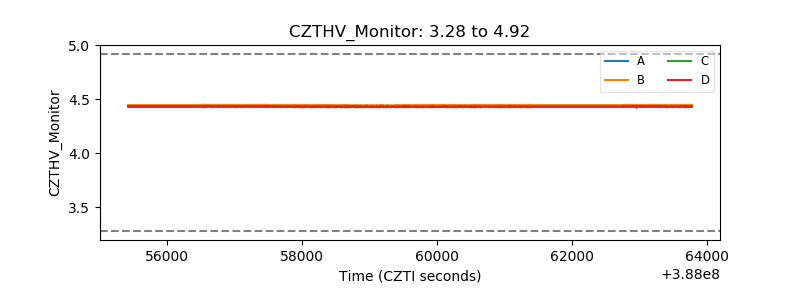 |
| D_VDD | 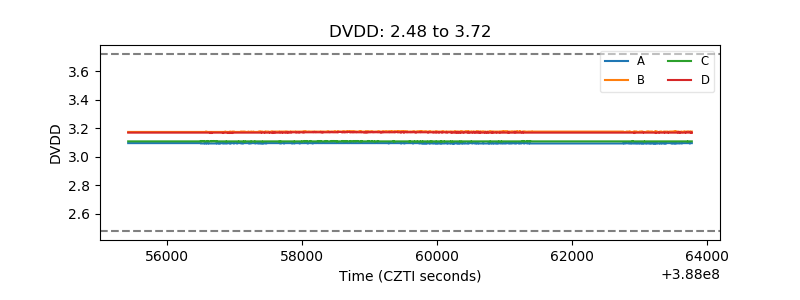 |
| Temperature 1 | 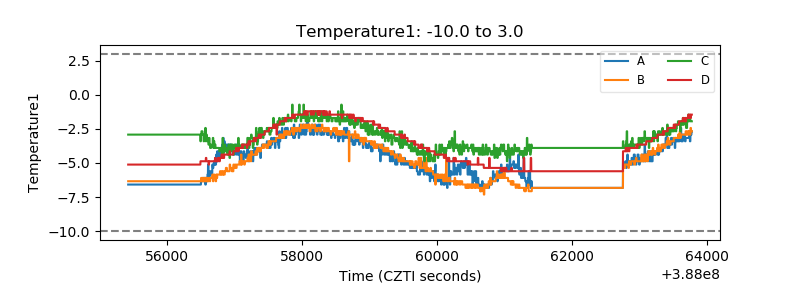 |
| Veto HV Monitor | 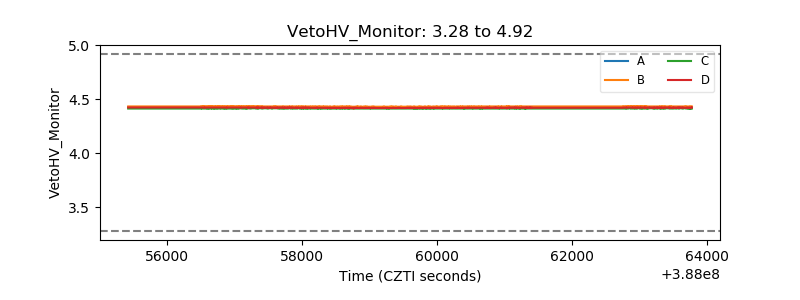 |
| Veto LLD | 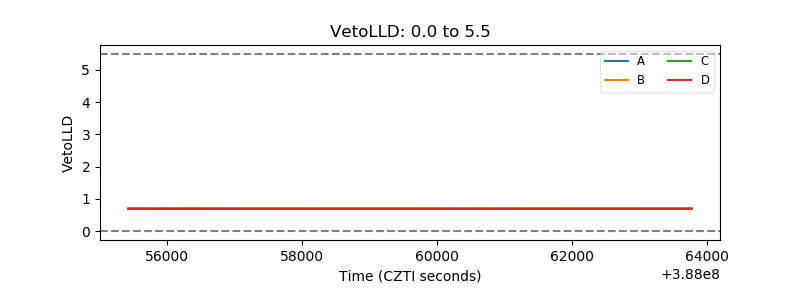 |
| Alpha Counter | 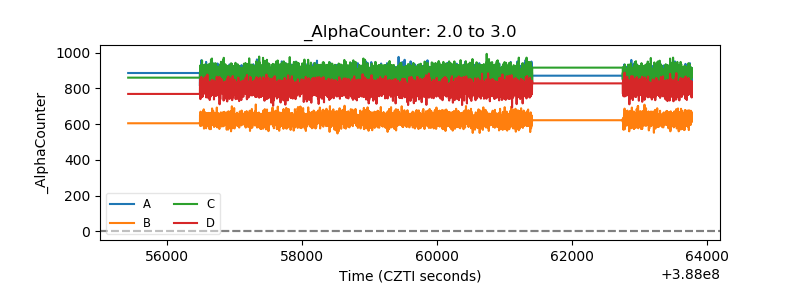 |
| _CPM_Rate | 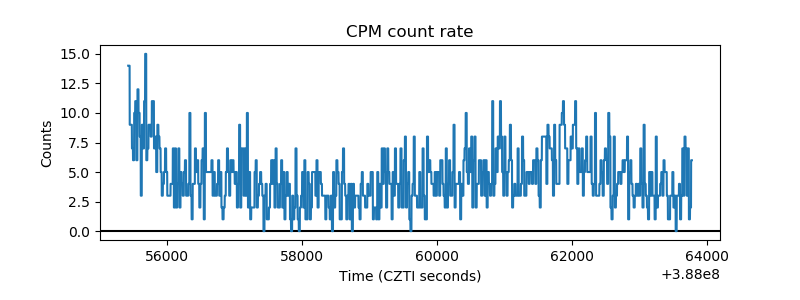 |
| CZT Counter | 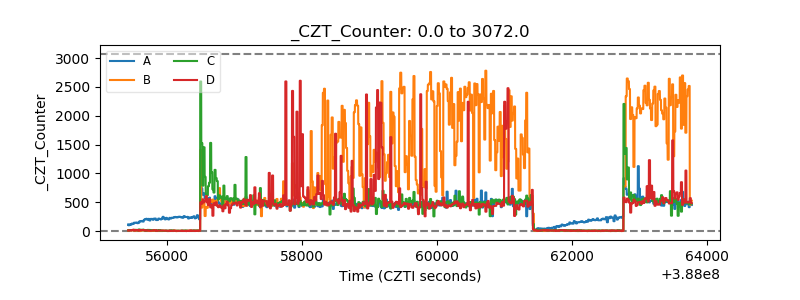 |
| +2.5 Volts monitor | 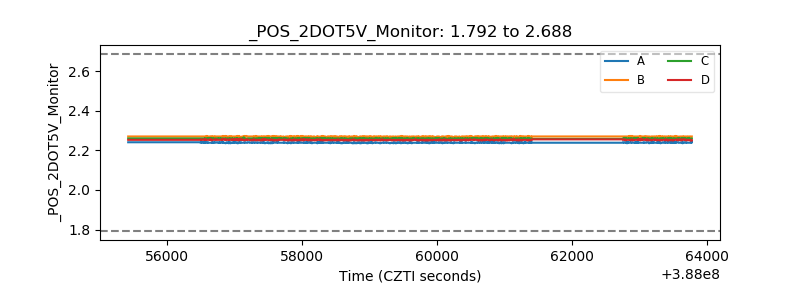 |
| +5 Volts monitor | 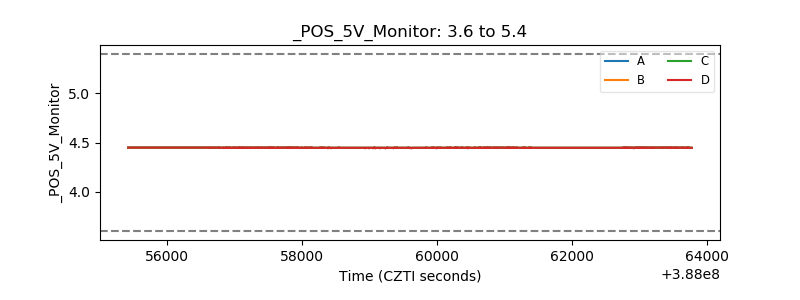 |
| _ROLL_ROT | 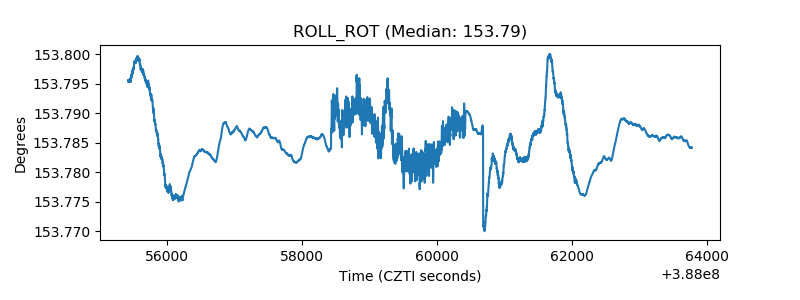 |
| _Roll_DEC | 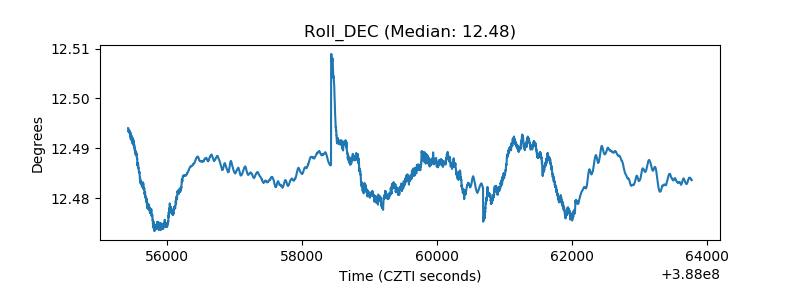 |
| _Roll_RA | 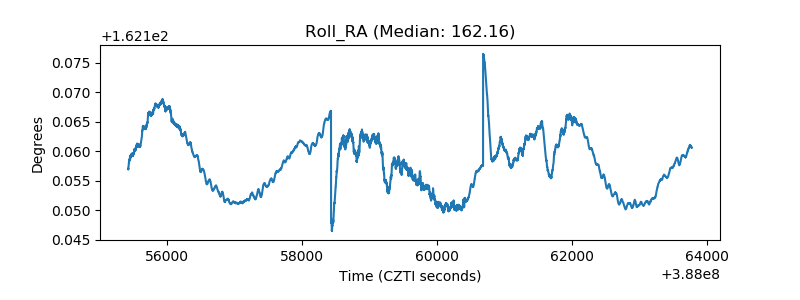 |
| Veto Counter | 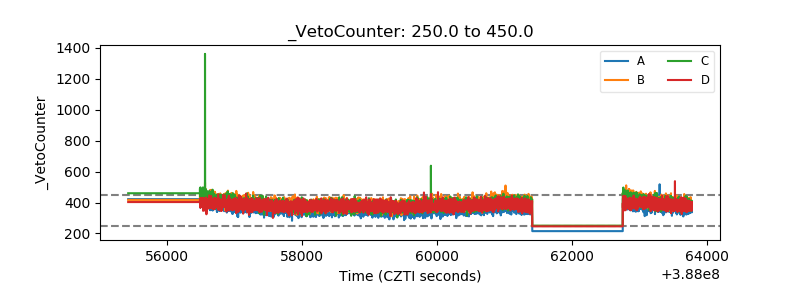 |