| Param | Original file | Final file |
|---|---|---|
| Filename | modeM0/AS1A11_068T03_9000005076_35452cztM0_level2.evt | modeM0/AS1A11_068T03_9000005076_35452cztM0_level2_quad_clean.evt |
| Size (bytes) | 481,354,560 | 48,392,640 |
| Size | 459.1 MB | 46.2 MB |
| Events in quadrant A | 2,623,130 | 287,159 |
| Events in quadrant B | 4,796,238 | 274,079 |
| Events in quadrant C | 3,420,701 | 279,747 |
| Events in quadrant D | 3,385,557 | 259,770 |
| Mode SS | |||
|---|---|---|---|
| Quadrant | BADHDUFLAG | Total packets | Discarded packets |
| A | 0 | 106 | 0 |
| B | 0 | 106 | 0 |
| C | 0 | 106 | 0 |
| D | 0 | 106 | 0 |
| Mode M0 | |||
|---|---|---|---|
| Quadrant | BADHDUFLAG | Total packets | Discarded packets |
| A | 0 | 10775 | 3 |
| B | 0 | 17697 | 2 |
| C | 0 | 13202 | 2 |
| D | 0 | 13502 | 2 |
| Mode M9 | |||
|---|---|---|---|
| Quadrant | BADHDUFLAG | Total packets | Discarded packets |
| A | 0 | 28 | 0 |
| B | 0 | 28 | 0 |
| C | 0 | 28 | 0 |
| D | 0 | 29 | 0 |
| Quadrant | Total seconds | Saturated seconds | Saturation percentage |
|---|---|---|---|
| A | 5195 | 4 | 0.076997% |
| B | 5195 | 492 | 9.470645% |
| C | 5195 | 192 | 3.695861% |
| D | 5195 | 155 | 2.983638% |
Noise dominated data is calculated using 1-second bins in cleaned event files. If a bin has >2000 counts, and if more than 50% of those come from <1% of pixels, then it is considered to be noise-dominated and hence unusable.
| Quadrant | # 1 sec bins | Bins with >0 counts | Bins with >2000 counts | High rate bins dominated by noise | Noise dominated (total time) | Noise dominated (detector-on time) | Marked lightcurve |
|---|---|---|---|---|---|---|---|
| A | 7287 | 5196 | 0 | 0 | 0.00% | 0.00% | 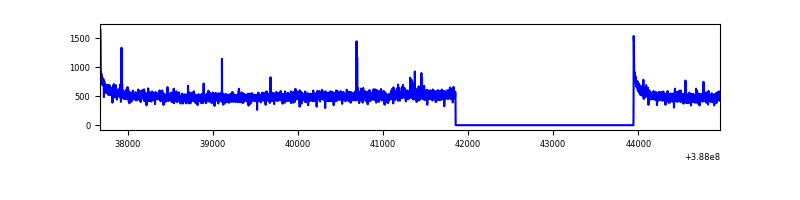 |
| B | 7287 | 5196 | 326 | 326 | 4.47% | 6.27% | 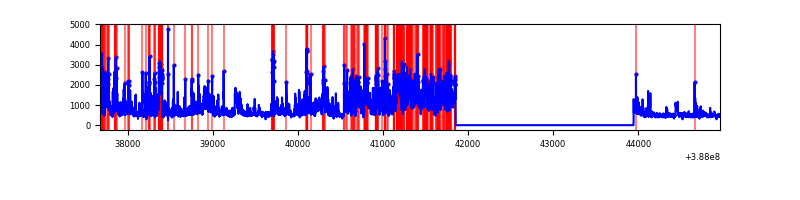 |
| C | 7287 | 5196 | 143 | 143 | 1.96% | 2.75% | 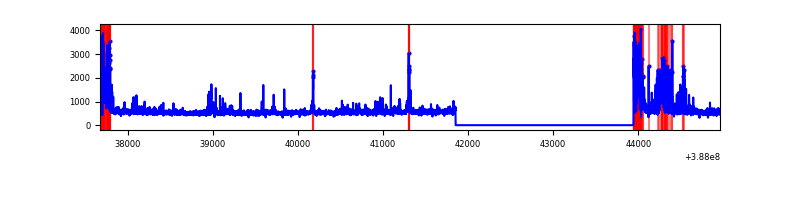 |
| D | 7287 | 5196 | 130 | 130 | 1.78% | 2.50% | 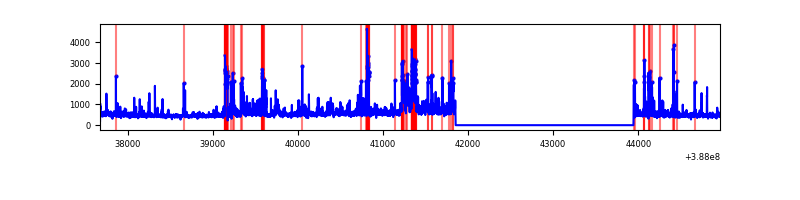 |
Top three noisy pixels from each quadrant. If the there are fewer than three noisy pixels in the level2.evt file, extra rows are filled as -1
| Pixel properties | Quadrant properties | ||||||
|---|---|---|---|---|---|---|---|
| Quadrant | DetID | PixID | Counts | Sigma | Mean | Median | Sigma |
| A | 10 | 83 | 127860 | 990.5 | 637 | 626 | 128.5 |
| A | 13 | 6 | 14996 | 111.87 | 637 | 626 | 128.5 |
| A | 9 | 143 | 10439 | 76.39 | 637 | 626 | 128.5 |
| B | 4 | 251 | 1379962 | 11740.07 | 615 | 601 | 117.5 |
| B | 5 | 236 | 616791 | 5244.54 | 615 | 601 | 117.5 |
| B | 5 | 172 | 223182 | 1894.44 | 615 | 601 | 117.5 |
| C | 0 | 10 | 644460 | 4600.99 | 604 | 608 | 139.9 |
| C | 15 | 214 | 214720 | 1530.05 | 604 | 608 | 139.9 |
| C | 0 | 207 | 95476 | 677.93 | 604 | 608 | 139.9 |
| D | 13 | 249 | 428680 | 2873.36 | 603 | 586 | 149.0 |
| D | 1 | 52 | 215032 | 1439.36 | 603 | 586 | 149.0 |
| D | 7 | 223 | 173509 | 1160.66 | 603 | 586 | 149.0 |
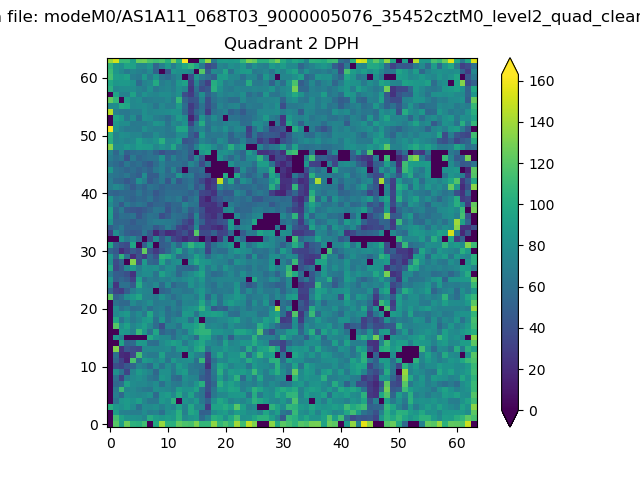
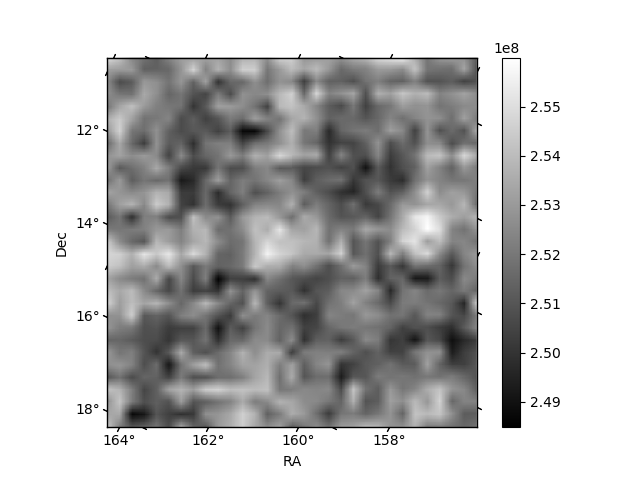
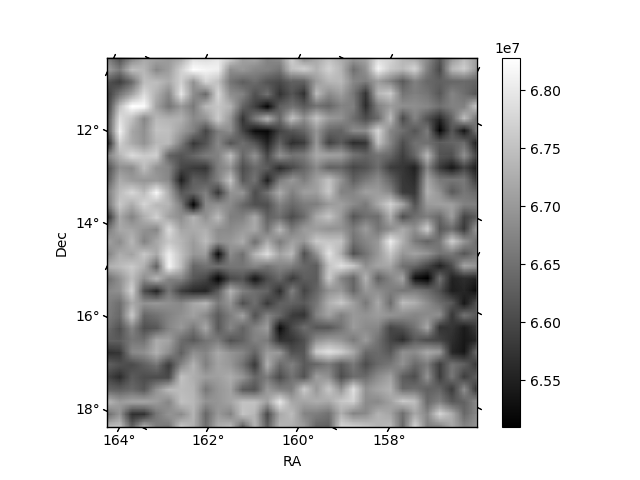
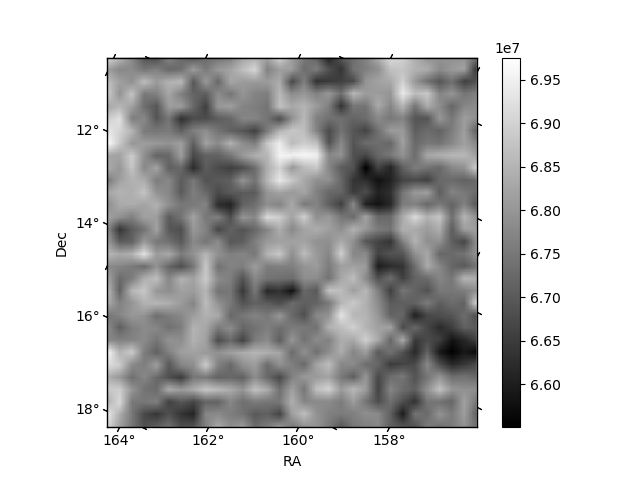
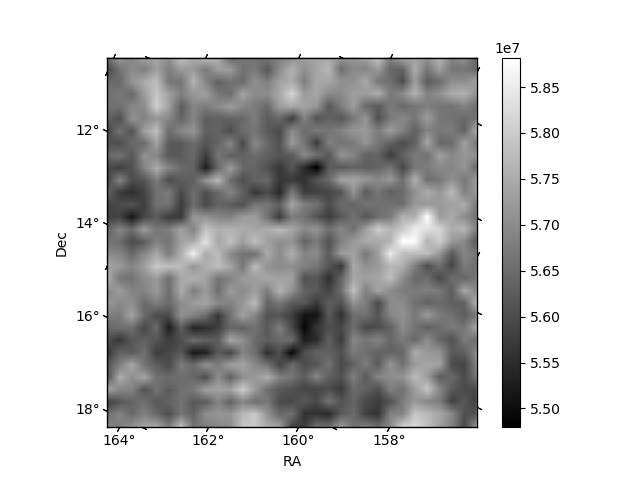
Histogram calculated using DETX and DETY for each event in the final _common_clean file
| Quadrant A | 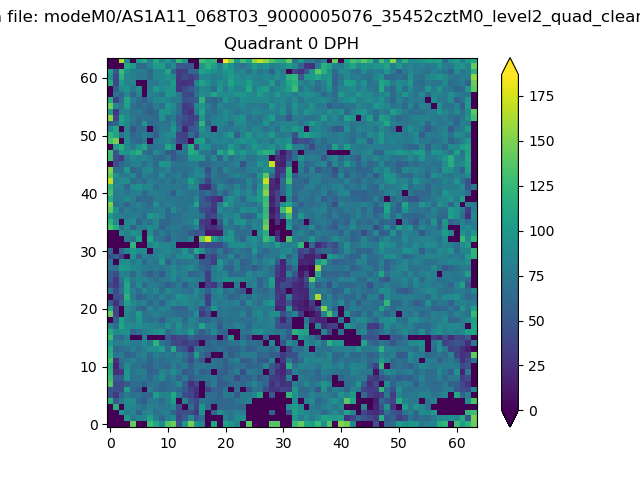 |
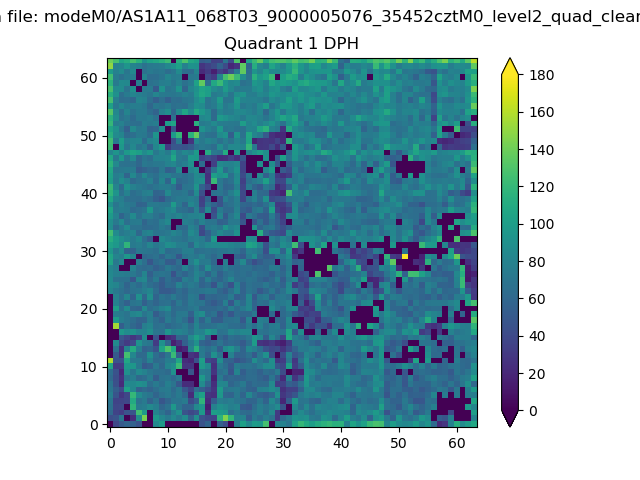 |
Quadrant B |
|---|---|---|---|
| Quadrant D | 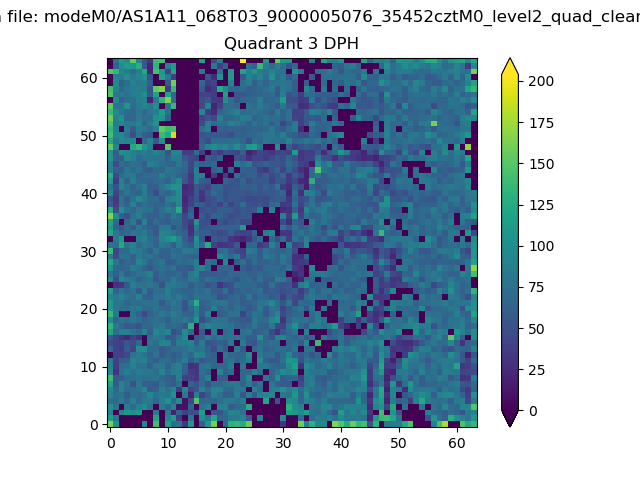 |
 |
Quadrant C |
| Plot type | Count rate plots | Images |
|---|---|---|
| Comparison with Poisson distribution Blue bars denote a histogram of data divided into 1 sec bins. Red curve is a Poisson curve with rate = median count rate of data. |
 |
 |
| Quadrant-wise count rates Data is divided into 100 sec bins |
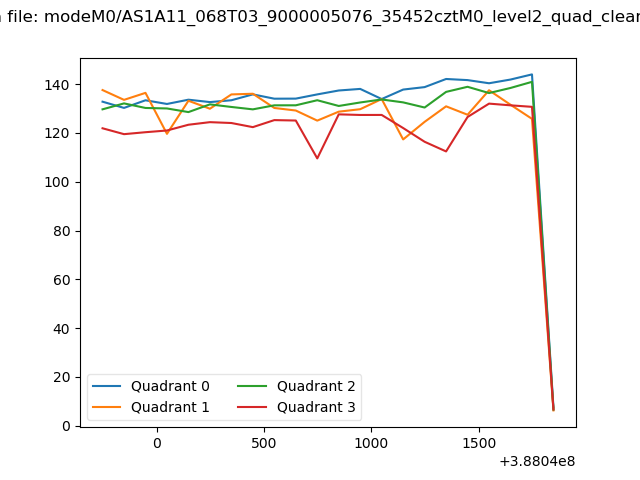 |
|
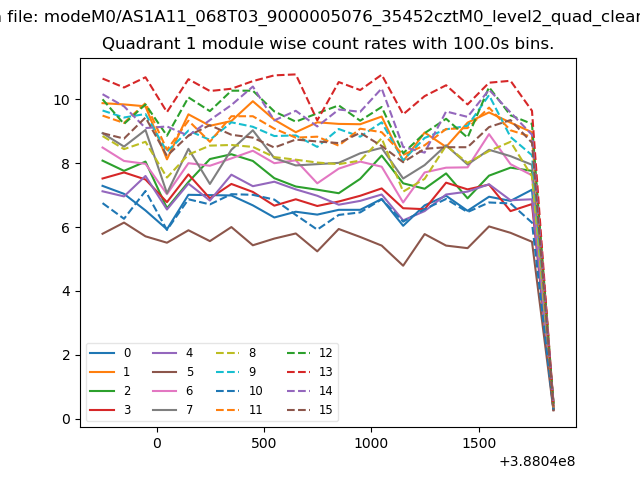
| Module-wise count rates for Quadrant A Data is divided into 100 sec bins |
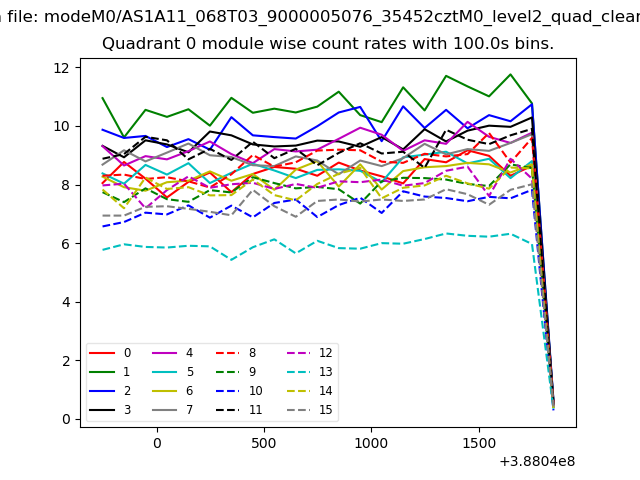 |
 |
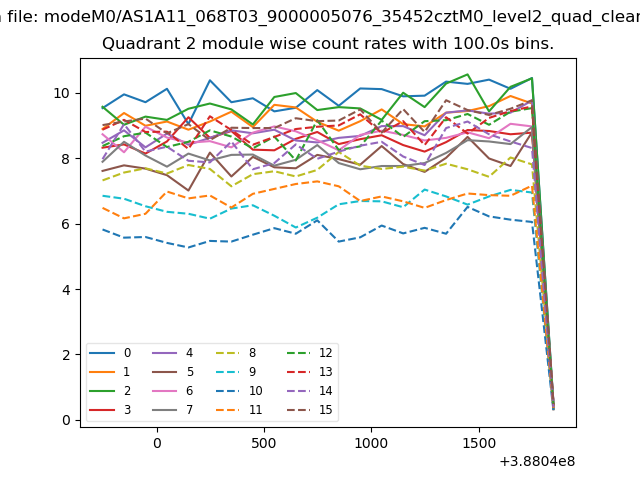
| Module-wise count rates for Quadrant B Data is divided into 100 sec bins |
 |
 |
| Module-wise count rates for Quadrant C Data is divided into 100 sec bins |
 |
 |
| Module-wise count rates for Quadrant D Data is divided into 100 sec bins |
 |
 |
| Parameter | Plot |
|---|---|
| CZT HV Monitor | 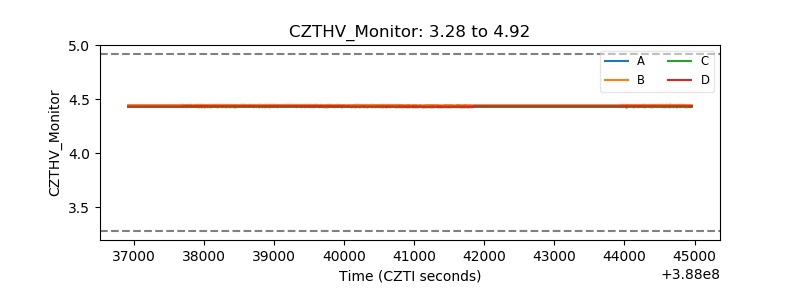 |
| D_VDD | 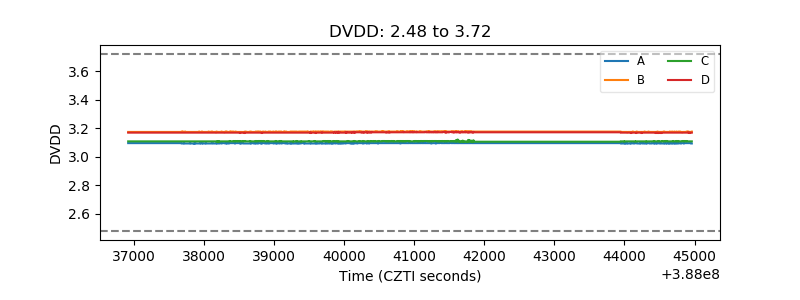 |
| Temperature 1 | 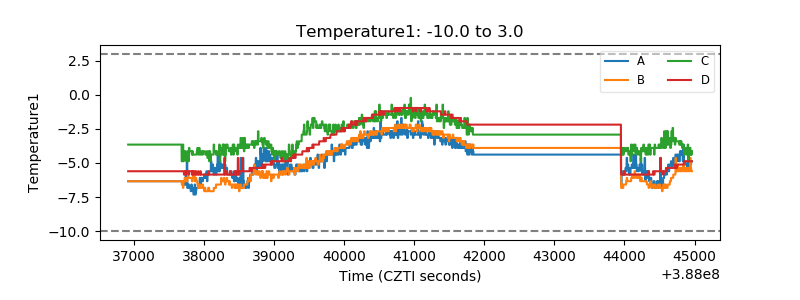 |
| Veto HV Monitor | 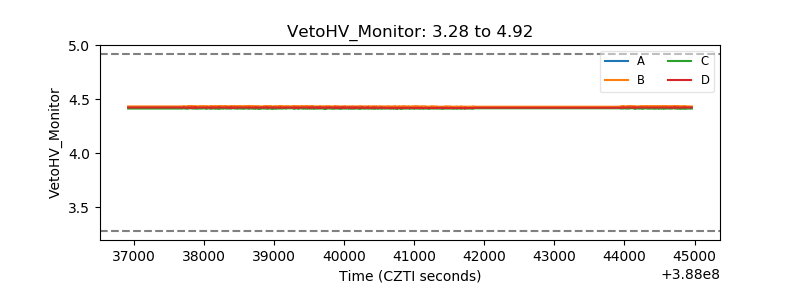 |
| Veto LLD | 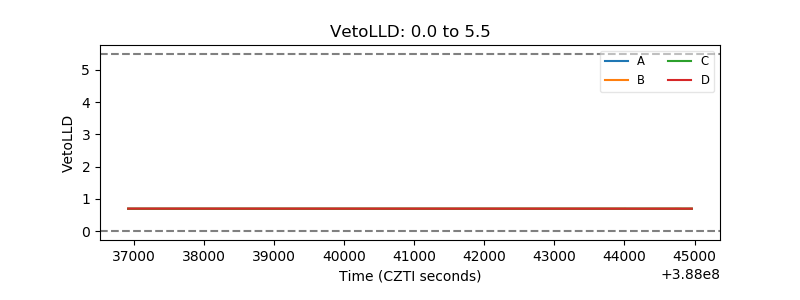 |
| Alpha Counter | 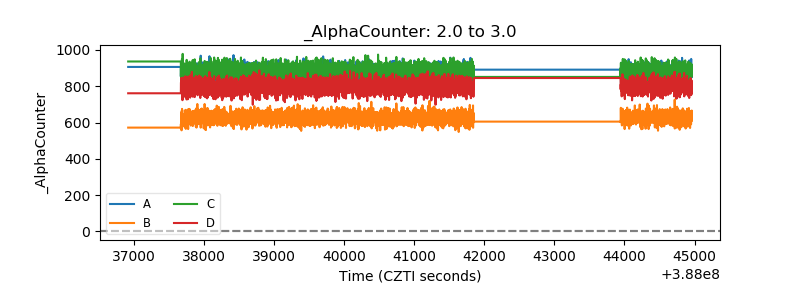 |
| _CPM_Rate | 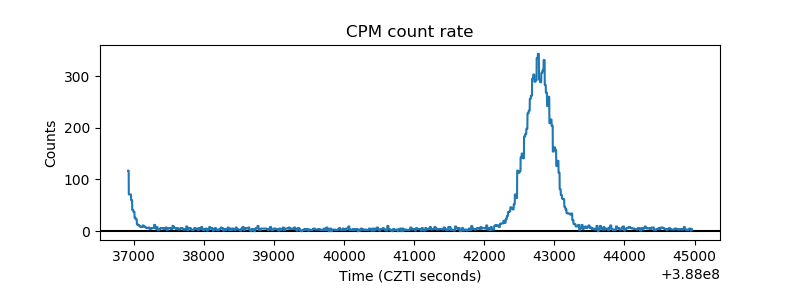 |
| CZT Counter | 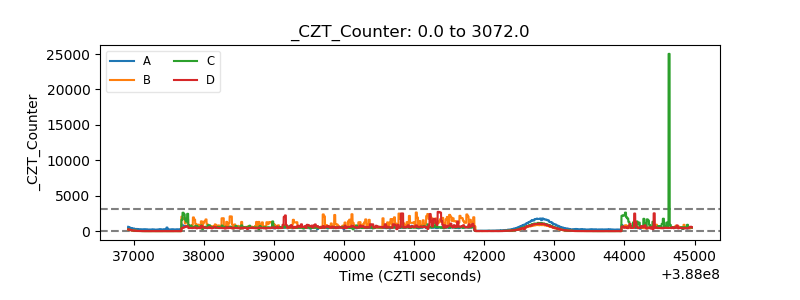 |
| +2.5 Volts monitor | 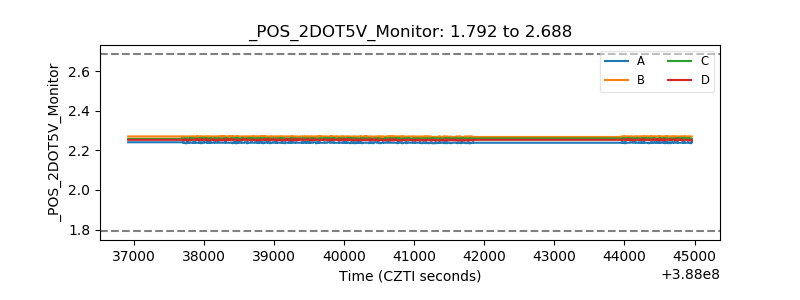 |
| +5 Volts monitor | 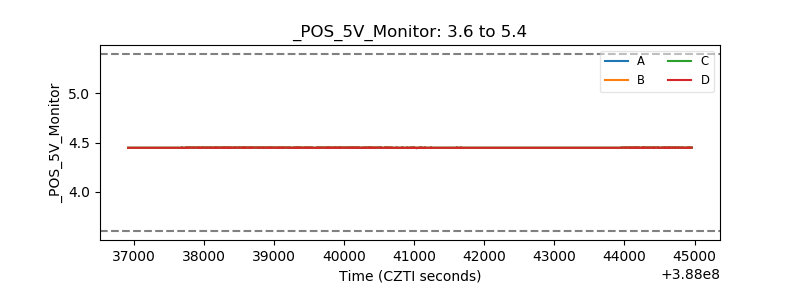 |
| _ROLL_ROT | 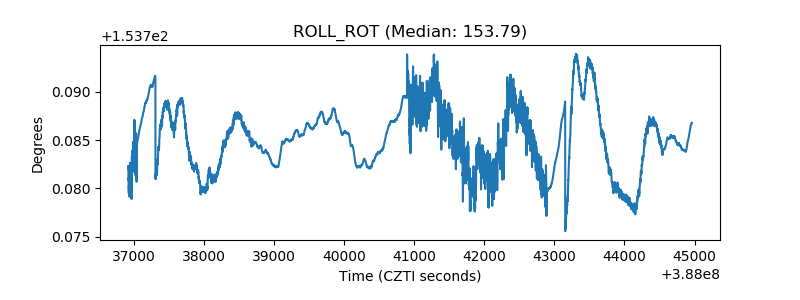 |
| _Roll_DEC | 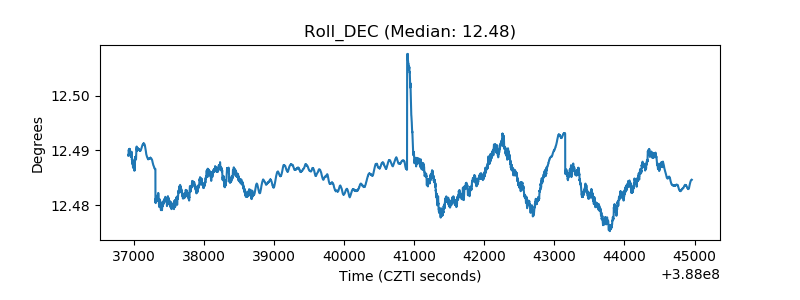 |
| _Roll_RA | 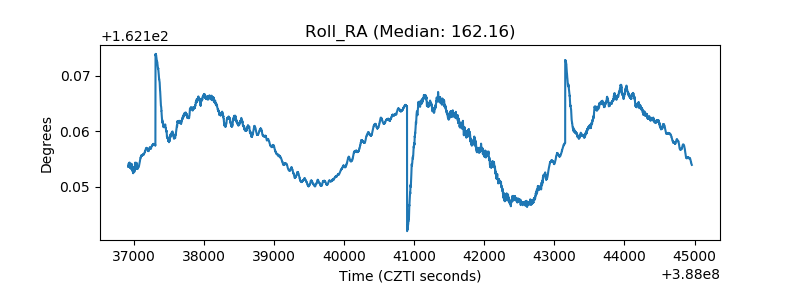 |
| Veto Counter | 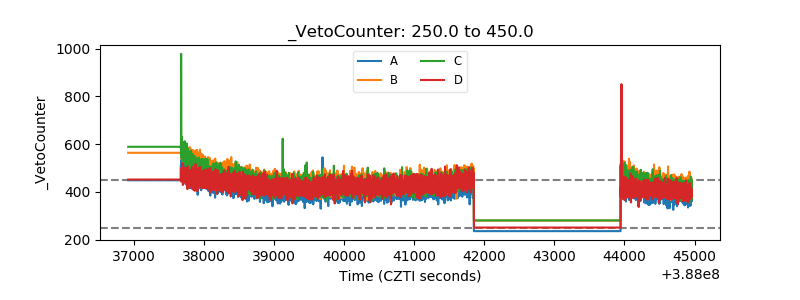 |