| Param | Original file | Final file |
|---|---|---|
| Filename | modeM0/AS1A11_068T03_9000005076_35451cztM0_level2.evt | modeM0/AS1A11_068T03_9000005076_35451cztM0_level2_quad_clean.evt |
| Size (bytes) | 473,400,000 | 45,020,160 |
| Size | 451.5 MB | 42.9 MB |
| Events in quadrant A | 2,569,016 | 267,023 |
| Events in quadrant B | 5,539,335 | 248,636 |
| Events in quadrant C | 3,100,878 | 253,848 |
| Events in quadrant D | 2,791,841 | 245,800 |
| Mode SS | |||
|---|---|---|---|
| Quadrant | BADHDUFLAG | Total packets | Discarded packets |
| A | 0 | 102 | 0 |
| B | 0 | 102 | 0 |
| C | 0 | 102 | 0 |
| D | 0 | 102 | 0 |
| Mode M0 | |||
|---|---|---|---|
| Quadrant | BADHDUFLAG | Total packets | Discarded packets |
| A | 0 | 10375 | 3 |
| B | 0 | 19961 | 2 |
| C | 0 | 11964 | 2 |
| D | 0 | 11442 | 2 |
| Mode M9 | |||
|---|---|---|---|
| Quadrant | BADHDUFLAG | Total packets | Discarded packets |
| A | 0 | 28 | 0 |
| B | 0 | 28 | 0 |
| C | 0 | 28 | 0 |
| D | 0 | 29 | 0 |
| Quadrant | Total seconds | Saturated seconds | Saturation percentage |
|---|---|---|---|
| A | 4947 | 7 | 0.141500% |
| B | 4947 | 865 | 17.485345% |
| C | 4947 | 161 | 3.254498% |
| D | 4947 | 81 | 1.637356% |
Noise dominated data is calculated using 1-second bins in cleaned event files. If a bin has >2000 counts, and if more than 50% of those come from <1% of pixels, then it is considered to be noise-dominated and hence unusable.
| Quadrant | # 1 sec bins | Bins with >0 counts | Bins with >2000 counts | High rate bins dominated by noise | Noise dominated (total time) | Noise dominated (detector-on time) | Marked lightcurve |
|---|---|---|---|---|---|---|---|
| A | 7098 | 4948 | 0 | 0 | 0.00% | 0.00% | 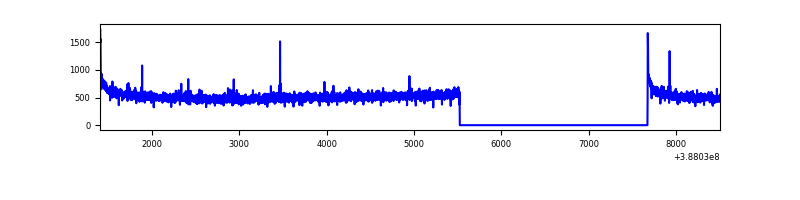 |
| B | 7098 | 4948 | 557 | 557 | 7.85% | 11.26% | 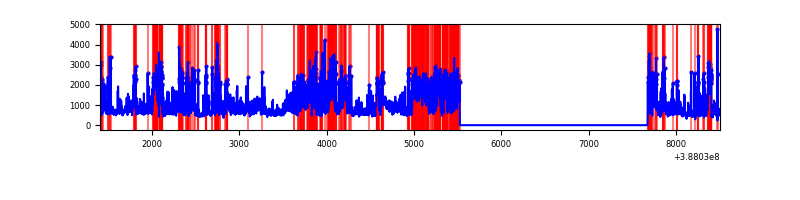 |
| C | 7098 | 4948 | 118 | 118 | 1.66% | 2.38% | 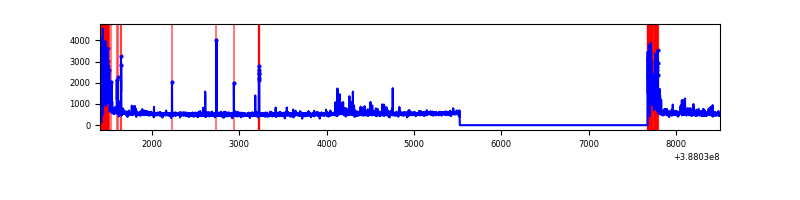 |
| D | 7098 | 4948 | 60 | 60 | 0.85% | 1.21% | 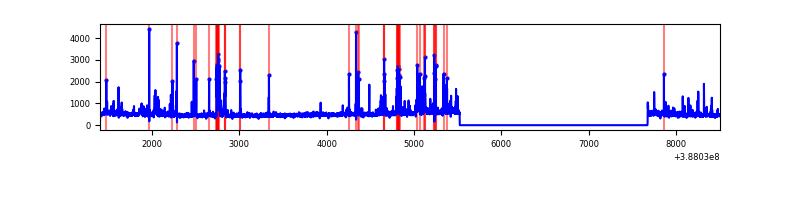 |
Top three noisy pixels from each quadrant. If the there are fewer than three noisy pixels in the level2.evt file, extra rows are filled as -1
| Pixel properties | Quadrant properties | ||||||
|---|---|---|---|---|---|---|---|
| Quadrant | DetID | PixID | Counts | Sigma | Mean | Median | Sigma |
| A | 10 | 83 | 123419 | 983.1 | 624 | 614 | 124.9 |
| A | 13 | 6 | 16276 | 125.38 | 624 | 614 | 124.9 |
| A | 9 | 143 | 8831 | 65.78 | 624 | 614 | 124.9 |
| B | 5 | 236 | 1689161 | 15101.25 | 590 | 576 | 111.8 |
| B | 4 | 251 | 961942 | 8597.63 | 590 | 576 | 111.8 |
| B | 5 | 200 | 296322 | 2644.9 | 590 | 576 | 111.8 |
| C | 0 | 10 | 472192 | 3420.6 | 593 | 599 | 137.9 |
| C | 15 | 214 | 204895 | 1481.82 | 593 | 599 | 137.9 |
| C | 15 | 159 | 30112 | 214.07 | 593 | 599 | 137.9 |
| D | 13 | 249 | 180183 | 1239.12 | 591 | 575 | 144.9 |
| D | 12 | 233 | 89756 | 615.26 | 591 | 575 | 144.9 |
| D | 2 | 153 | 62910 | 430.05 | 591 | 575 | 144.9 |
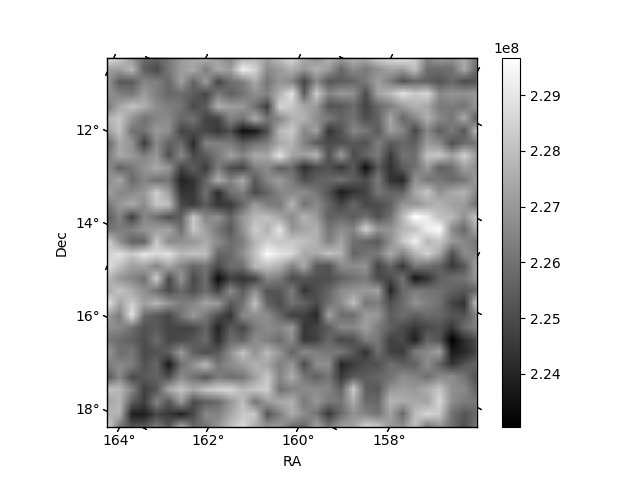
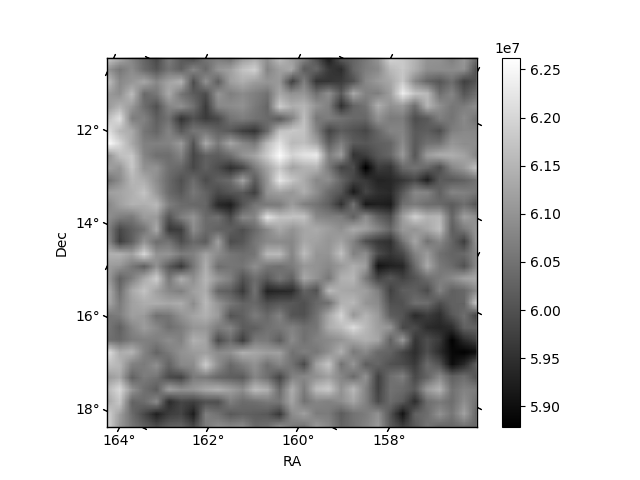
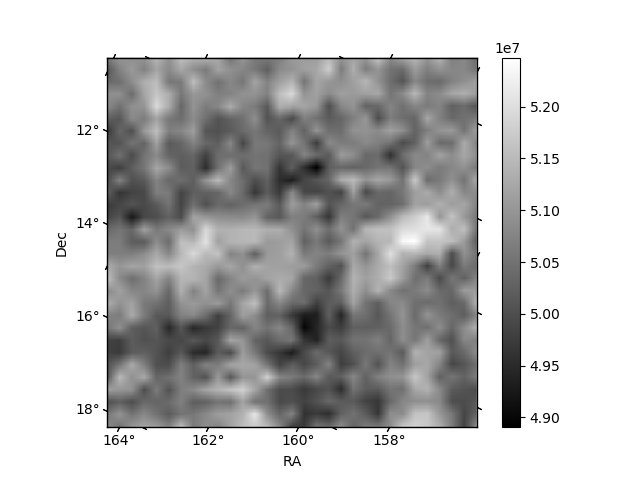
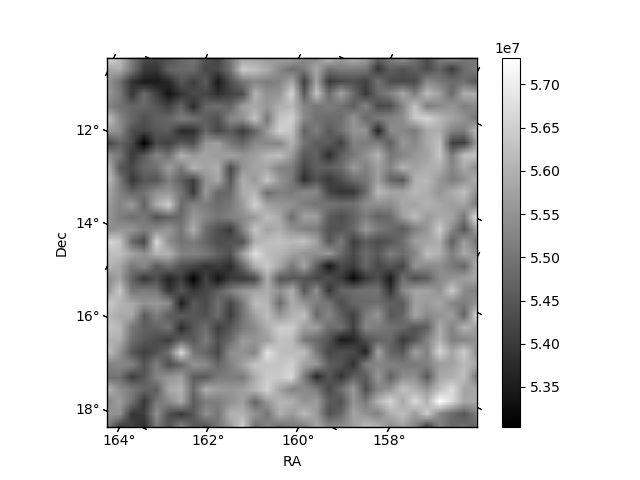
Histogram calculated using DETX and DETY for each event in the final _common_clean file
| Quadrant A | 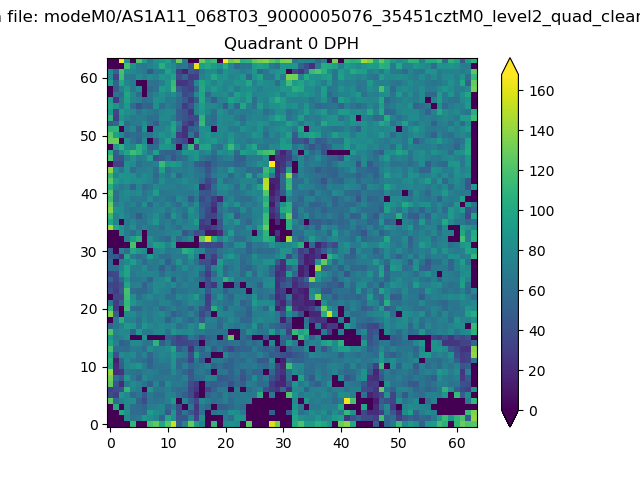 |
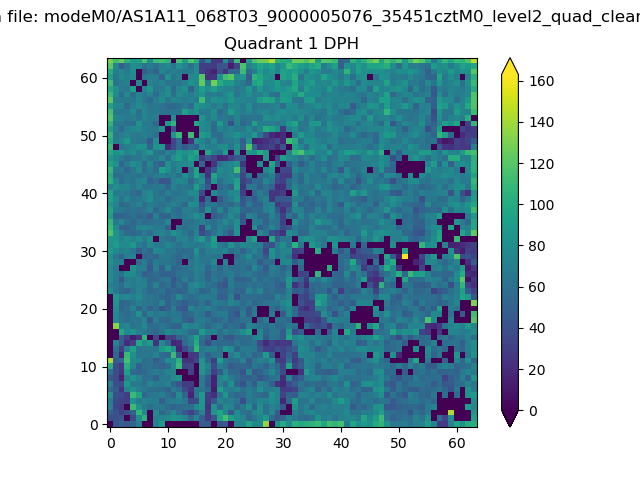 |
Quadrant B |
|---|---|---|---|
| Quadrant D | 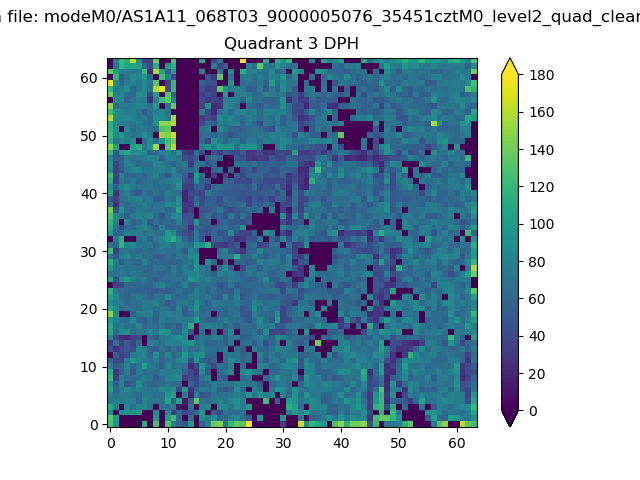 |
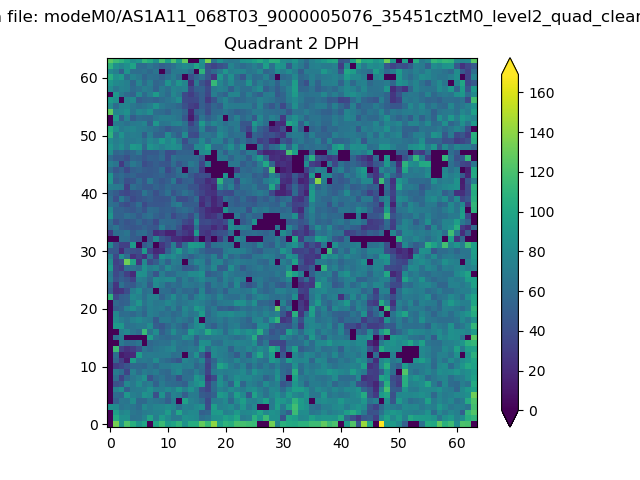 |
Quadrant C |
| Plot type | Count rate plots | Images |
|---|---|---|
| Comparison with Poisson distribution Blue bars denote a histogram of data divided into 1 sec bins. Red curve is a Poisson curve with rate = median count rate of data. |
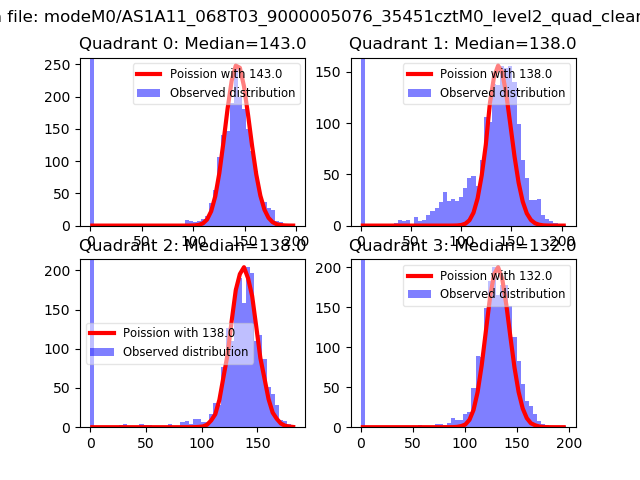 |
 |
| Quadrant-wise count rates Data is divided into 100 sec bins |
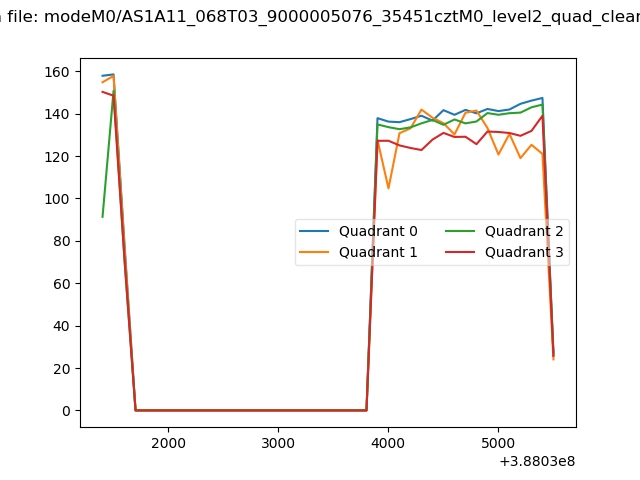 |
|
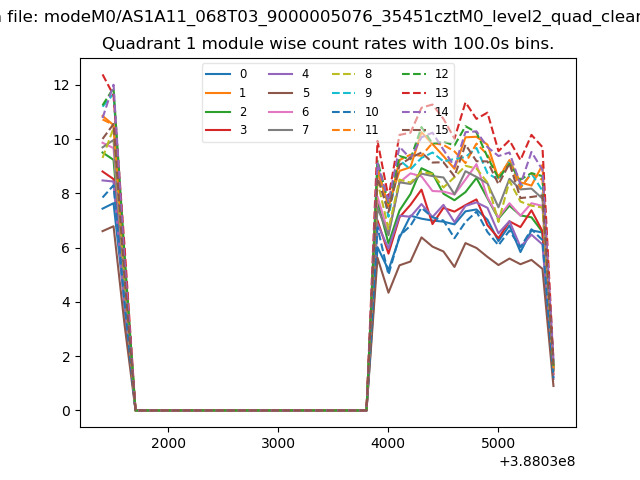
| Module-wise count rates for Quadrant A Data is divided into 100 sec bins |
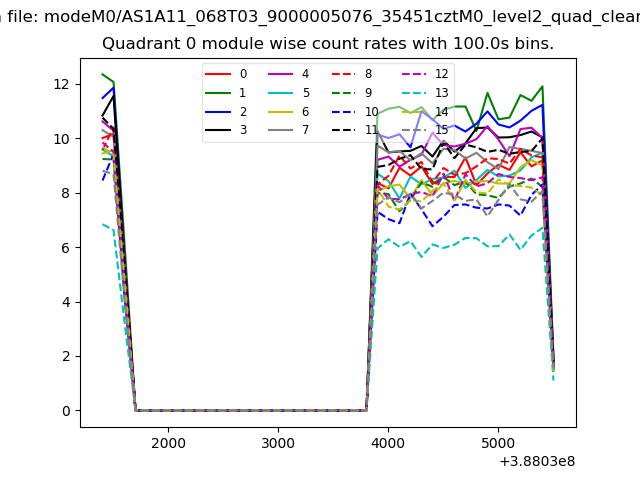 |
 |
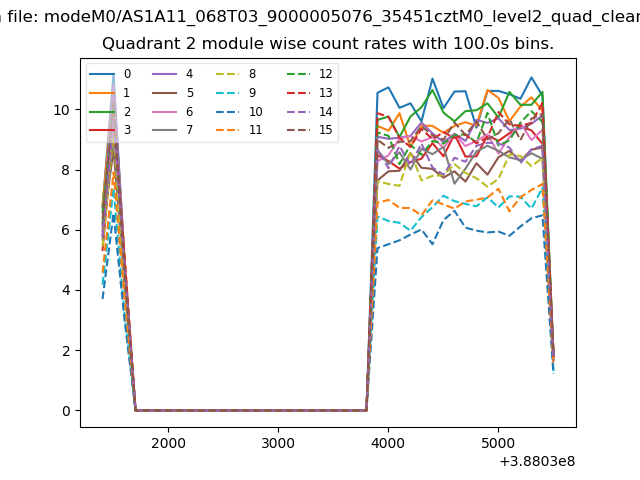
| Module-wise count rates for Quadrant B Data is divided into 100 sec bins |
 |
 |
| Module-wise count rates for Quadrant C Data is divided into 100 sec bins |
 |
 |
| Module-wise count rates for Quadrant D Data is divided into 100 sec bins |
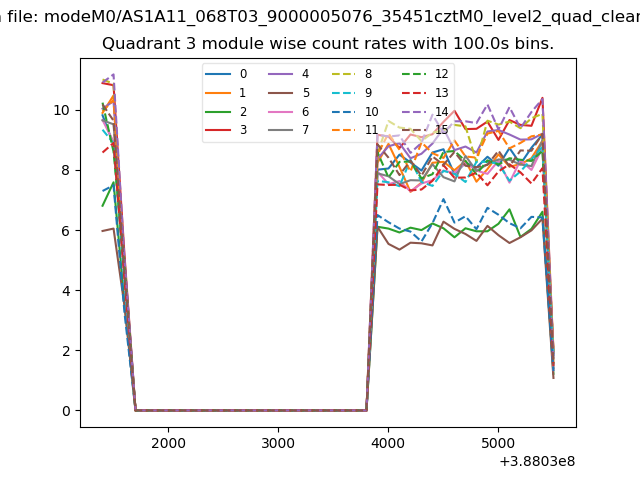 |
 |
| Parameter | Plot |
|---|---|
| CZT HV Monitor | 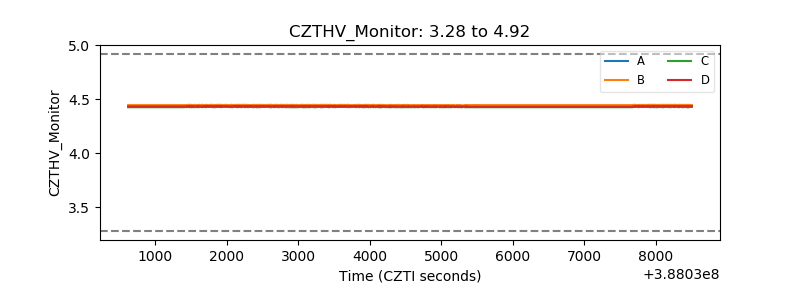 |
| D_VDD | 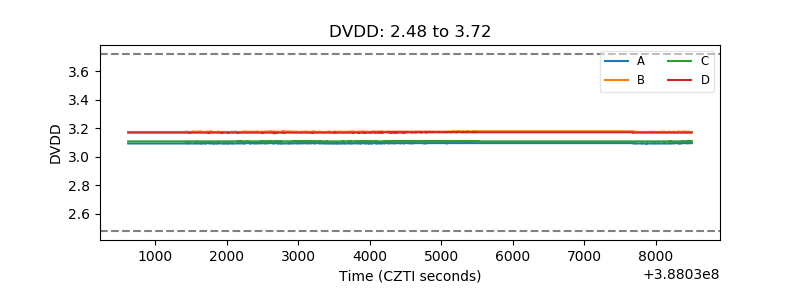 |
| Temperature 1 | 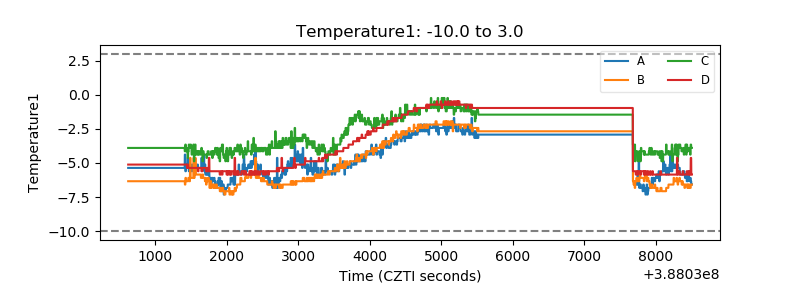 |
| Veto HV Monitor | 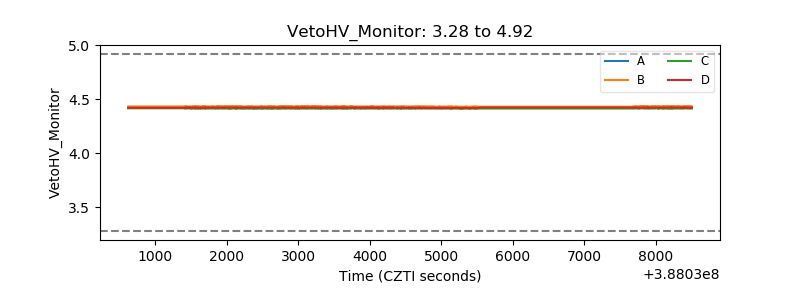 |
| Veto LLD | 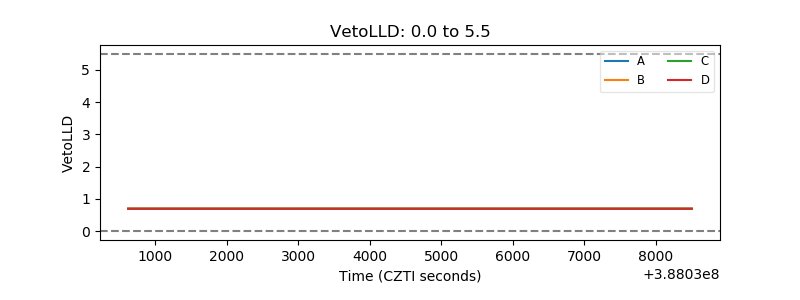 |
| Alpha Counter | 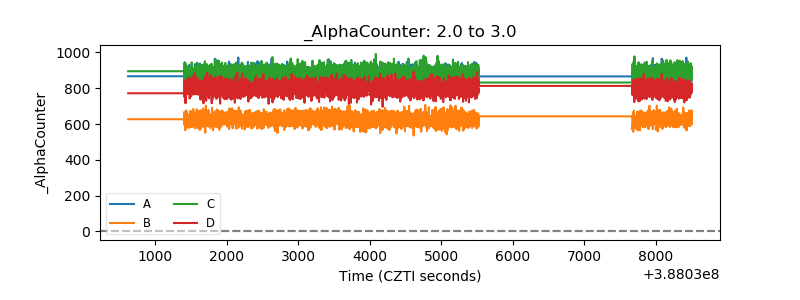 |
| _CPM_Rate | 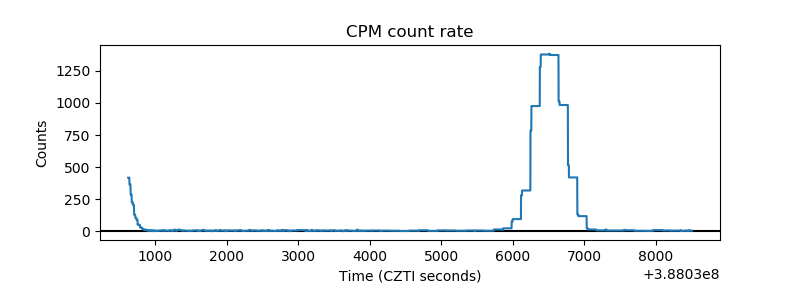 |
| CZT Counter | 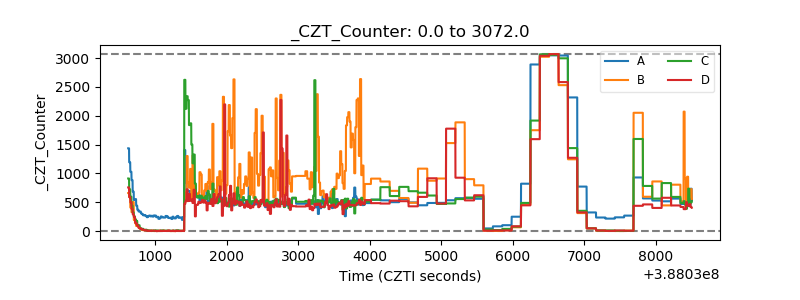 |
| +2.5 Volts monitor | 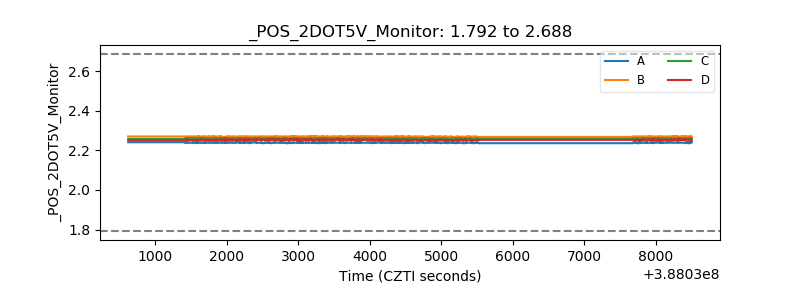 |
| +5 Volts monitor | 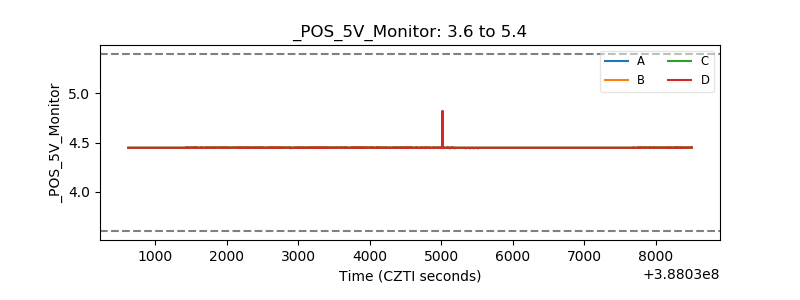 |
| _ROLL_ROT | 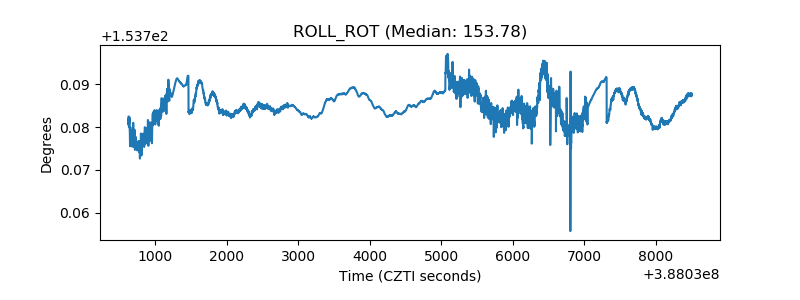 |
| _Roll_DEC | 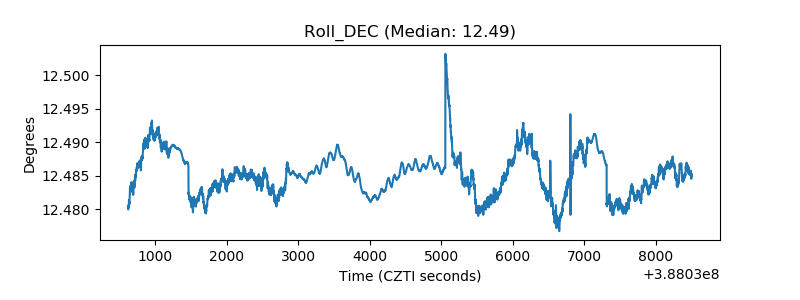 |
| _Roll_RA | 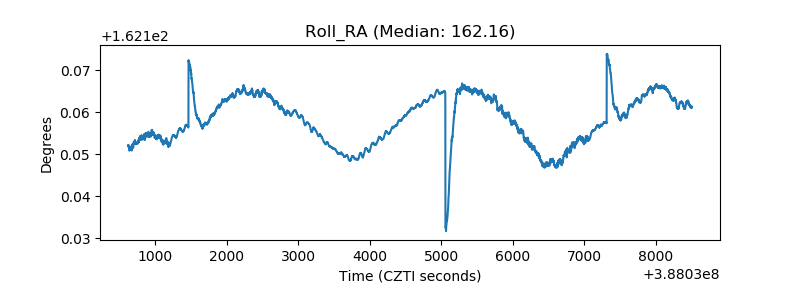 |
| Veto Counter | 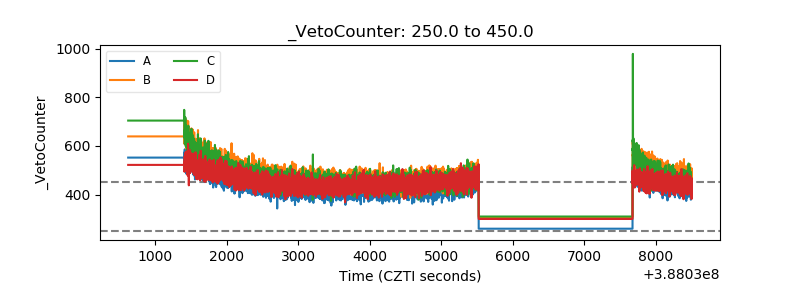 |