| Param | Original file | Final file |
|---|---|---|
| Filename | modeM0/AS1A11_068T03_9000005076_35449cztM0_level2.evt | modeM0/AS1A11_068T03_9000005076_35449cztM0_level2_quad_clean.evt |
| Size (bytes) | 462,916,800 | 63,216,000 |
| Size | 441.5 MB | 60.3 MB |
| Events in quadrant A | 2,680,558 | 399,887 |
| Events in quadrant B | 4,542,337 | 400,854 |
| Events in quadrant C | 3,232,568 | 388,050 |
| Events in quadrant D | 3,217,897 | 367,276 |
| Mode SS | |||
|---|---|---|---|
| Quadrant | BADHDUFLAG | Total packets | Discarded packets |
| A | 0 | 104 | 0 |
| B | 0 | 104 | 0 |
| C | 0 | 104 | 0 |
| D | 0 | 104 | 0 |
| Mode M0 | |||
|---|---|---|---|
| Quadrant | BADHDUFLAG | Total packets | Discarded packets |
| A | 0 | 10932 | 3 |
| B | 0 | 17084 | 2 |
| C | 0 | 12476 | 2 |
| D | 0 | 12794 | 2 |
| Mode M9 | |||
|---|---|---|---|
| Quadrant | BADHDUFLAG | Total packets | Discarded packets |
| A | 0 | 36 | 0 |
| B | 0 | 36 | 0 |
| C | 0 | 36 | 0 |
| D | 0 | 37 | 0 |
| Quadrant | Total seconds | Saturated seconds | Saturation percentage |
|---|---|---|---|
| A | 5104 | 21 | 0.411442% |
| B | 5104 | 287 | 5.623041% |
| C | 5104 | 195 | 3.820533% |
| D | 5104 | 144 | 2.821317% |
Noise dominated data is calculated using 1-second bins in cleaned event files. If a bin has >2000 counts, and if more than 50% of those come from <1% of pixels, then it is considered to be noise-dominated and hence unusable.
| Quadrant | # 1 sec bins | Bins with >0 counts | Bins with >2000 counts | High rate bins dominated by noise | Noise dominated (total time) | Noise dominated (detector-on time) | Marked lightcurve |
|---|---|---|---|---|---|---|---|
| A | 7106 | 5105 | 10 | 10 | 0.14% | 0.20% | 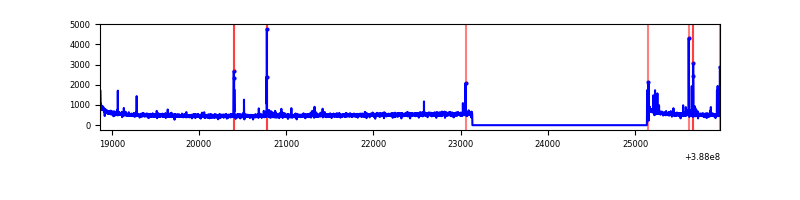 |
| B | 7106 | 5105 | 151 | 151 | 2.12% | 2.96% | 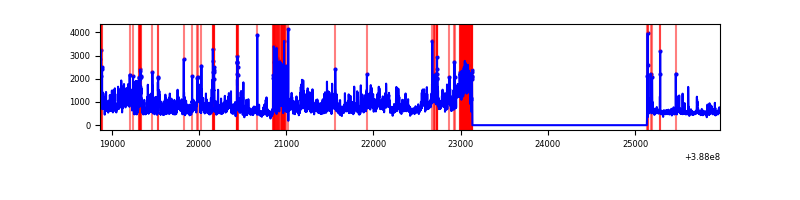 |
| C | 7106 | 5105 | 154 | 154 | 2.17% | 3.02% | 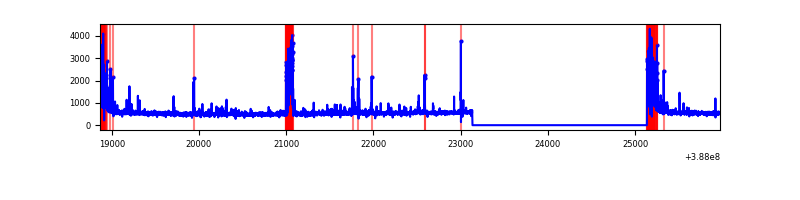 |
| D | 7106 | 5105 | 105 | 105 | 1.48% | 2.06% | 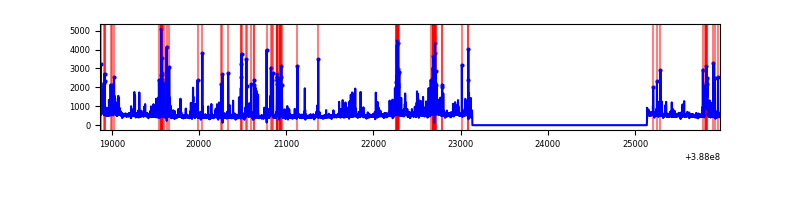 |
Top three noisy pixels from each quadrant. If the there are fewer than three noisy pixels in the level2.evt file, extra rows are filled as -1
| Pixel properties | Quadrant properties | ||||||
|---|---|---|---|---|---|---|---|
| Quadrant | DetID | PixID | Counts | Sigma | Mean | Median | Sigma |
| A | 10 | 83 | 121210 | 943.98 | 637 | 625 | 127.7 |
| A | 9 | 143 | 73439 | 570.01 | 637 | 625 | 127.7 |
| A | 13 | 6 | 20680 | 157.0 | 637 | 625 | 127.7 |
| B | 4 | 251 | 1543768 | 12816.7 | 631 | 616 | 120.4 |
| B | 5 | 236 | 251235 | 2081.52 | 631 | 616 | 120.4 |
| B | 5 | 172 | 78965 | 650.73 | 631 | 616 | 120.4 |
| C | 0 | 10 | 357398 | 2544.51 | 609 | 614 | 140.2 |
| C | 15 | 214 | 207514 | 1475.57 | 609 | 614 | 140.2 |
| C | 9 | 69 | 159973 | 1136.52 | 609 | 614 | 140.2 |
| D | 13 | 249 | 519245 | 3514.77 | 605 | 590 | 147.6 |
| D | 8 | 195 | 65949 | 442.92 | 605 | 590 | 147.6 |
| D | 7 | 80 | 47124 | 315.35 | 605 | 590 | 147.6 |
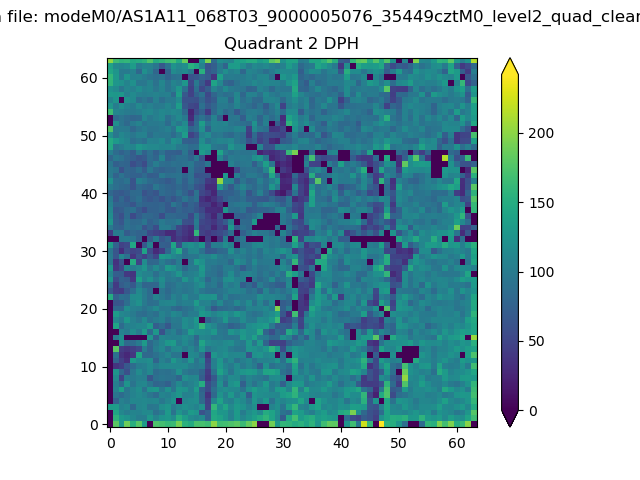
Histogram calculated using DETX and DETY for each event in the final _common_clean file
| Quadrant A | 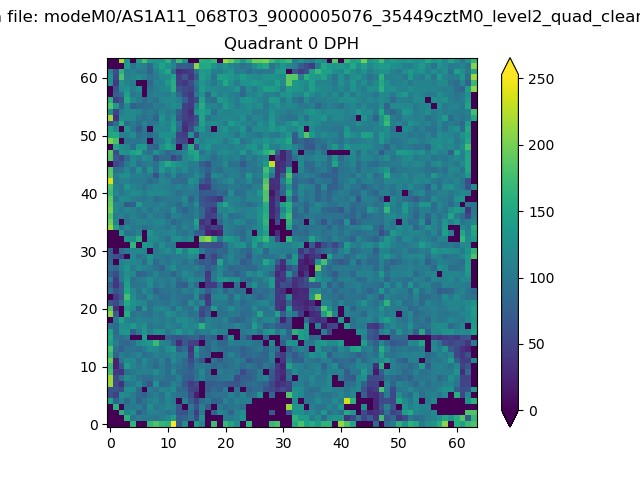 |
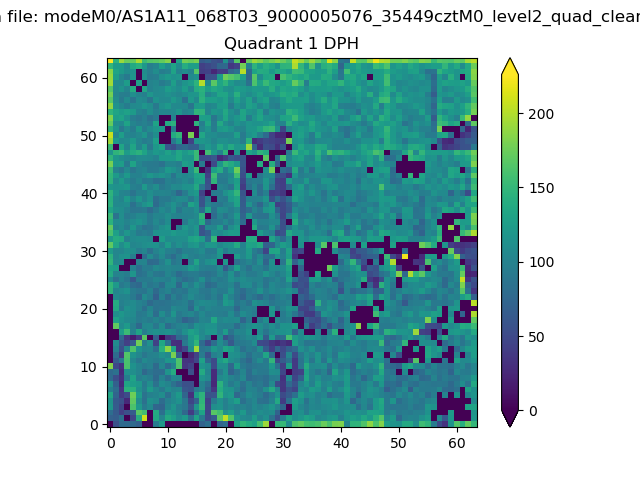 |
Quadrant B |
|---|---|---|---|
| Quadrant D | 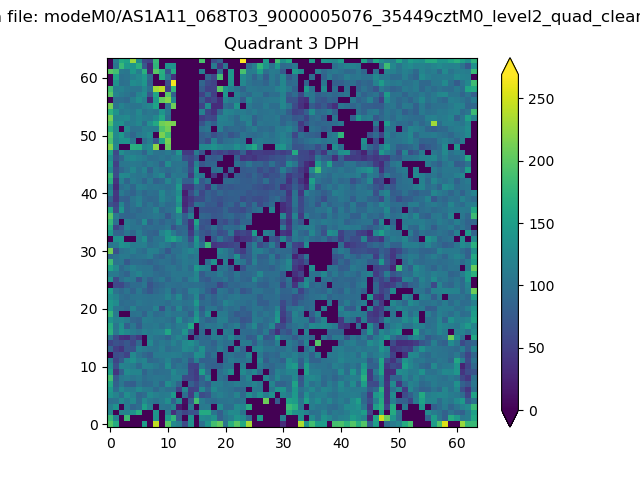 |
 |
Quadrant C |
| Plot type | Count rate plots | Images |
|---|---|---|
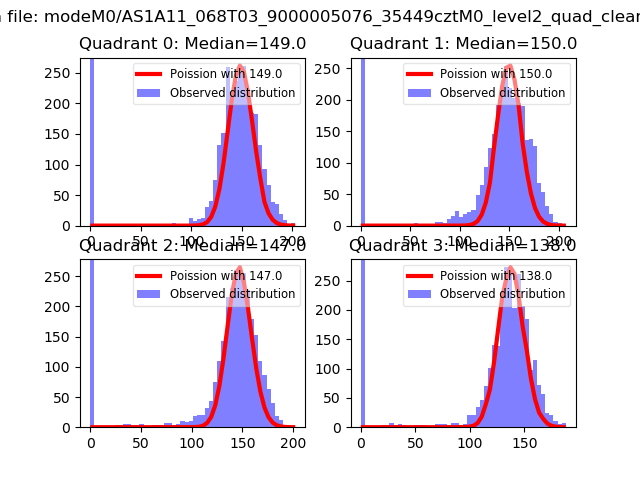
| Comparison with Poisson distribution Blue bars denote a histogram of data divided into 1 sec bins. Red curve is a Poisson curve with rate = median count rate of data. |
 |
 |
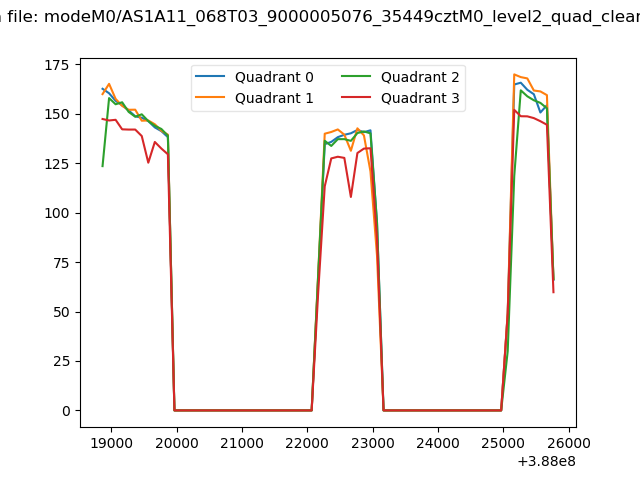
| Quadrant-wise count rates Data is divided into 100 sec bins |
 |
|
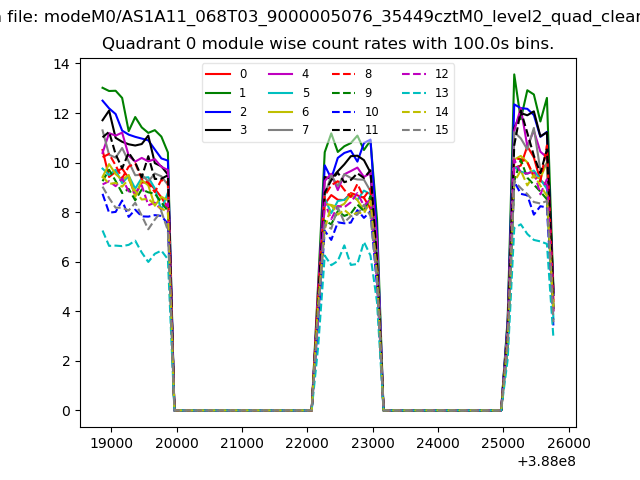
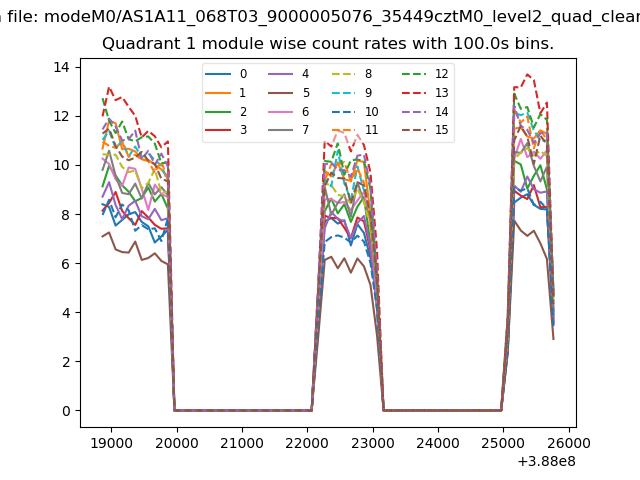
| Module-wise count rates for Quadrant A Data is divided into 100 sec bins |
 |
 |
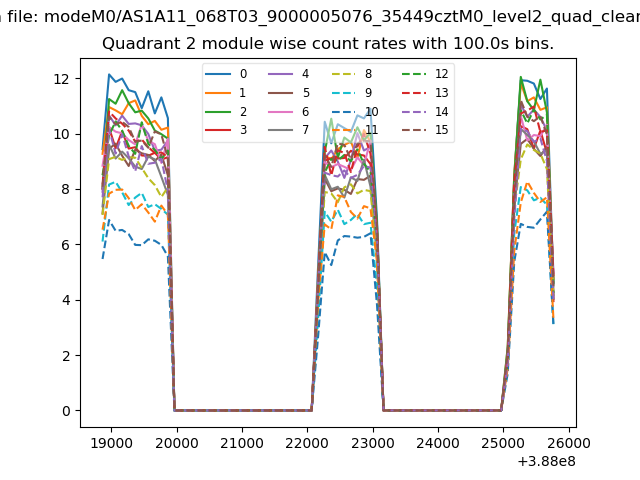
| Module-wise count rates for Quadrant B Data is divided into 100 sec bins |
 |
 |
| Module-wise count rates for Quadrant C Data is divided into 100 sec bins |
 |
 |
| Module-wise count rates for Quadrant D Data is divided into 100 sec bins |
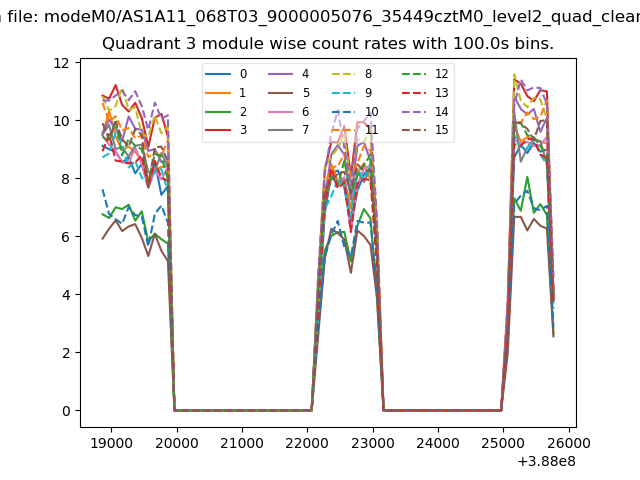 |
 |
| Parameter | Plot |
|---|---|
| CZT HV Monitor | 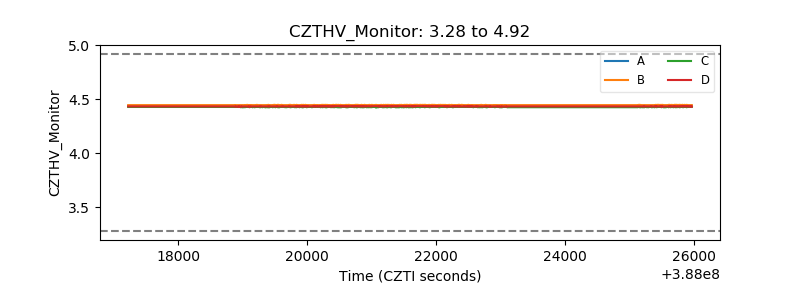 |
| D_VDD | 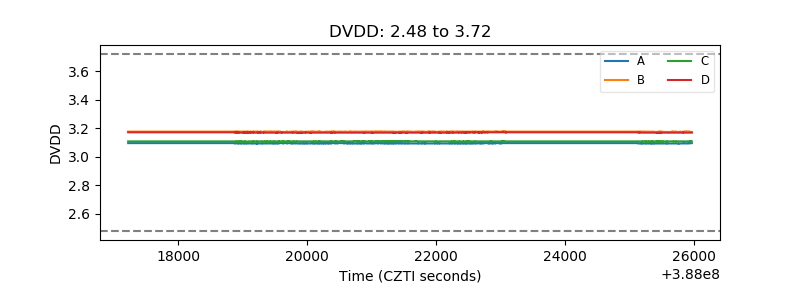 |
| Temperature 1 | 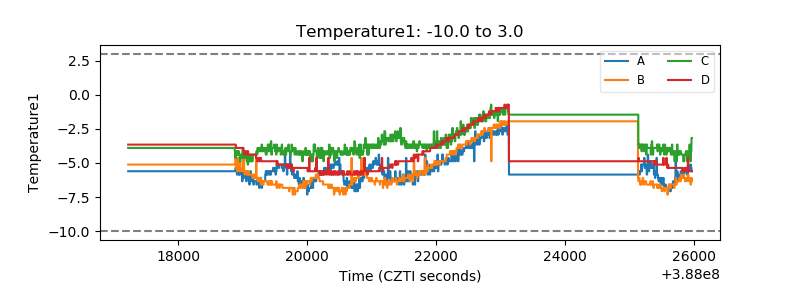 |
| Veto HV Monitor | 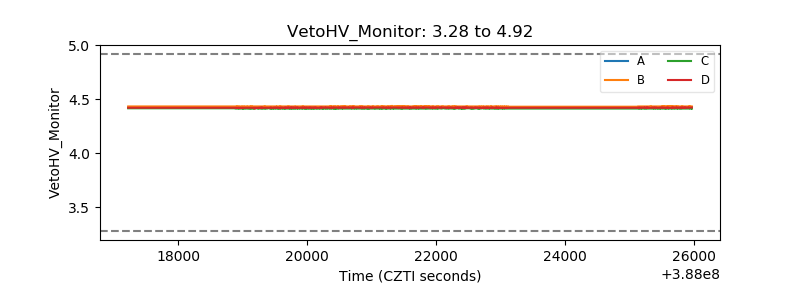 |
| Veto LLD | 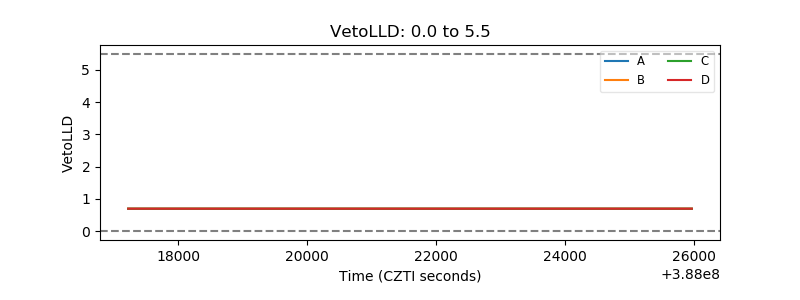 |
| Alpha Counter | 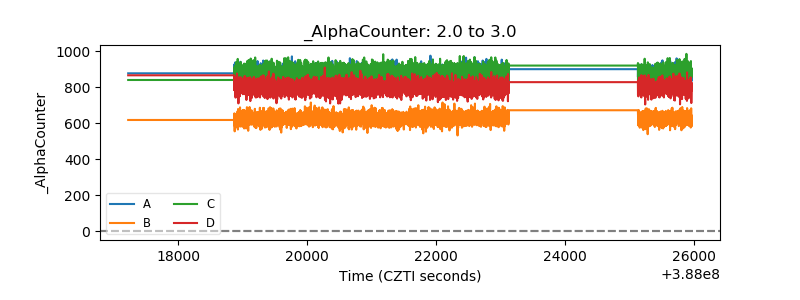 |
| _CPM_Rate | 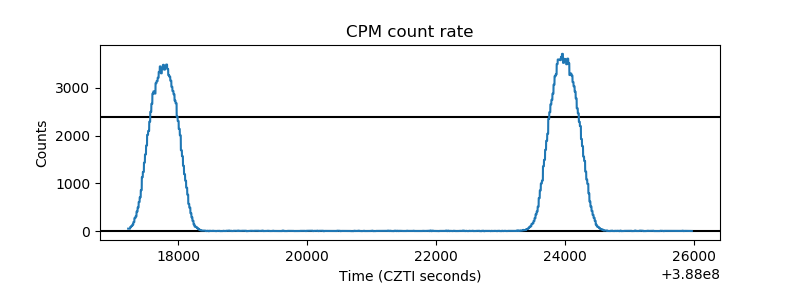 |
| CZT Counter | 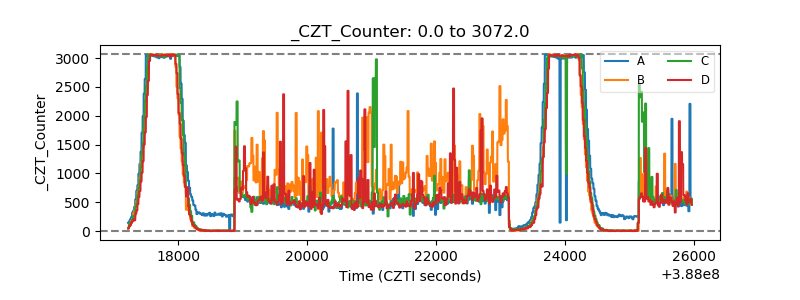 |
| +2.5 Volts monitor | 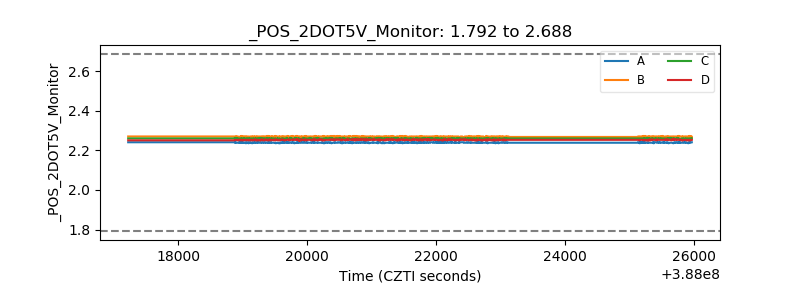 |
| +5 Volts monitor | 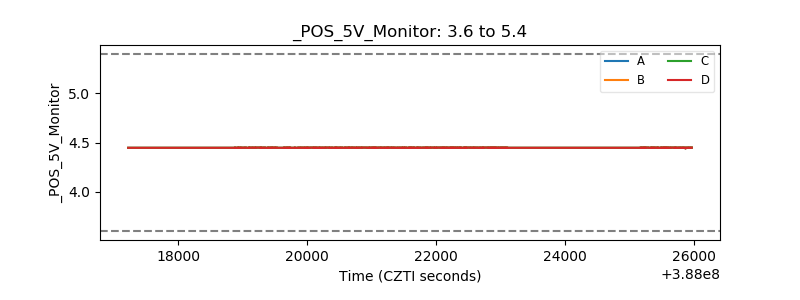 |
| _ROLL_ROT | 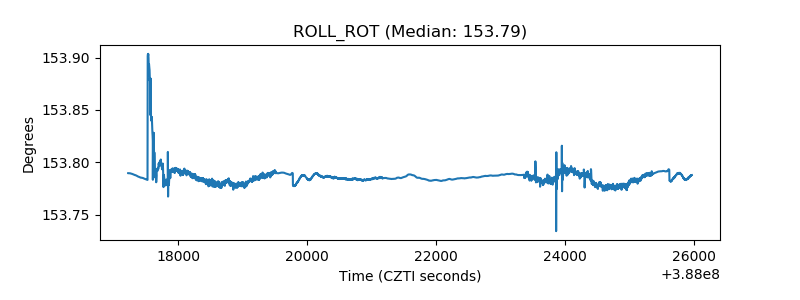 |
| _Roll_DEC | 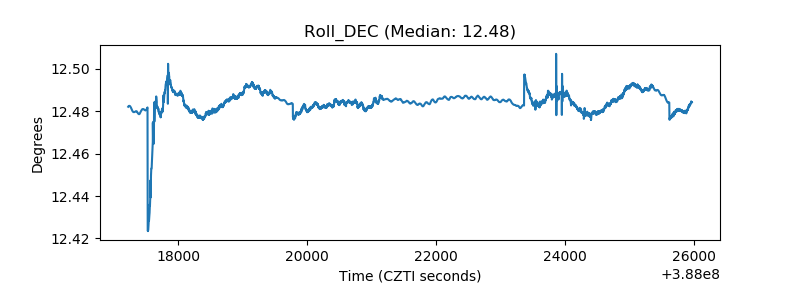 |
| _Roll_RA | 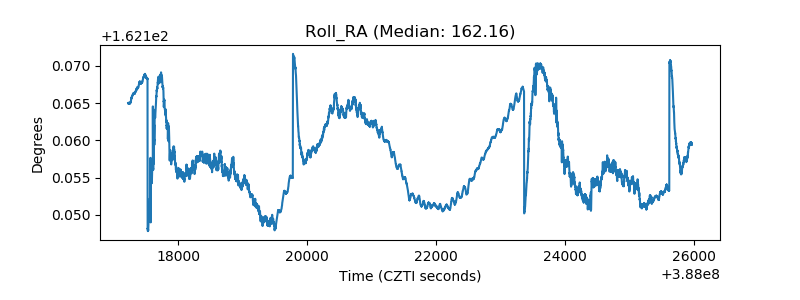 |
| Veto Counter | 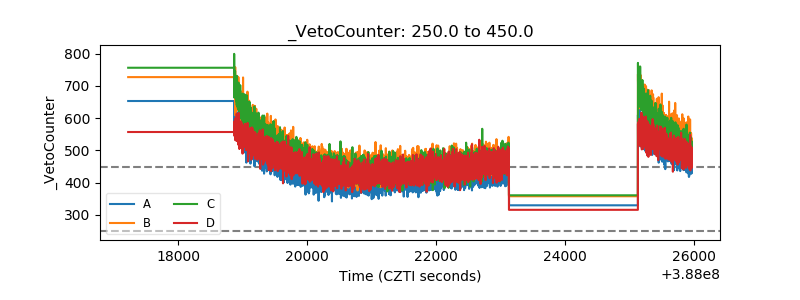 |