| Param | Original file | Final file |
|---|---|---|
| Filename | modeM0/AS1A11_068T03_9000005076_35448cztM0_level2.evt | modeM0/AS1A11_068T03_9000005076_35448cztM0_level2_quad_clean.evt |
| Size (bytes) | 253,866,240 | 34,902,720 |
| Size | 242.1 MB | 33.3 MB |
| Events in quadrant A | 1,508,108 | 217,329 |
| Events in quadrant B | 2,433,251 | 216,100 |
| Events in quadrant C | 1,705,616 | 212,566 |
| Events in quadrant D | 1,840,676 | 201,159 |
| Mode SS | |||
|---|---|---|---|
| Quadrant | BADHDUFLAG | Total packets | Discarded packets |
| A | 0 | 60 | 0 |
| B | 0 | 60 | 0 |
| C | 0 | 60 | 0 |
| D | 0 | 60 | 0 |
| Mode M0 | |||
|---|---|---|---|
| Quadrant | BADHDUFLAG | Total packets | Discarded packets |
| A | 0 | 6135 | 2 |
| B | 0 | 9274 | 1 |
| C | 0 | 6670 | 1 |
| D | 0 | 7307 | 1 |
| Mode M9 | |||
|---|---|---|---|
| Quadrant | BADHDUFLAG | Total packets | Discarded packets |
| A | 0 | 19 | 0 |
| B | 0 | 19 | 0 |
| C | 0 | 19 | 0 |
| D | 0 | 19 | 0 |
| Quadrant | Total seconds | Saturated seconds | Saturation percentage |
|---|---|---|---|
| A | 2935 | 4 | 0.136286% |
| B | 2935 | 115 | 3.918228% |
| C | 2935 | 50 | 1.703578% |
| D | 2935 | 60 | 2.044293% |
Noise dominated data is calculated using 1-second bins in cleaned event files. If a bin has >2000 counts, and if more than 50% of those come from <1% of pixels, then it is considered to be noise-dominated and hence unusable.
| Quadrant | # 1 sec bins | Bins with >0 counts | Bins with >2000 counts | High rate bins dominated by noise | Noise dominated (total time) | Noise dominated (detector-on time) | Marked lightcurve |
|---|---|---|---|---|---|---|---|
| A | 4818 | 2936 | 0 | 0 | 0.00% | 0.00% |  |
| B | 4818 | 2936 | 54 | 54 | 1.12% | 1.84% | 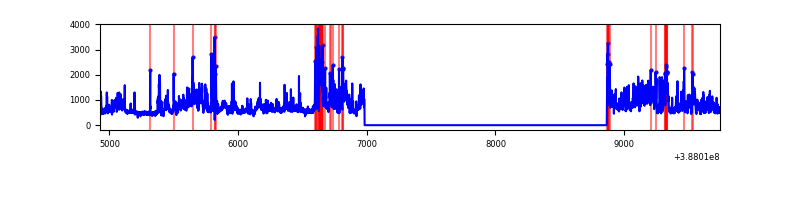 |
| C | 4818 | 2936 | 35 | 35 | 0.73% | 1.19% | 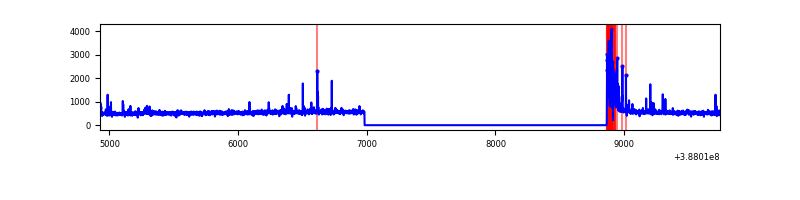 |
| D | 4818 | 2936 | 44 | 44 | 0.91% | 1.50% | 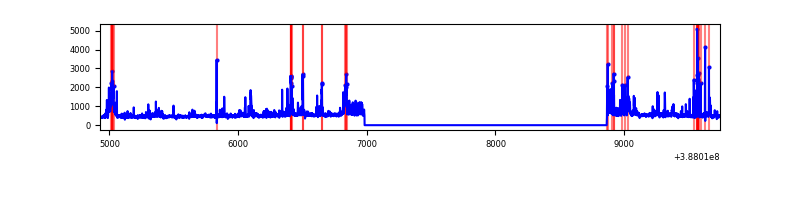 |
Top three noisy pixels from each quadrant. If the there are fewer than three noisy pixels in the level2.evt file, extra rows are filled as -1
| Pixel properties | Quadrant properties | ||||||
|---|---|---|---|---|---|---|---|
| Quadrant | DetID | PixID | Counts | Sigma | Mean | Median | Sigma |
| A | 10 | 83 | 64682 | 846.33 | 370 | 363 | 76.0 |
| A | 13 | 6 | 5403 | 66.32 | 370 | 363 | 76.0 |
| A | 3 | 137 | 3852 | 45.91 | 370 | 363 | 76.0 |
| B | 4 | 251 | 676719 | 9443.97 | 365 | 356 | 71.6 |
| B | 5 | 200 | 100800 | 1402.49 | 365 | 356 | 71.6 |
| B | 5 | 236 | 78204 | 1086.98 | 365 | 356 | 71.6 |
| C | 0 | 10 | 133055 | 1565.56 | 358 | 361 | 84.8 |
| C | 15 | 214 | 120574 | 1418.31 | 358 | 361 | 84.8 |
| C | 0 | 207 | 34612 | 404.1 | 358 | 361 | 84.8 |
| D | 13 | 249 | 160279 | 1805.63 | 355 | 345 | 88.6 |
| D | 1 | 47 | 50560 | 566.92 | 355 | 345 | 88.6 |
| D | 8 | 195 | 50342 | 564.46 | 355 | 345 | 88.6 |
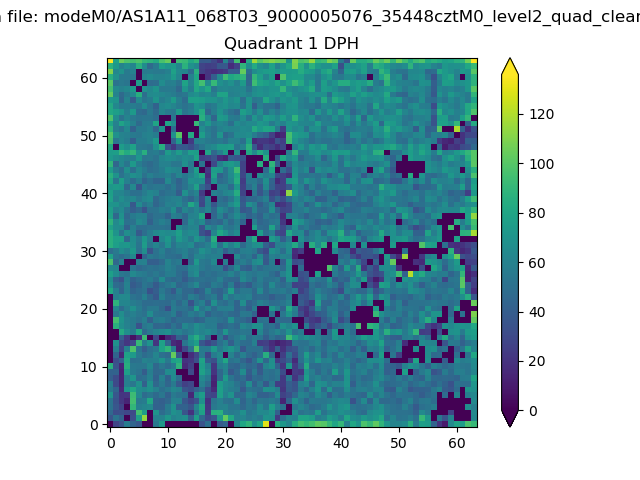
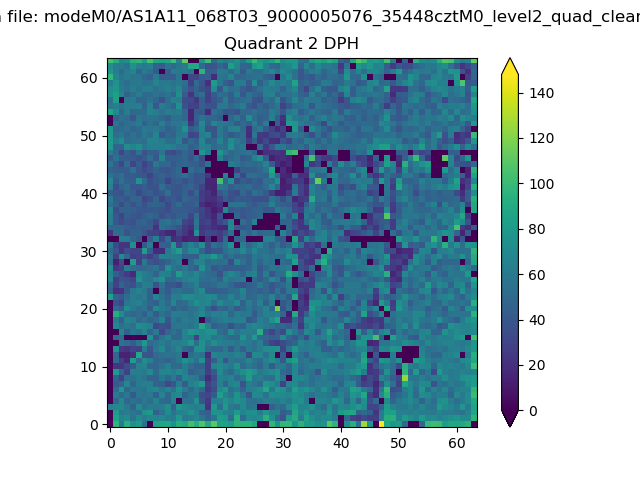
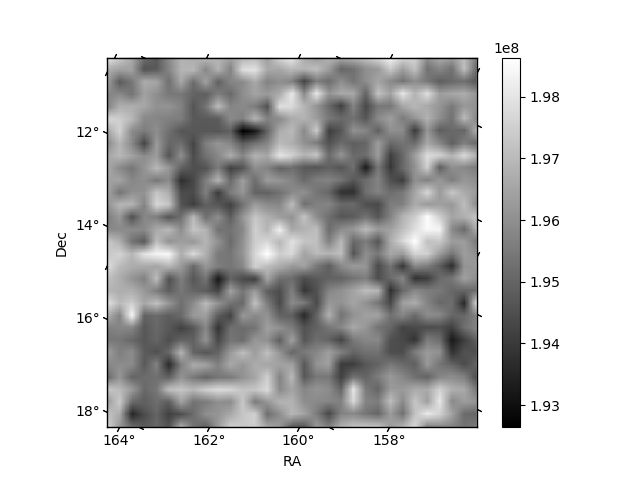
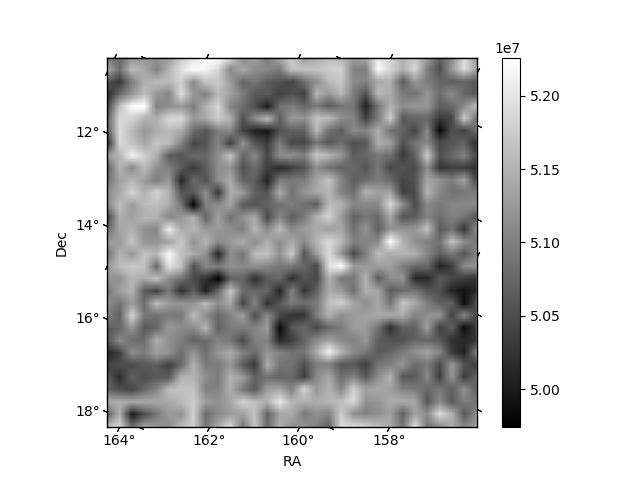
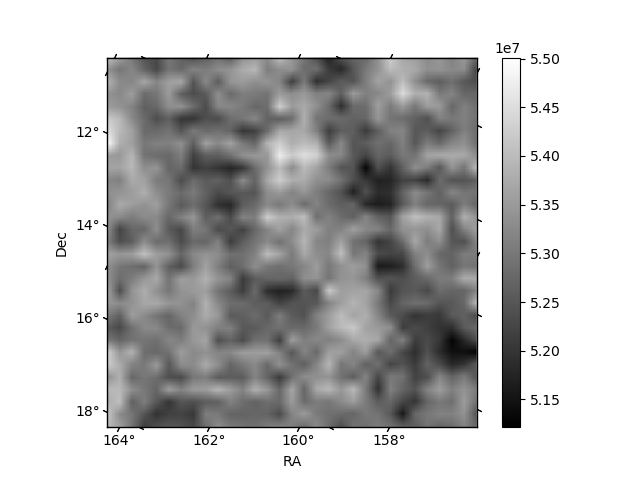
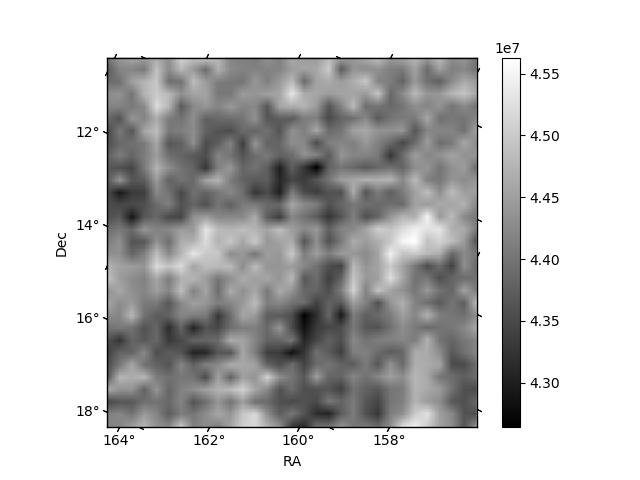
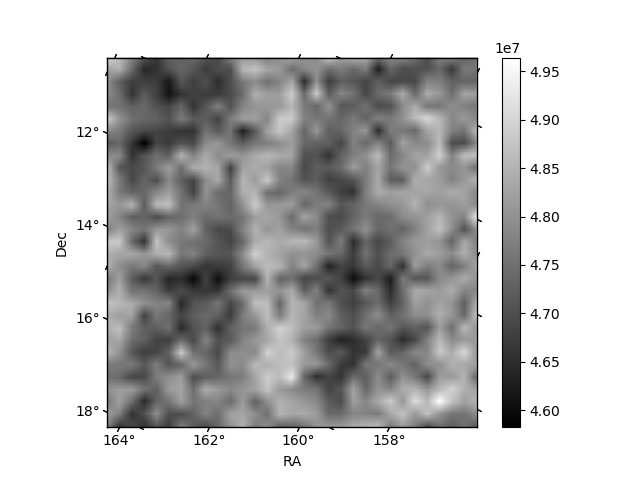
Histogram calculated using DETX and DETY for each event in the final _common_clean file
| Quadrant A | 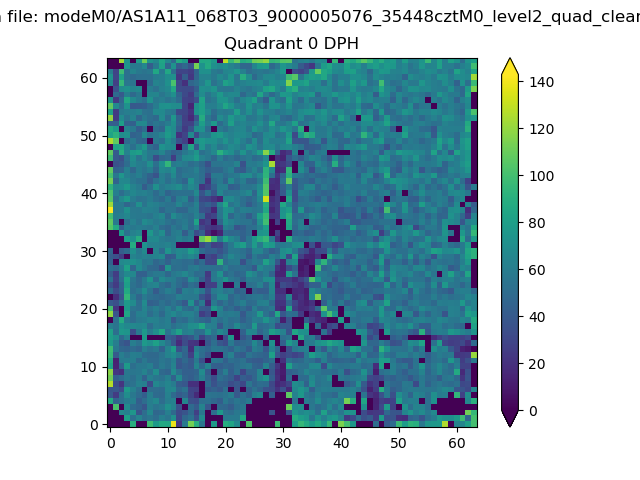 |
 |
Quadrant B |
|---|---|---|---|
| Quadrant D | 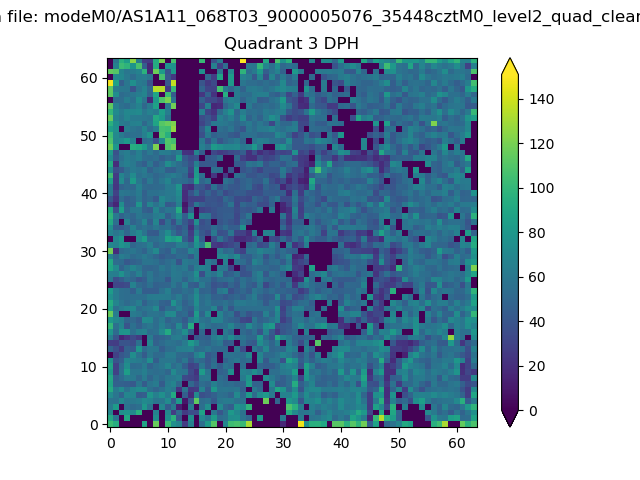 |
 |
Quadrant C |
| Plot type | Count rate plots | Images |
|---|---|---|
| Comparison with Poisson distribution Blue bars denote a histogram of data divided into 1 sec bins. Red curve is a Poisson curve with rate = median count rate of data. |
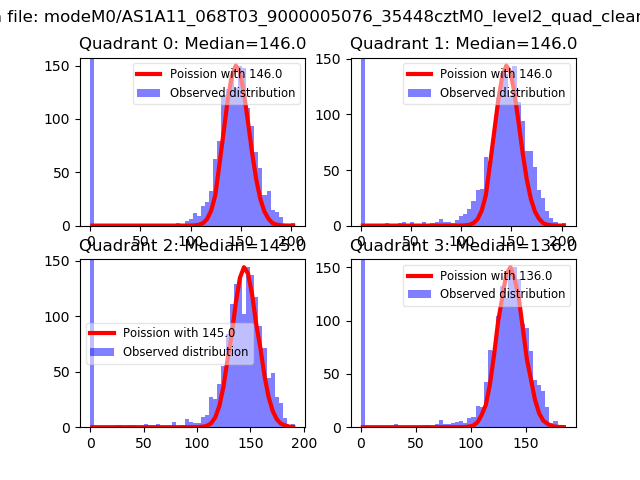 |
 |
| Quadrant-wise count rates Data is divided into 100 sec bins |
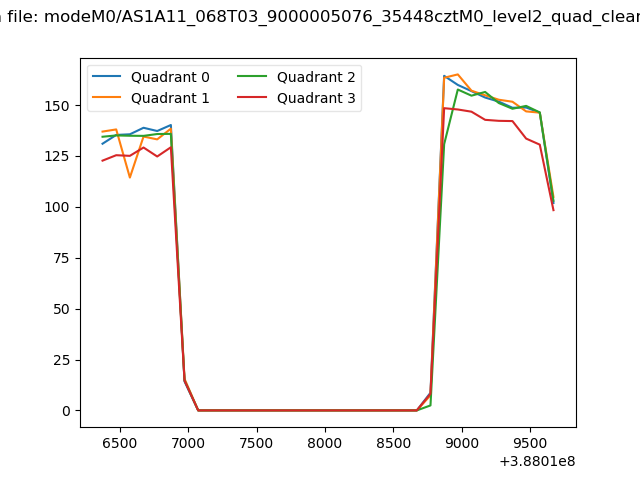 |
|
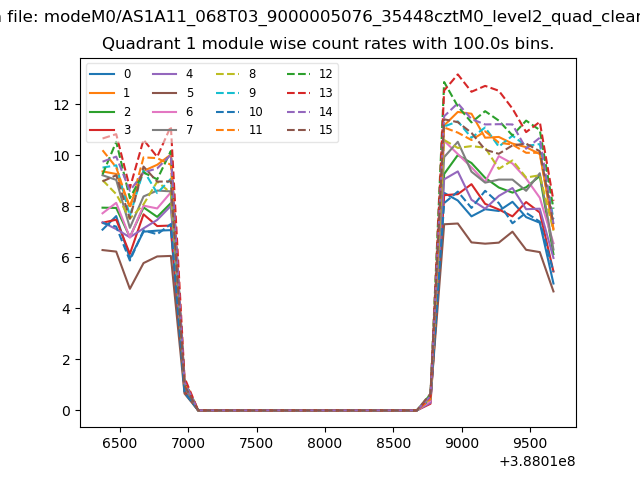
| Module-wise count rates for Quadrant A Data is divided into 100 sec bins |
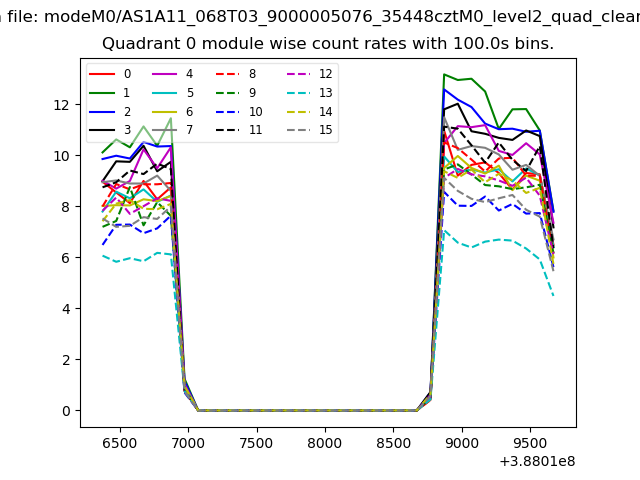 |
 |
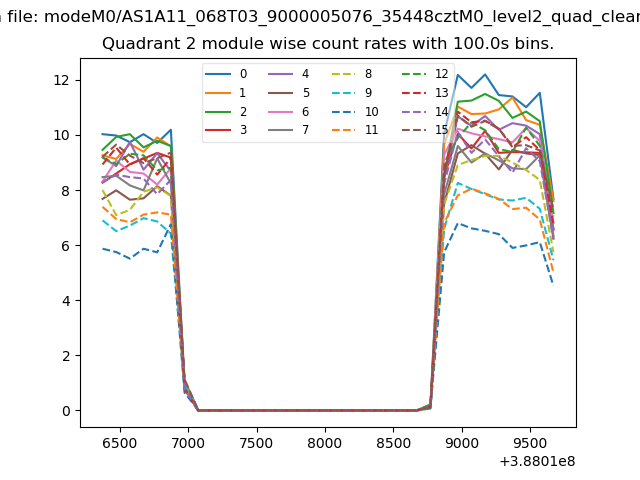
| Module-wise count rates for Quadrant B Data is divided into 100 sec bins |
 |
 |
| Module-wise count rates for Quadrant C Data is divided into 100 sec bins |
 |
 |
| Module-wise count rates for Quadrant D Data is divided into 100 sec bins |
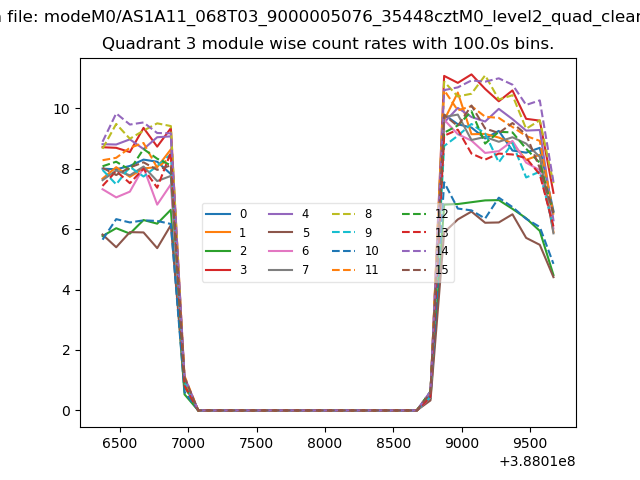 |
 |
| Parameter | Plot |
|---|---|
| CZT HV Monitor | 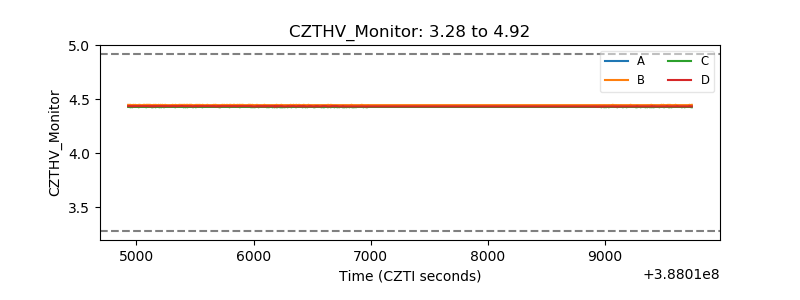 |
| D_VDD | 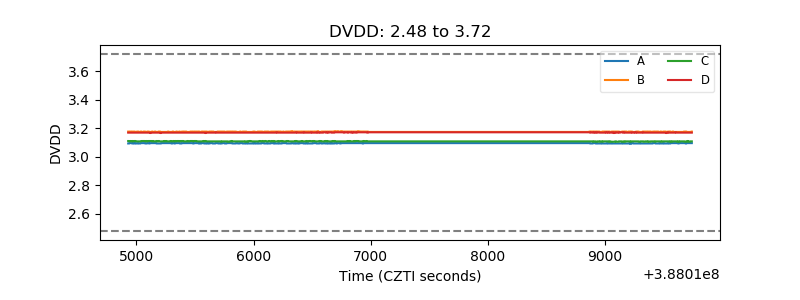 |
| Temperature 1 | 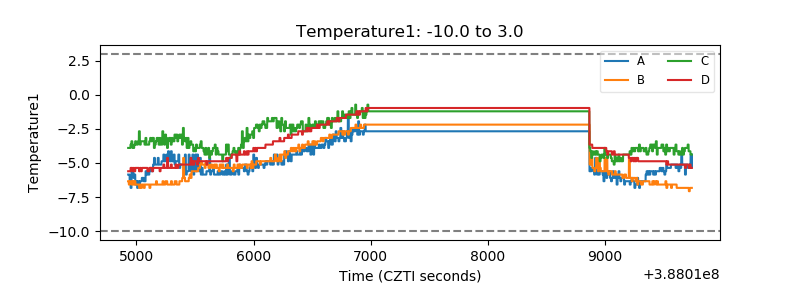 |
| Veto HV Monitor | 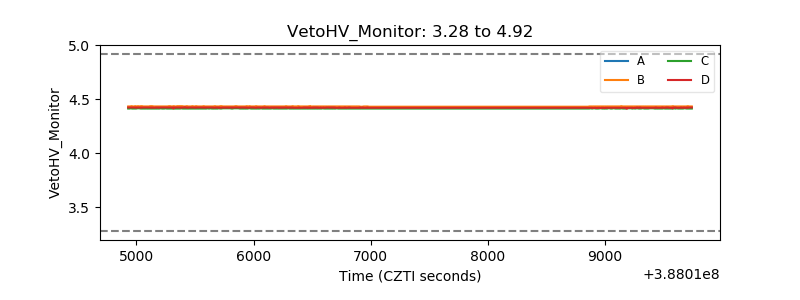 |
| Veto LLD | 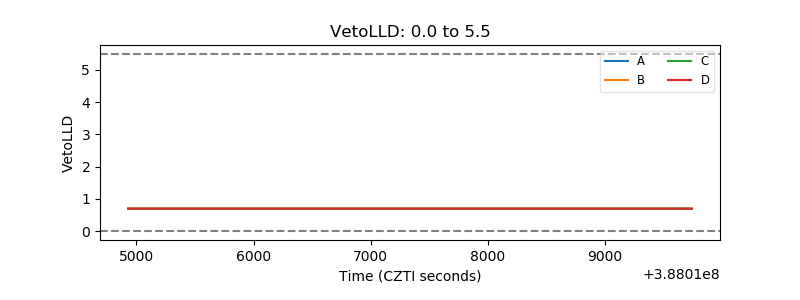 |
| Alpha Counter | 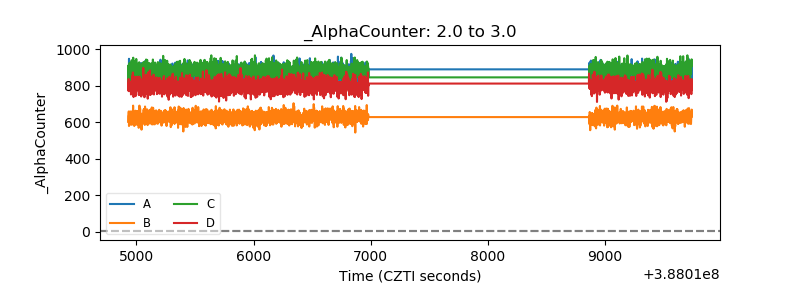 |
| _CPM_Rate | 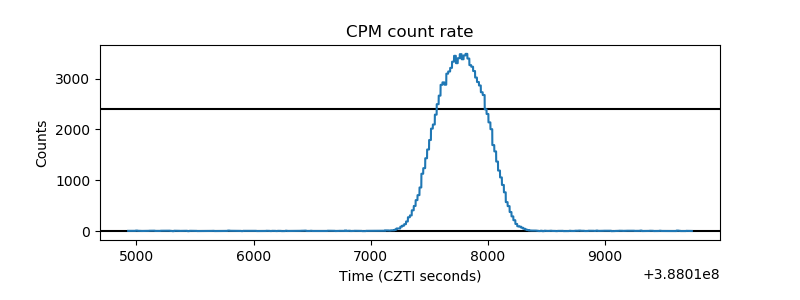 |
| CZT Counter | 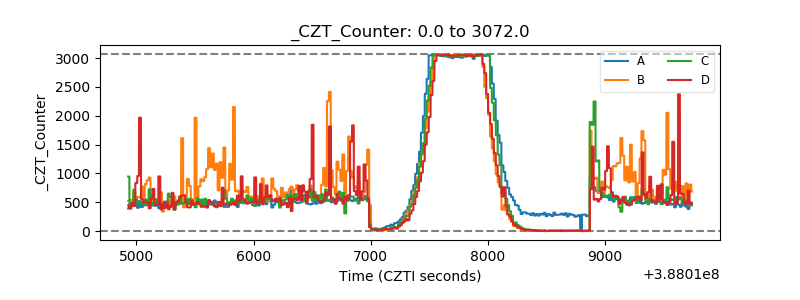 |
| +2.5 Volts monitor | 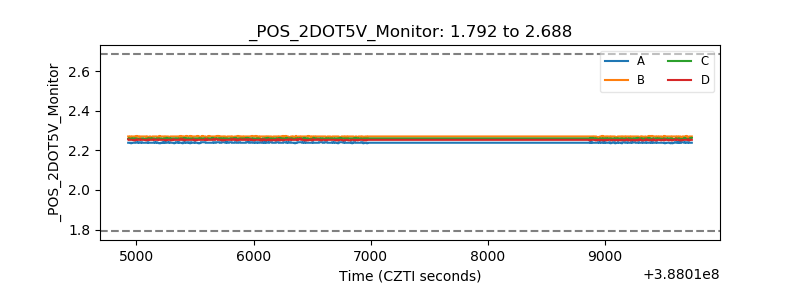 |
| +5 Volts monitor | 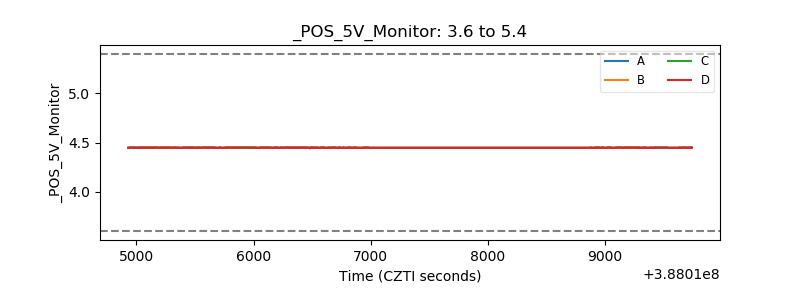 |
| _ROLL_ROT | 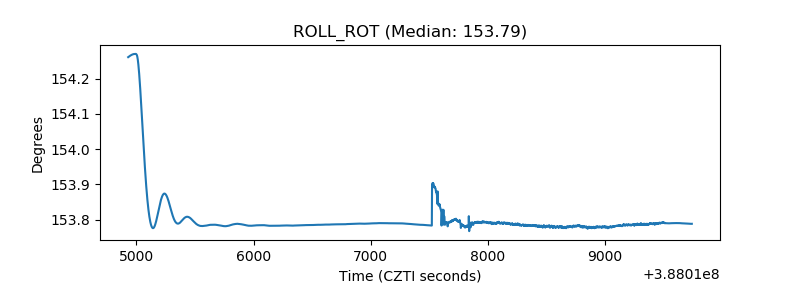 |
| _Roll_DEC | 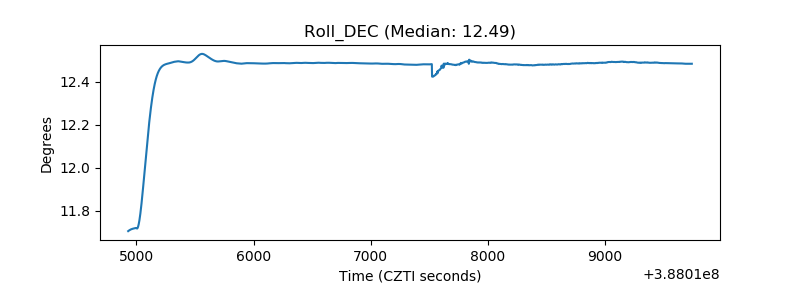 |
| _Roll_RA | 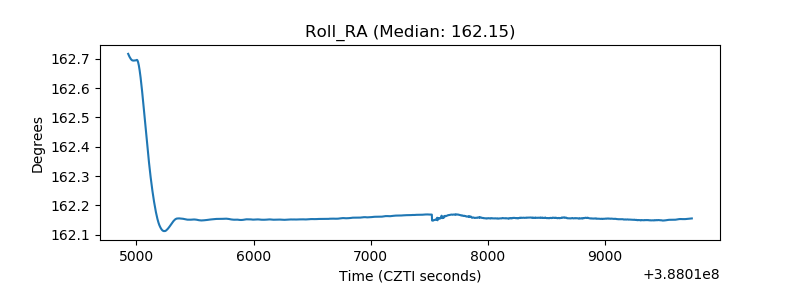 |
| Veto Counter | 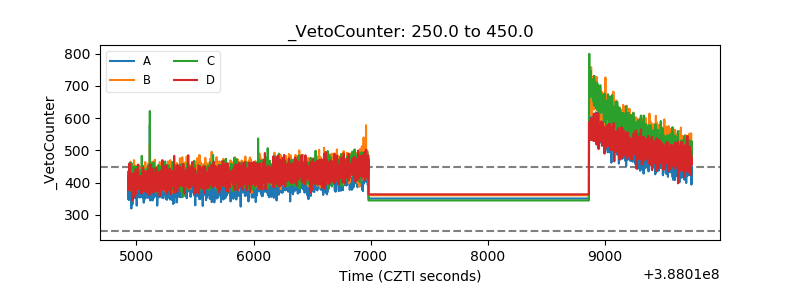 |