| Param | Original file | Final file |
|---|---|---|
| Filename | modeM0/AS1A11_068T03_9000005076cztM0_level2_bc.evt | modeM0/AS1A11_068T03_9000005076cztM0_level2_quad_clean.evt |
| Size (bytes) | 2,044,497,600 | 495,492,480 |
| Size | 1.9 GB | 472.5 MB |
| Events in quadrant A | 9,258,517 | 3,188,660 |
| Events in quadrant B | 24,208,920 | 3,005,781 |
| Events in quadrant C | 12,352,677 | 3,116,293 |
| Events in quadrant D | 13,369,517 | 2,943,434 |
| Mode SS | |||
|---|---|---|---|
| Quadrant | BADHDUFLAG | Total packets | Discarded packets |
| A | 0 | 818 | 0 |
| B | 0 | 818 | 0 |
| C | 0 | 818 | 0 |
| D | 0 | 818 | 0 |
| Mode M0 | |||
|---|---|---|---|
| Quadrant | BADHDUFLAG | Total packets | Discarded packets |
| A | 0 | 82862 | 0 |
| B | 0 | 141313 | 0 |
| C | 0 | 92013 | 0 |
| D | 0 | 99181 | 0 |
| Mode M9 | |||
|---|---|---|---|
| Quadrant | BADHDUFLAG | Total packets | Discarded packets |
| A | 0 | 163 | 0 |
| B | 0 | 163 | 0 |
| C | 0 | 163 | 0 |
| D | 0 | 163 | 0 |
| Quadrant | Total seconds | Saturated seconds | Saturation percentage |
|---|---|---|---|
| A | 40087 | 72 | 0.179609% |
| B | 40087 | 4971 | 12.400529% |
| C | 40087 | 734 | 1.831018% |
| D | 40087 | 1110 | 2.768977% |
Noise dominated data is calculated using 1-second bins in cleaned event files. If a bin has >2000 counts, and if more than 50% of those come from <1% of pixels, then it is considered to be noise-dominated and hence unusable.
| Quadrant | # 1 sec bins | Bins with >0 counts | Bins with >2000 counts | High rate bins dominated by noise | Noise dominated (total time) | Noise dominated (detector-on time) | Marked lightcurve |
|---|---|---|---|---|---|---|---|
| A | 56340 | 40096 | 4 | 4 | 0.01% | 0.01% |  |
| B | 56340 | 40087 | 241 | 241 | 0.43% | 0.60% | 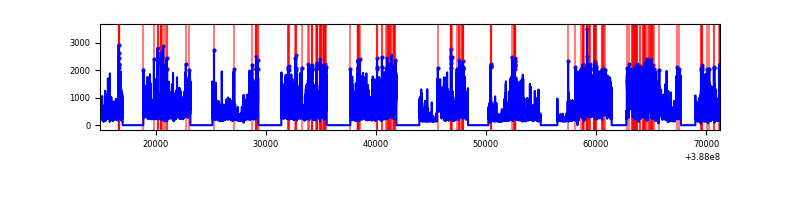 |
| C | 56340 | 40089 | 108 | 108 | 0.19% | 0.27% | 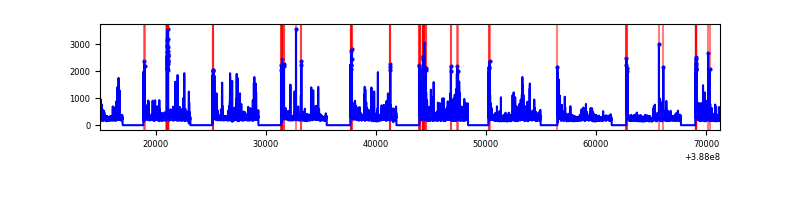 |
| D | 56340 | 40088 | 130 | 130 | 0.23% | 0.32% | 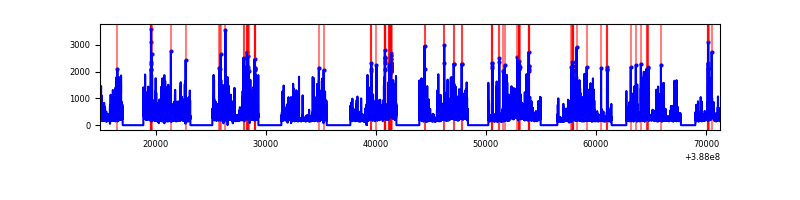 |
Top three noisy pixels from each quadrant. If the there are fewer than three noisy pixels in the level2.evt file, extra rows are filled as -1
| Pixel properties | Quadrant properties | ||||||
|---|---|---|---|---|---|---|---|
| Quadrant | DetID | PixID | Counts | Sigma | Mean | Median | Sigma |
| A | 10 | 83 | 719182 | 1559.68 | 2115 | 2081 | 459.8 |
| A | 13 | 6 | 178050 | 382.73 | 2115 | 2081 | 459.8 |
| A | 9 | 143 | 147458 | 316.19 | 2115 | 2081 | 459.8 |
| B | 4 | 251 | 11080135 | 27793.61 | 2044 | 2005 | 398.6 |
| B | 5 | 236 | 2580731 | 6469.69 | 2044 | 2005 | 398.6 |
| B | 5 | 172 | 1097817 | 2749.25 | 2044 | 2005 | 398.6 |
| C | 0 | 10 | 1723327 | 3701.42 | 2050 | 2034 | 465.0 |
| C | 15 | 214 | 1541899 | 3311.28 | 2050 | 2034 | 465.0 |
| C | 0 | 207 | 493281 | 1056.36 | 2050 | 2034 | 465.0 |
| D | 13 | 249 | 1603074 | 3362.72 | 2040 | 1976 | 476.1 |
| D | 8 | 195 | 782928 | 1640.2 | 2040 | 1976 | 476.1 |
| D | 1 | 52 | 393955 | 823.26 | 2040 | 1976 | 476.1 |
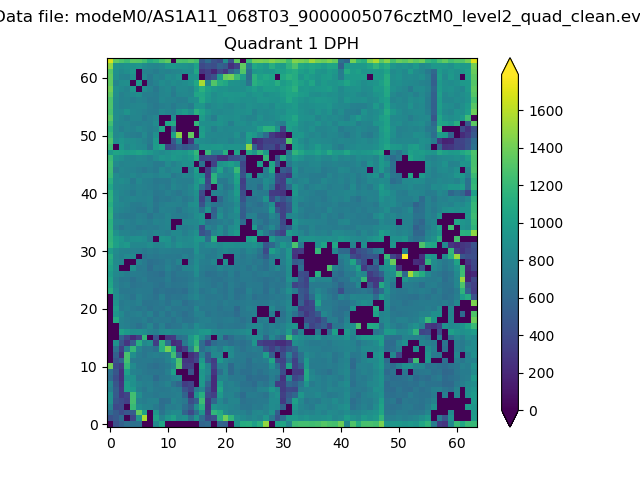
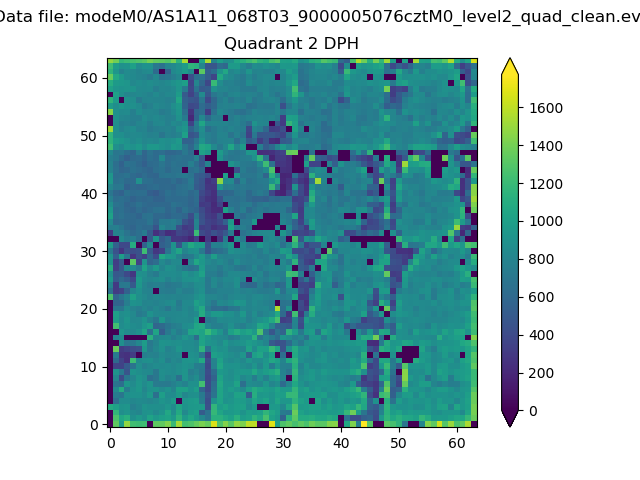
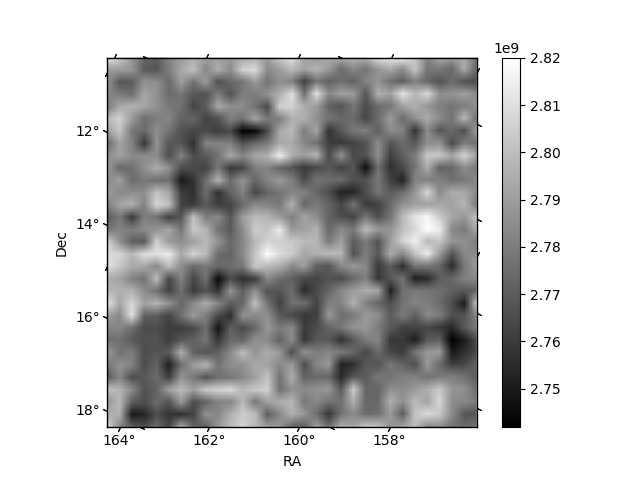
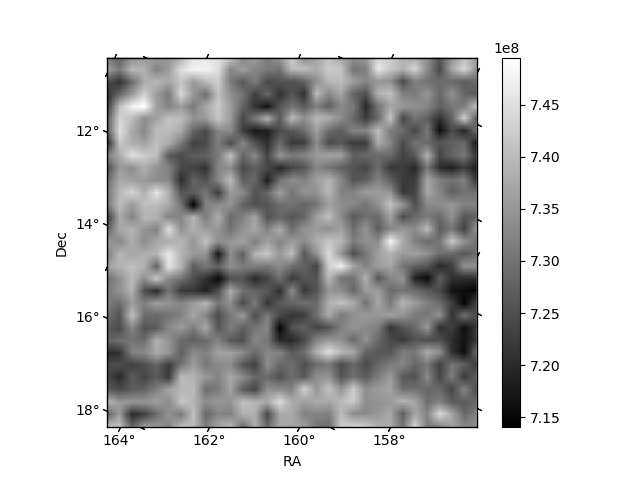
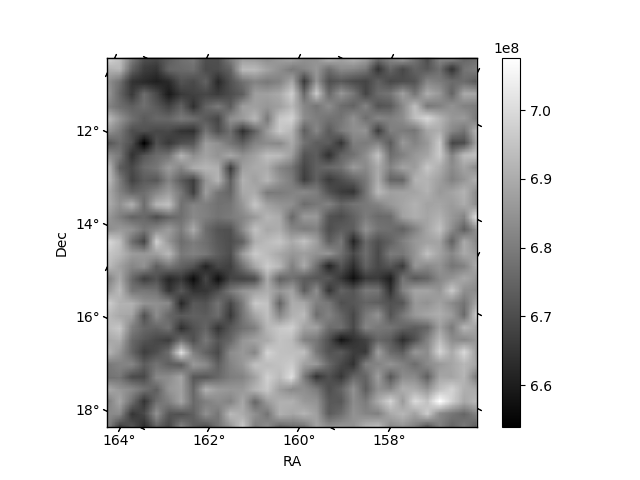
Histogram calculated using DETX and DETY for each event in the final _common_clean file
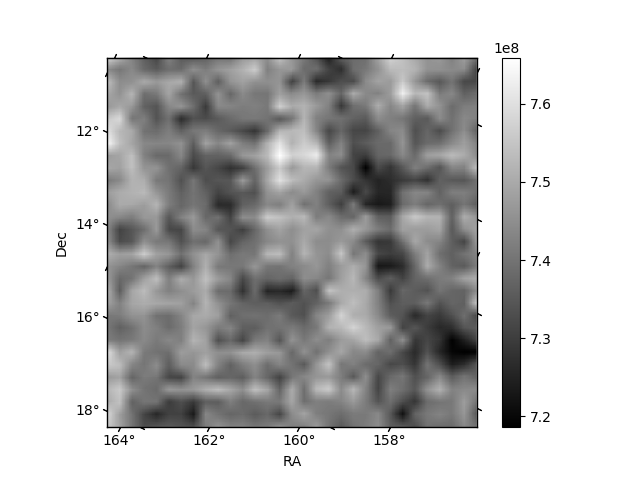
| Quadrant A | 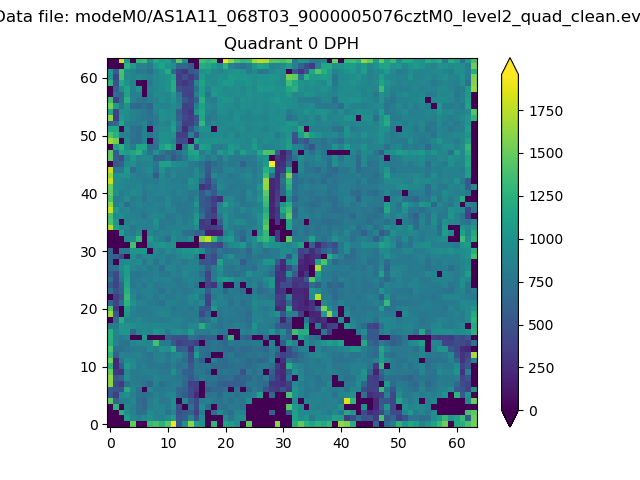 |
 |
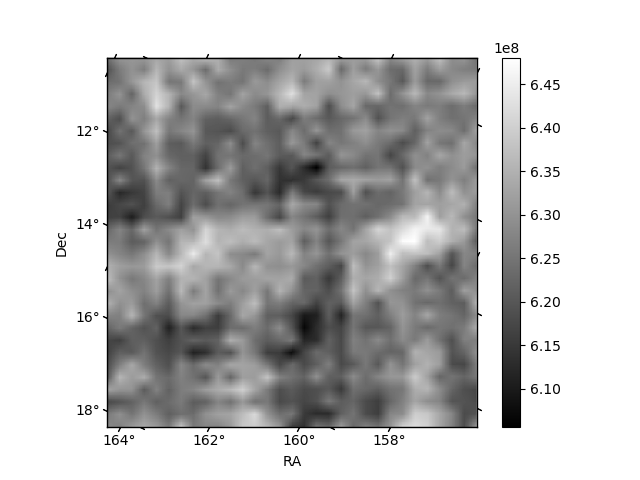
Quadrant B |
|---|---|---|---|
| Quadrant D | 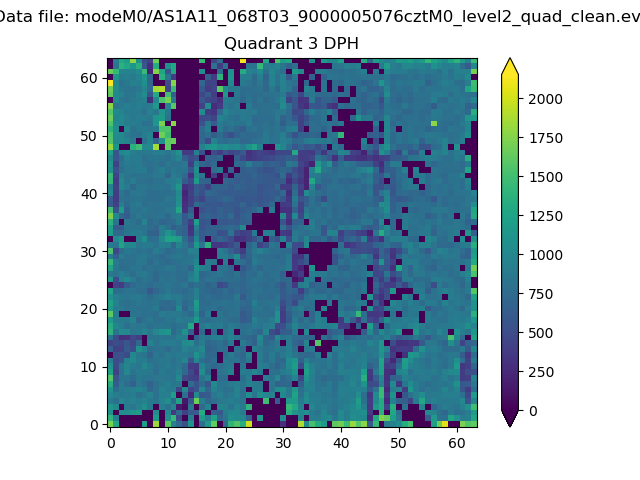 |
 |
Quadrant C |
| Plot type | Count rate plots | Images |
|---|---|---|
| Comparison with Poisson distribution Blue bars denote a histogram of data divided into 1 sec bins. Red curve is a Poisson curve with rate = median count rate of data. |
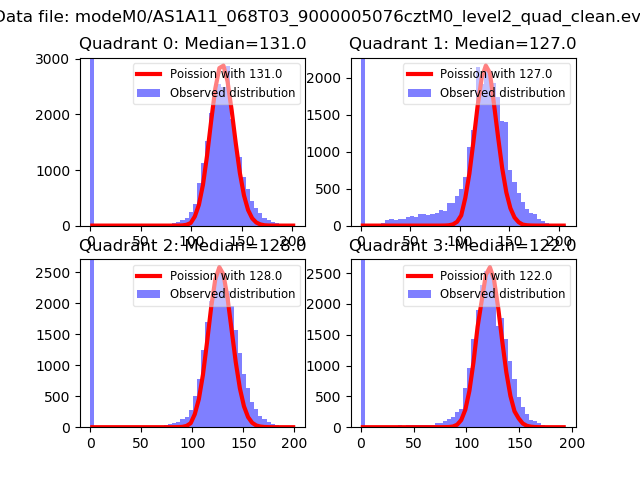 |
 |
| Quadrant-wise count rates Data is divided into 100 sec bins |
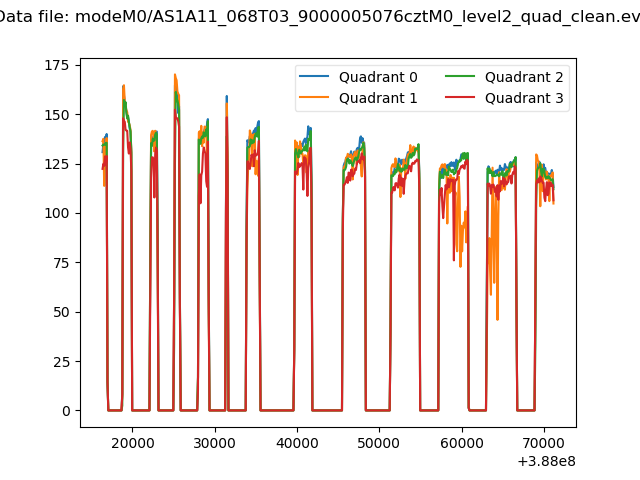 |
|
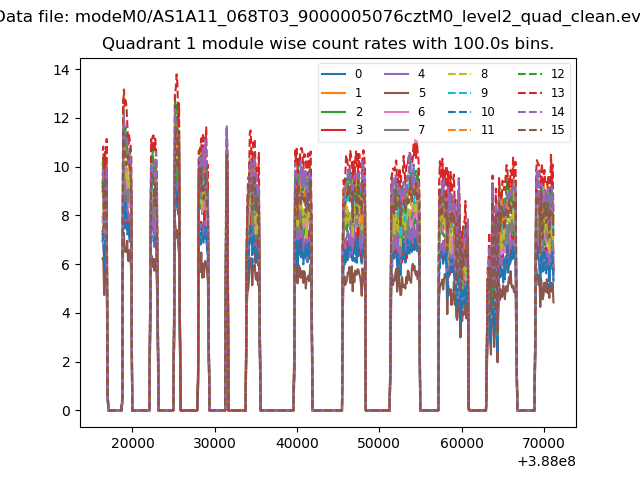
| Module-wise count rates for Quadrant A Data is divided into 100 sec bins |
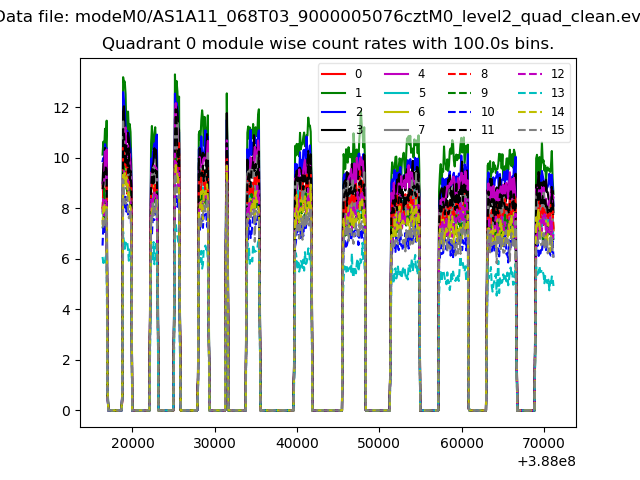 |
 |
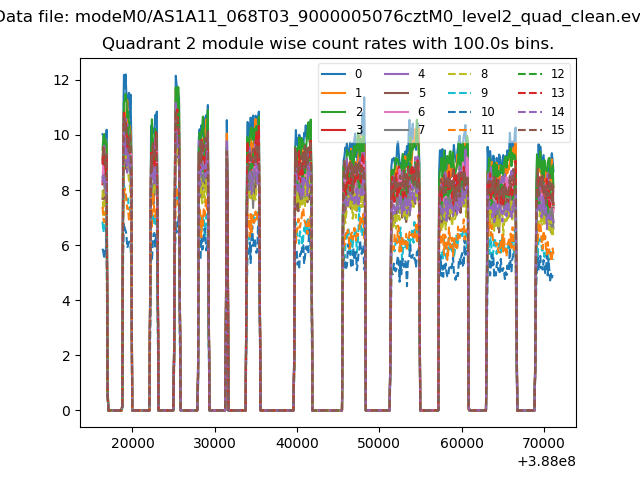
| Module-wise count rates for Quadrant B Data is divided into 100 sec bins |
 |
 |
| Module-wise count rates for Quadrant C Data is divided into 100 sec bins |
 |
 |
| Module-wise count rates for Quadrant D Data is divided into 100 sec bins |
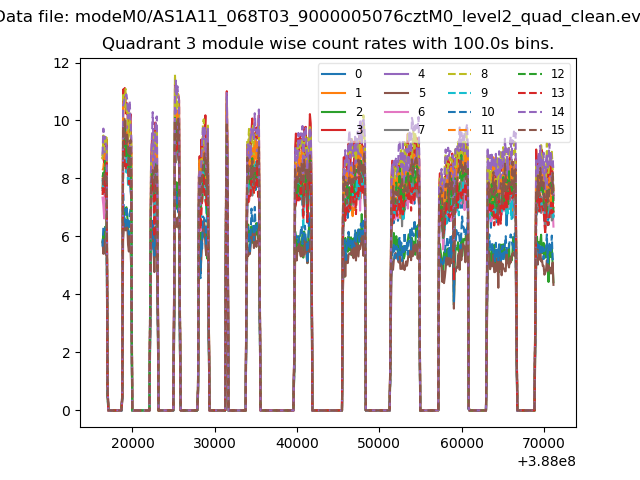 |
 |
| Parameter | Plot |
|---|---|
| CZT HV Monitor | 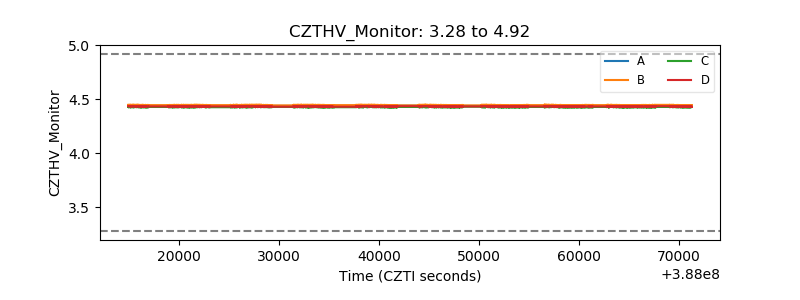 |
| D_VDD | 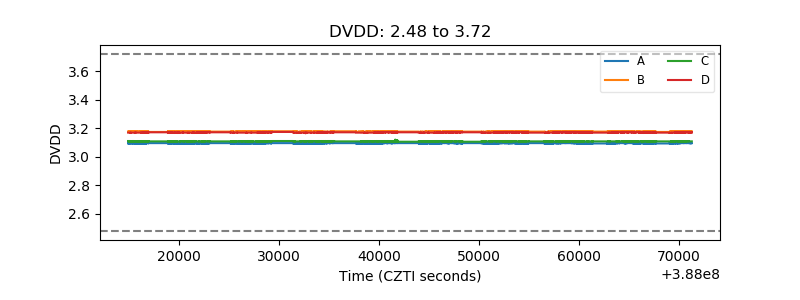 |
| Temperature 1 | 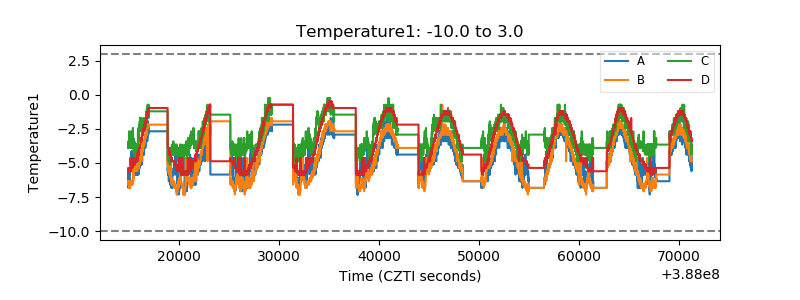 |
| Veto HV Monitor | 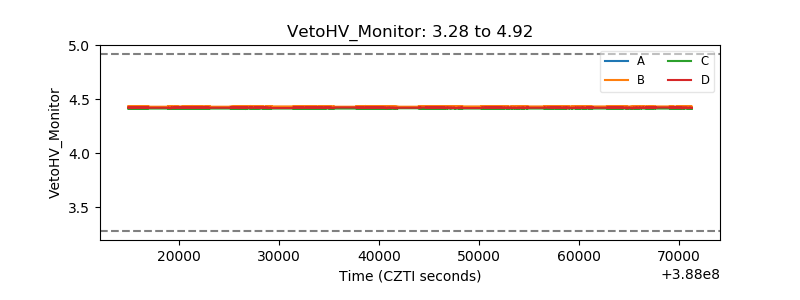 |
| Veto LLD | 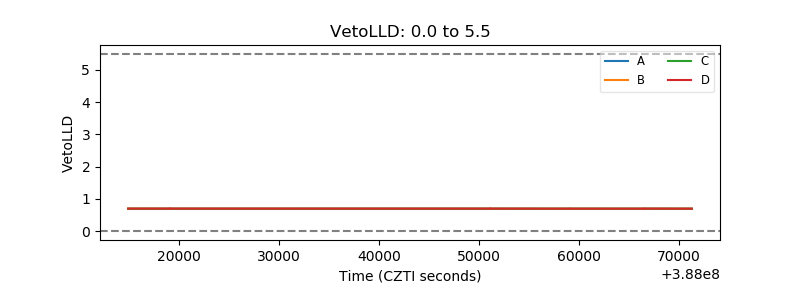 |
| Alpha Counter | 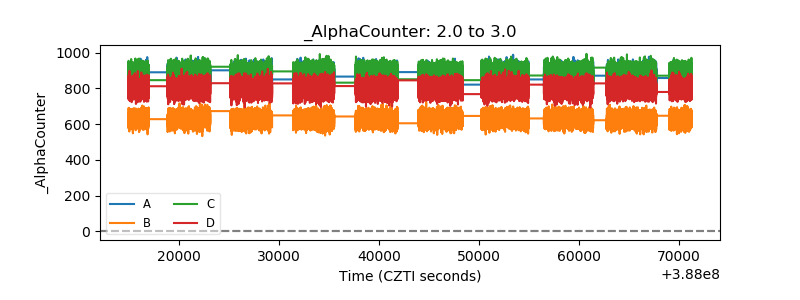 |
| _CPM_Rate | 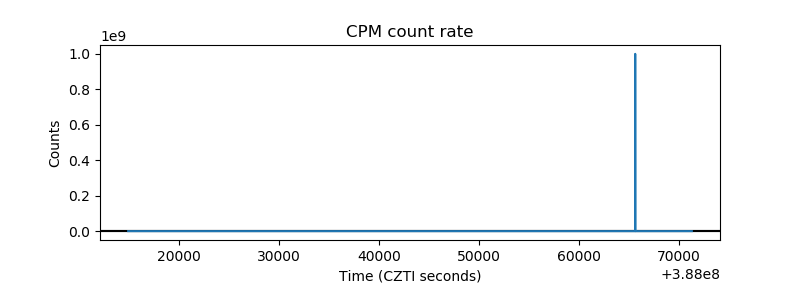 |
| CZT Counter | 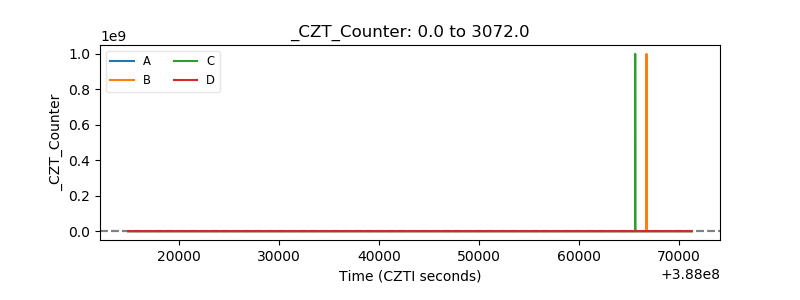 |
| +2.5 Volts monitor | 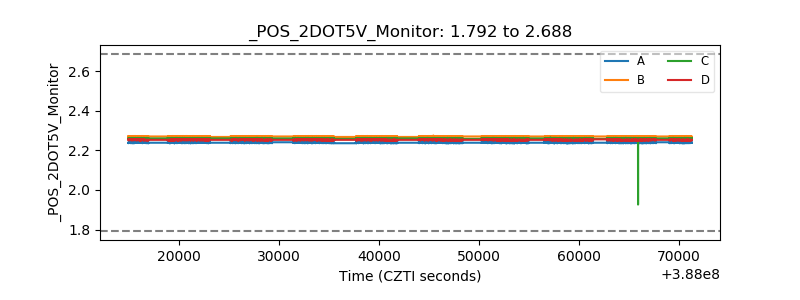 |
| +5 Volts monitor | 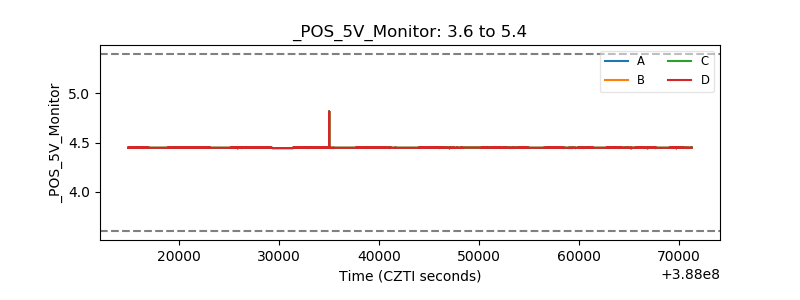 |
| _ROLL_ROT | 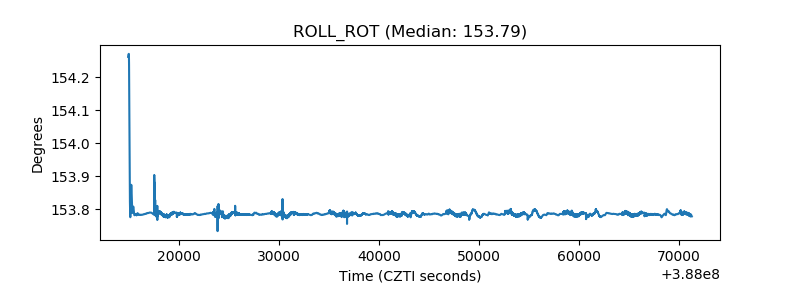 |
| _Roll_DEC | 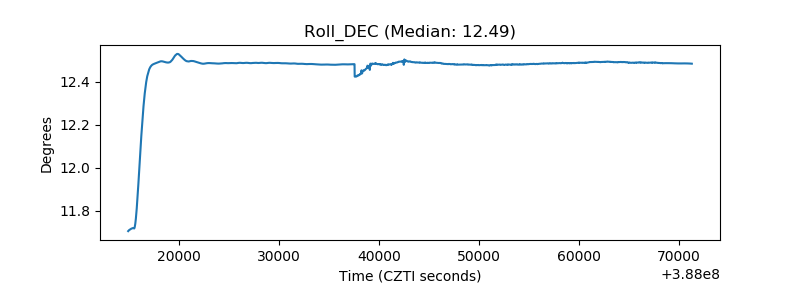 |
| _Roll_RA | 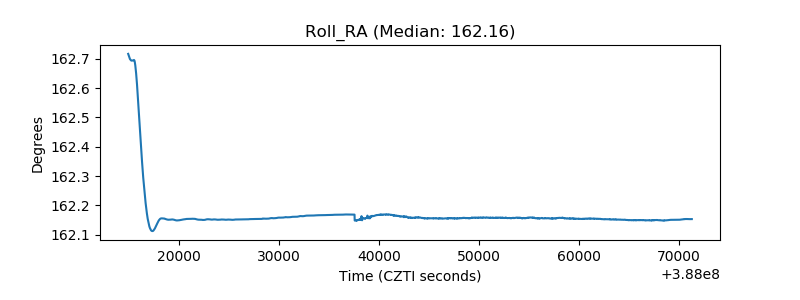 |
| Veto Counter | 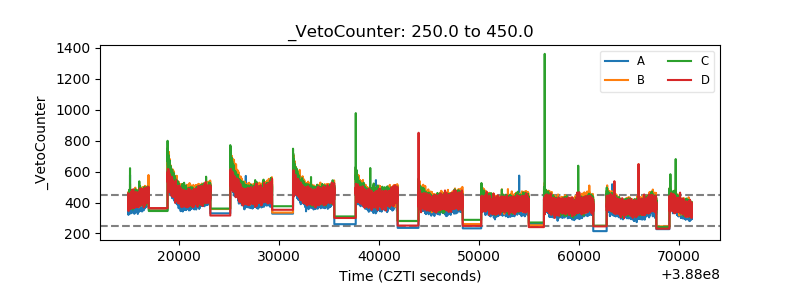 |