| Param | Original file | Final file |
|---|---|---|
| Filename | modeM0/AS1A11_097T17_9000005074_35447cztM0_level2.evt | modeM0/AS1A11_097T17_9000005074_35447cztM0_level2_quad_clean.evt |
| Size (bytes) | 460,621,440 | 80,723,520 |
| Size | 439.3 MB | 77.0 MB |
| Events in quadrant A | 2,714,446 | 508,923 |
| Events in quadrant B | 4,142,551 | 515,374 |
| Events in quadrant C | 3,317,238 | 524,169 |
| Events in quadrant D | 3,387,375 | 495,906 |
| Mode M9 | |||
|---|---|---|---|
| Quadrant | BADHDUFLAG | Total packets | Discarded packets |
| A | 0 | 34 | 0 |
| B | 0 | 34 | 0 |
| C | 0 | 34 | 0 |
| D | 0 | 34 | 0 |
| Mode M0 | |||
|---|---|---|---|
| Quadrant | BADHDUFLAG | Total packets | Discarded packets |
| A | 0 | 11840 | 3 |
| B | 0 | 16347 | 2 |
| C | 0 | 13532 | 2 |
| D | 0 | 14027 | 2 |
| Mode SS | |||
|---|---|---|---|
| Quadrant | BADHDUFLAG | Total packets | Discarded packets |
| A | 0 | 118 | 0 |
| B | 0 | 118 | 0 |
| C | 0 | 118 | 0 |
| D | 0 | 118 | 0 |
| Quadrant | Total seconds | Saturated seconds | Saturation percentage |
|---|---|---|---|
| A | 5723 | 8 | 0.139787% |
| B | 5723 | 85 | 1.485235% |
| C | 5723 | 64 | 1.118295% |
| D | 5723 | 182 | 3.180150% |
Noise dominated data is calculated using 1-second bins in cleaned event files. If a bin has >2000 counts, and if more than 50% of those come from <1% of pixels, then it is considered to be noise-dominated and hence unusable.
| Quadrant | # 1 sec bins | Bins with >0 counts | Bins with >2000 counts | High rate bins dominated by noise | Noise dominated (total time) | Noise dominated (detector-on time) | Marked lightcurve |
|---|---|---|---|---|---|---|---|
| A | 9099 | 5725 | 0 | 0 | 0.00% | 0.00% | 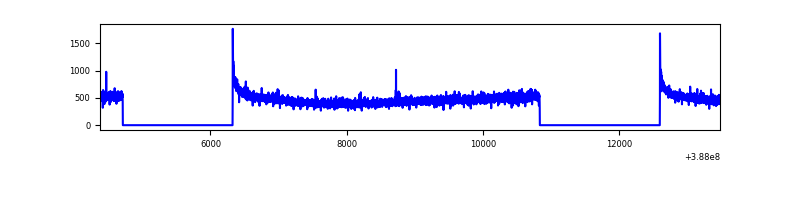 |
| B | 9099 | 5725 | 19 | 19 | 0.21% | 0.33% | 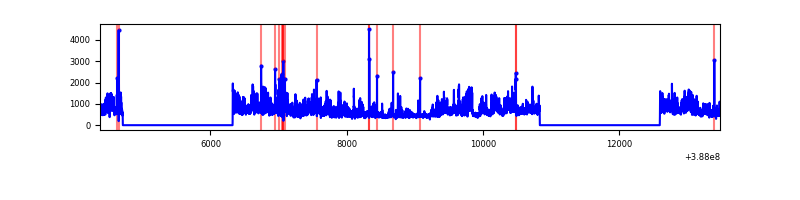 |
| C | 9099 | 5725 | 42 | 42 | 0.46% | 0.73% | 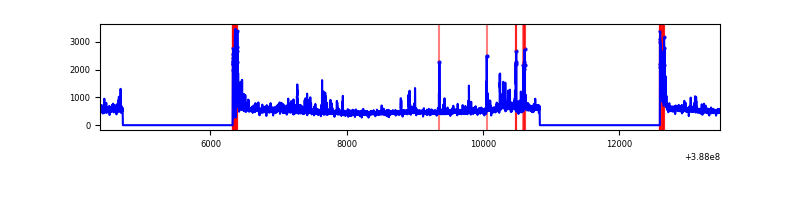 |
| D | 9099 | 5723 | 133 | 133 | 1.46% | 2.32% | 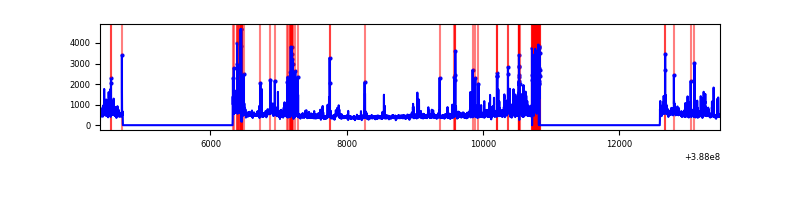 |
Top three noisy pixels from each quadrant. If the there are fewer than three noisy pixels in the level2.evt file, extra rows are filled as -1
| Pixel properties | Quadrant properties | ||||||
|---|---|---|---|---|---|---|---|
| Quadrant | DetID | PixID | Counts | Sigma | Mean | Median | Sigma |
| A | 10 | 83 | 126854 | 951.16 | 665 | 650 | 132.7 |
| A | 13 | 6 | 9557 | 67.13 | 665 | 650 | 132.7 |
| A | 3 | 137 | 7084 | 48.49 | 665 | 650 | 132.7 |
| B | 4 | 251 | 1299491 | 10219.0 | 664 | 645 | 127.1 |
| B | 5 | 172 | 115635 | 904.71 | 664 | 645 | 127.1 |
| B | 5 | 236 | 63768 | 496.64 | 664 | 645 | 127.1 |
| C | 15 | 214 | 237071 | 1558.92 | 657 | 661 | 151.6 |
| C | 1 | 23 | 213862 | 1405.87 | 657 | 661 | 151.6 |
| C | 0 | 10 | 198969 | 1307.67 | 657 | 661 | 151.6 |
| D | 7 | 80 | 401152 | 2588.43 | 642 | 626 | 154.7 |
| D | 13 | 249 | 241526 | 1556.83 | 642 | 626 | 154.7 |
| D | 2 | 153 | 97630 | 626.9 | 642 | 626 | 154.7 |
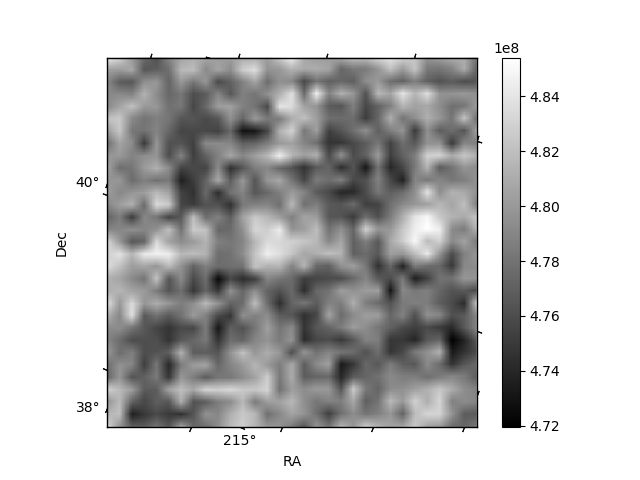
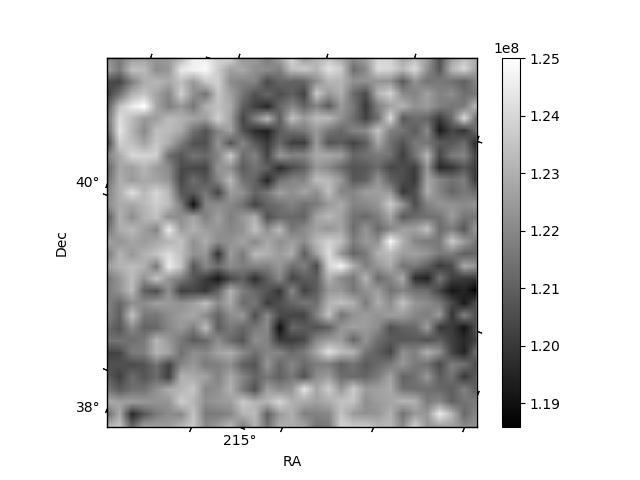
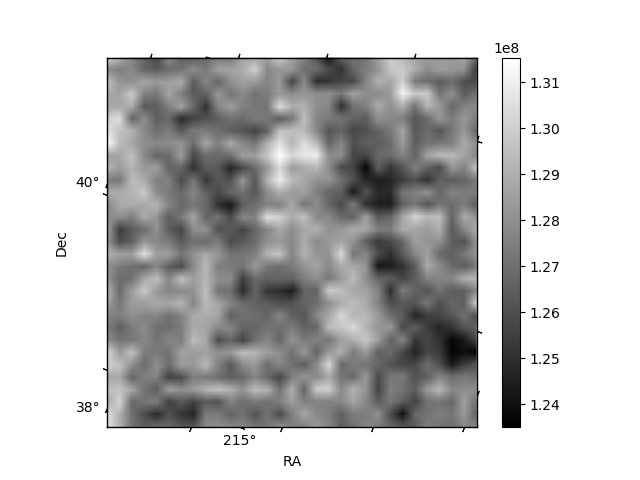
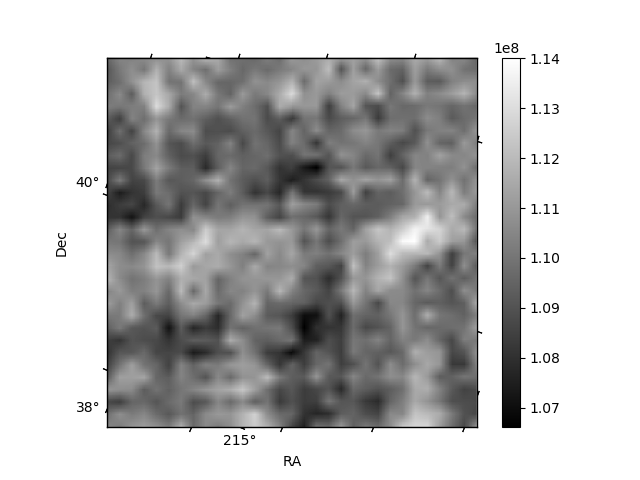
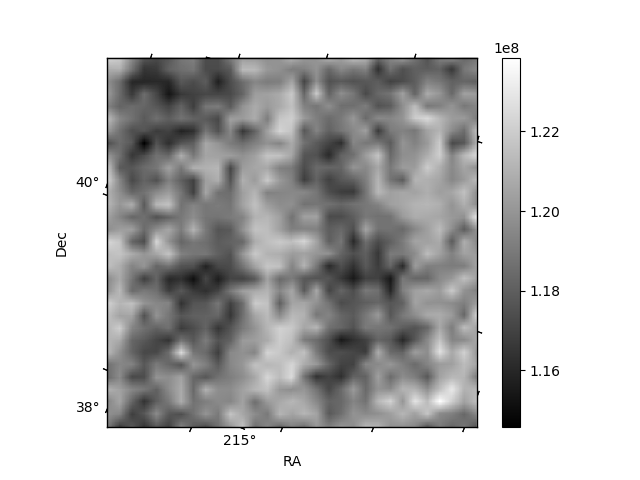
Histogram calculated using DETX and DETY for each event in the final _common_clean file
| Quadrant A | 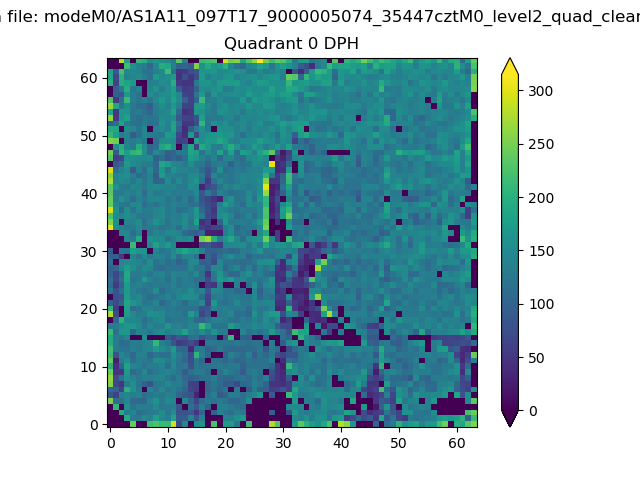 |
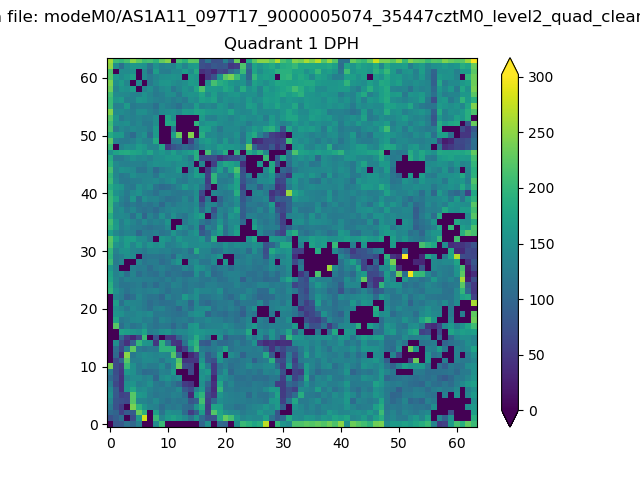 |
Quadrant B |
|---|---|---|---|
| Quadrant D | 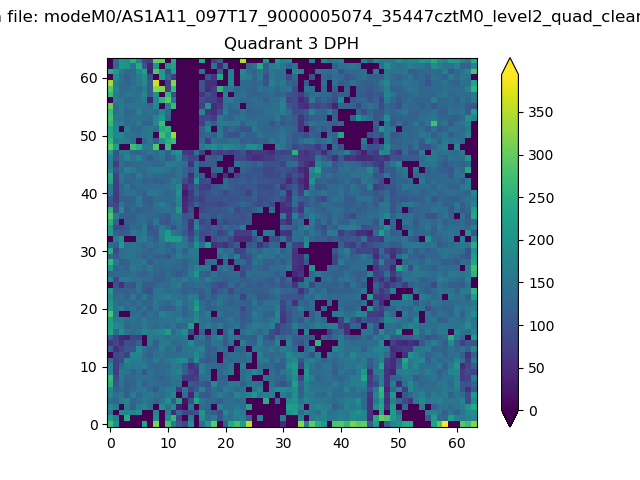 |
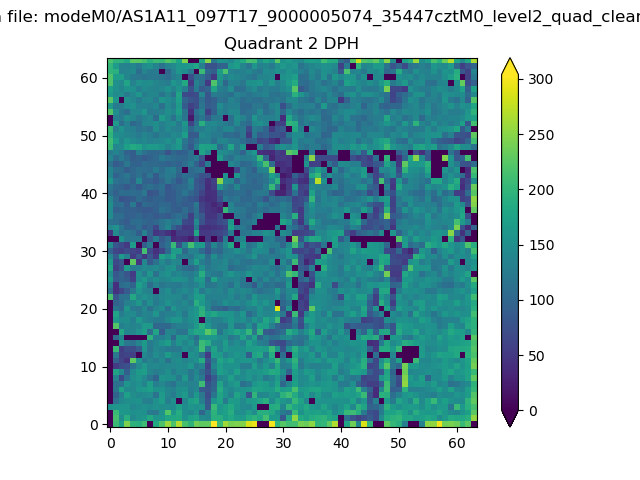 |
Quadrant C |
| Plot type | Count rate plots | Images |
|---|---|---|
| Comparison with Poisson distribution Blue bars denote a histogram of data divided into 1 sec bins. Red curve is a Poisson curve with rate = median count rate of data. |
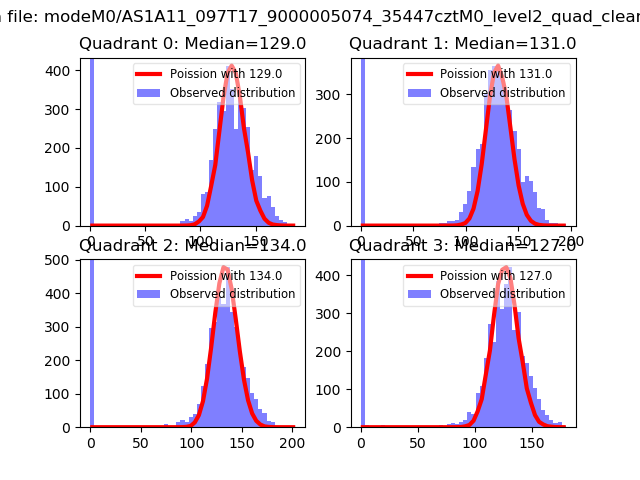 |
 |
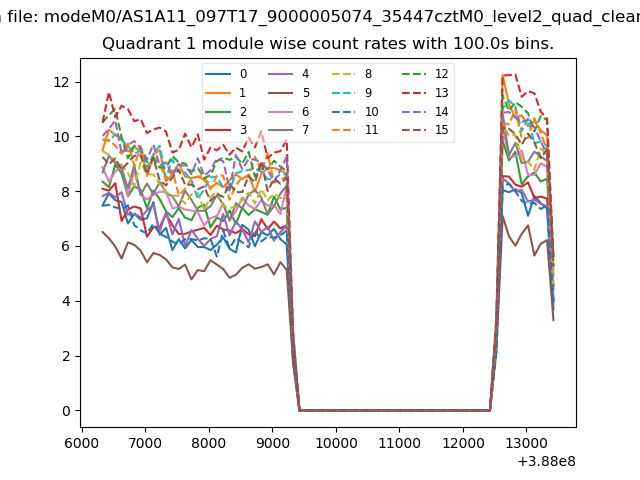
| Quadrant-wise count rates Data is divided into 100 sec bins |
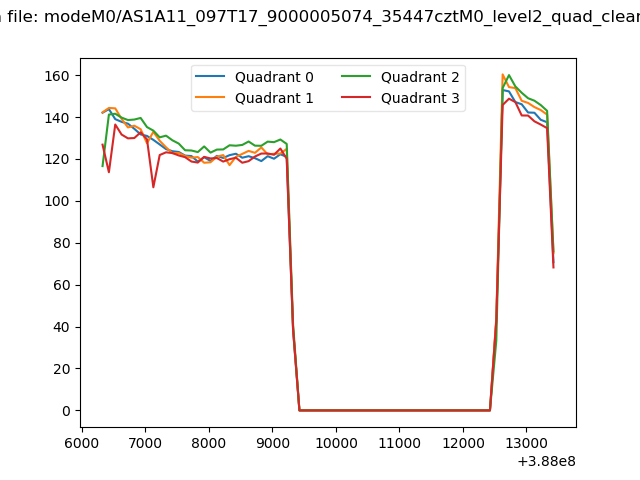 |
|
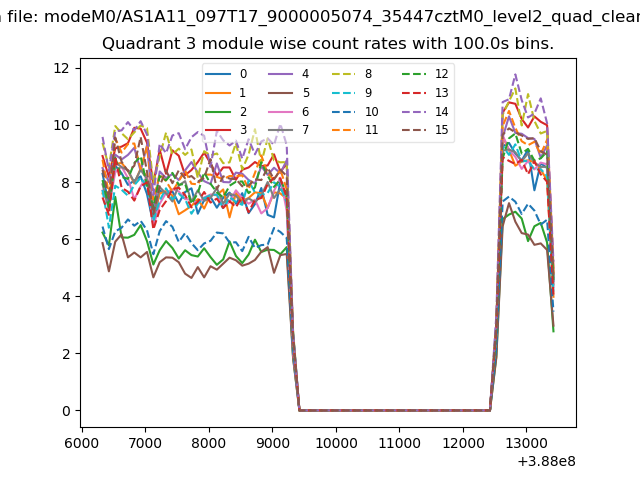
| Module-wise count rates for Quadrant A Data is divided into 100 sec bins |
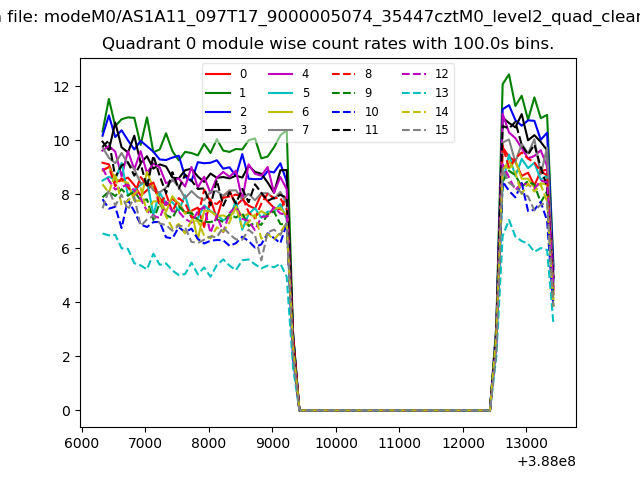 |
 |
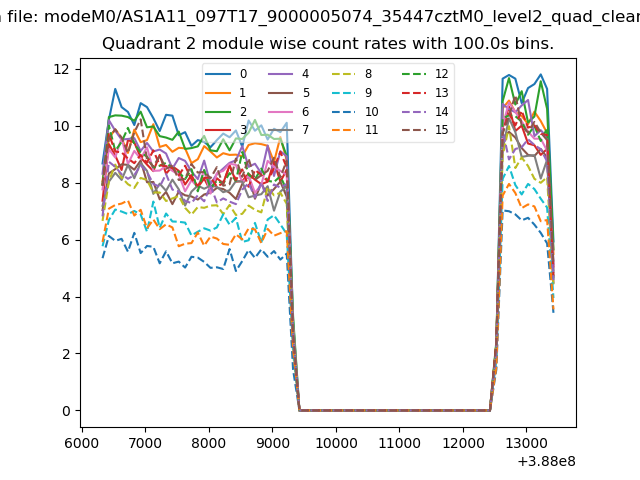
| Module-wise count rates for Quadrant B Data is divided into 100 sec bins |
 |
 |
| Module-wise count rates for Quadrant C Data is divided into 100 sec bins |
 |
 |
| Module-wise count rates for Quadrant D Data is divided into 100 sec bins |
 |
 |
| Parameter | Plot |
|---|---|
| CZT HV Monitor | 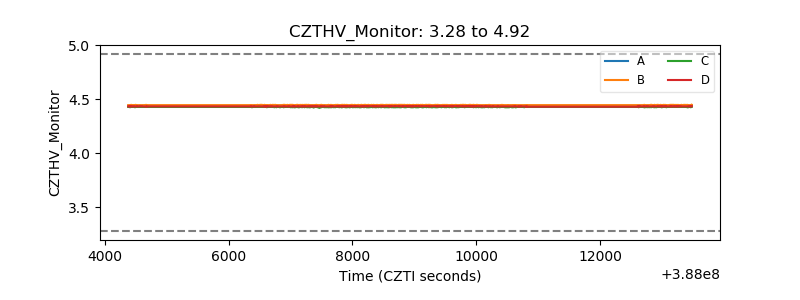 |
| D_VDD | 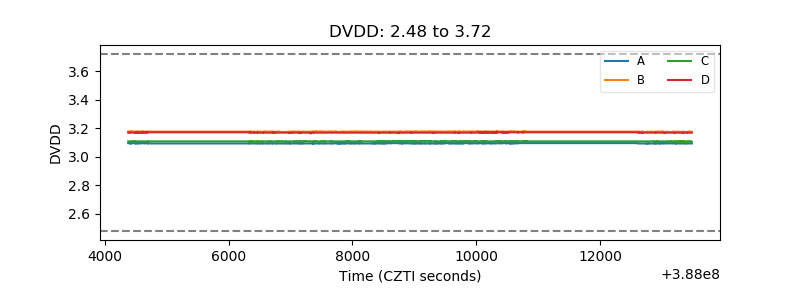 |
| Temperature 1 | 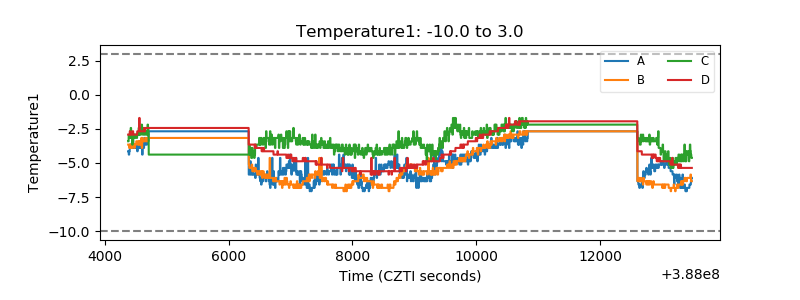 |
| Veto HV Monitor | 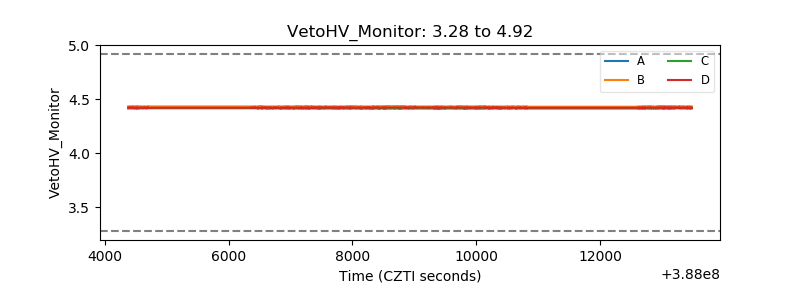 |
| Veto LLD | 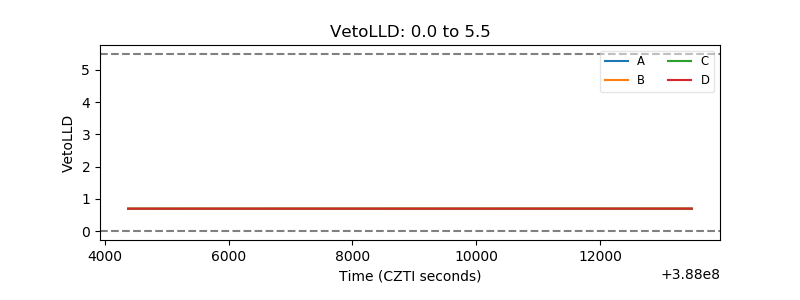 |
| Alpha Counter | 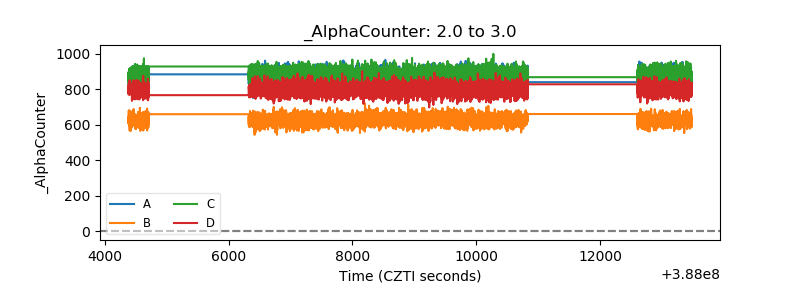 |
| _CPM_Rate | 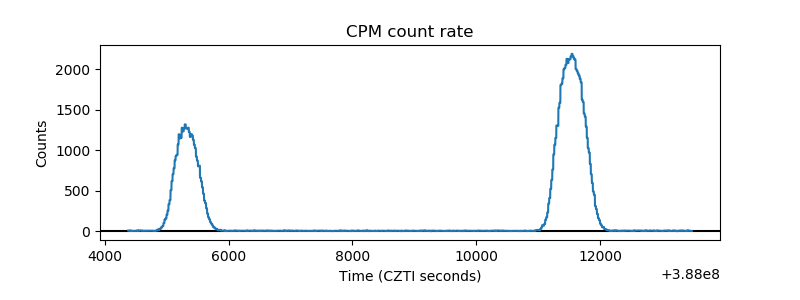 |
| CZT Counter | 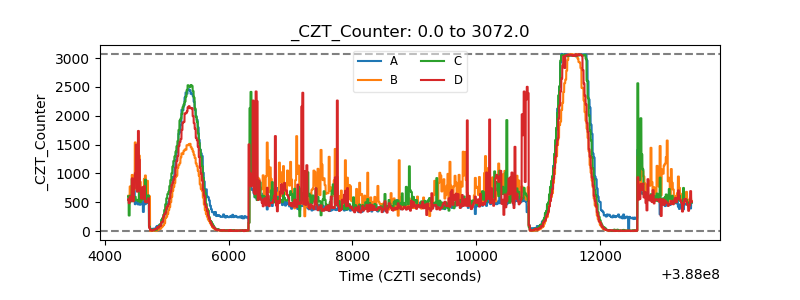 |
| +2.5 Volts monitor | 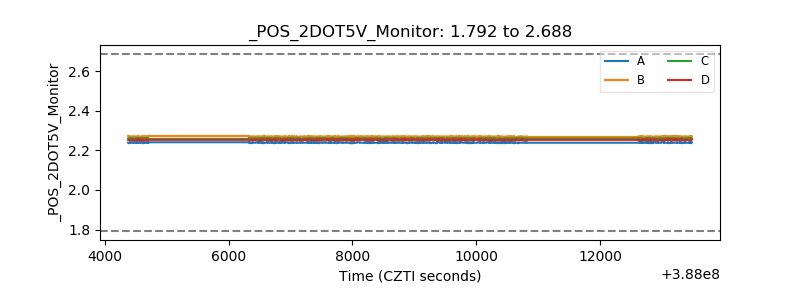 |
| +5 Volts monitor | 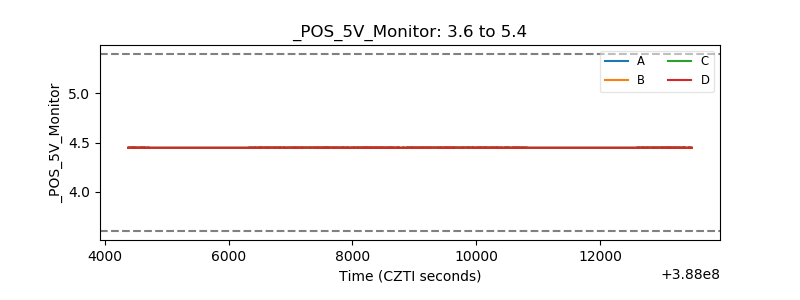 |
| _ROLL_ROT | 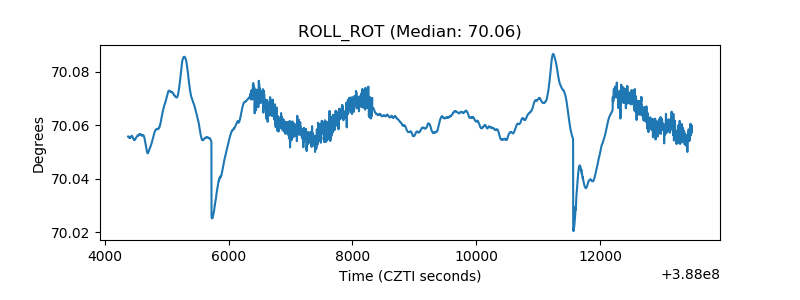 |
| _Roll_DEC | 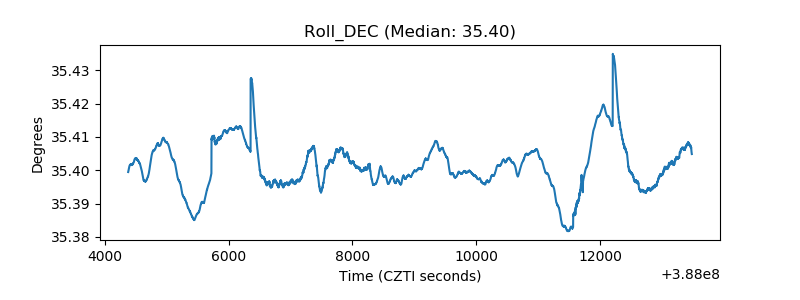 |
| _Roll_RA | 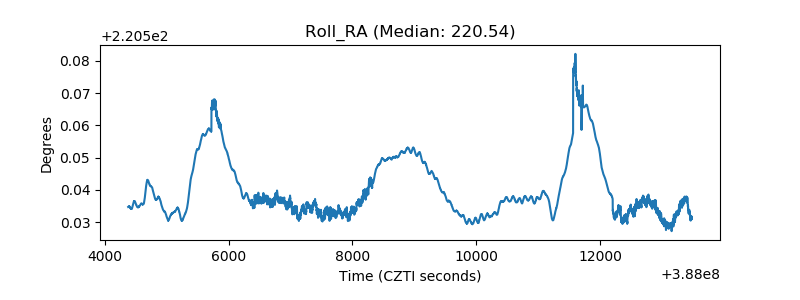 |
| Veto Counter | 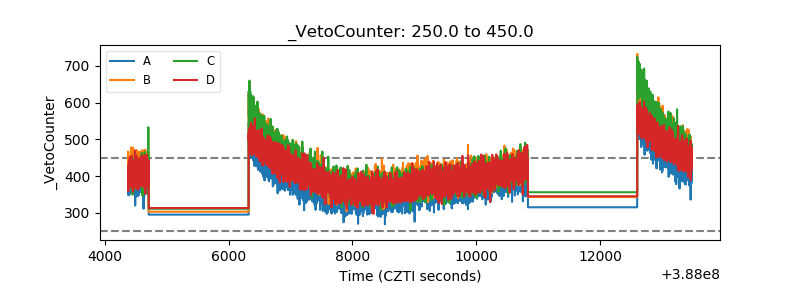 |